JEJAK
Journal of Economics and Policy
http://journal.unnes.ac.id/nju/index.php/jejak
Strategy of Increasing Food Security
based on Macro and Micro Aspects
Neni Widayaningsih1, Barokatuminalloh2
Fakulty of Economy and Business, Jenderal Soedirman University, Indonesia
Permalink/DOI: http://dx.doi.org/10.15294/jejak.v9i1.7190
Received: January 2016; Accepted: February 2016; Published: March 2016
Abstract
The preliminary studies that have been conducted show that the food availability in 27 districts in Banyumas Regency on average is still low. The purpose of this research is to formulate of a strategy to improve the food security by synergizing the macro and micro aspects. The method used is the tabulation analysis, IFE and EFE Matrix, and also IE Matrix. The IE matrix shows the food security based on the macro and micro aspects that are in the first cell, which means that the food security conditions are experiencing the growing and buliding. The strategies of improving the food security from the micro and macro aspects are first, to develop the food production in accordance with the potential and comodities of the excellent food in accordance with the specializations of regions (districts). Second, it requires a partnership and a cooperation of distributing the excellent food production. Third, the investment is required to improve the diversification of food. Fourth, it requires the cooperation between the farmers and the government agencies concerned with the development, supply and service of excellent means of agricultural production with supervision and increased credit services. Fifth, the off-farm activities should be developed by forming the cooperatives or the small and household businesses on the basis of farming activities. Besides, in order to meet the consumption of food that is safe, qualified, and nutritious, it is necessary to increase the knowledge and awareness about the food security at the household level by empowering the cooperatives or small and household businesses by utilizing Dasa Wisma group, PKK, Majelis Ta'lim, and other non-governmental groups.
Keywords: Food Security, Strategy, Micro and Macro Aspects
How to Cite: Widayaningsih, N., & Barokatuminalloh, B. (2016). Strategy of Increasing Food Security based on Macro and Micro Aspects. JEJAK: Jurnal Ekonomi Dan Kebijakan, 9(1), 111-128. doi:http://dx.doi.org/10.15294/jejak.v9i1.7190
© 2016 Semarang State University. All rights reserved
Corresponding author : ISSN 1979-715X
INTRODUCTION
Food is very important and is the primary need that must be fulfilled to make the people survive. Food security based on the Acts no. 7/1996 is the condition fulfilled of food for each household, which is reflected in the food availability that is adequate, both in quantity and quality, safe, equitable and affordable. The food security has three interrelated dimensions as follows: (a) food security at the macro or national level; the most important is the food availability based on the local resources (b) household food security; and (c) individual food security. The last two mentioned, the household and individual food security, depend on the eco-nomic ability to get food (R.B.Singh, 2013).
The food security seen from the food availability in Banyumas is still low. According to the research of Endang Sri Gunawati, Neni Widayaningsih, and Barokatuminalloh (2014), on average, from the availability of 17 commodities as the sources of carbohydrates and of protein whether sourced vegetables, eggs, poultry meat and ruminant meat, only three commodities that have the food security those are free-range chicken eggs, pure-bread chicken meat, and beef, while 14 other commodities have no food security.
The comparison of SLQ and DLQ of the food commodities in 2008-2012 in Banyumas, (i) a group of the sources of carbohydrates: the superior rice paddy having potential in the future and growing in 20 districts, the superior field paddy having potential in the future and growing in seven districts, the superior corn having potential in the future and growing in seven districts, the superior cassava having potential in the future and growing in six districts, the sweet potato commodities having potential in the future
and growing in three districts; (ii) a group of the sources of vegetable protein: the superior soy having potential in the future and growing in five districts, the superior green beans superior having potential in the future and growing in three districts, the superior peanut having potential in the future and growing in 12 districts; (iii) a group of the sources of animal protein: the superior pure-bread chicken eggs having potential in the future and available in 11 districts, the superior duck eggs having potential in the future and available in nine districts, whereas free-range chicken eggs have no superior districts and no potential in the future; (iv) a group of the sources of animal protein derived from meat: the superior free-range chicken meat having potential in the future and available in 18 districts, the superior pure-bread chicken meat having potential in the future and available in three districts, the superior duck meat having potential in the future and available in 17 districts; (v) commodities of the sources of animal protein derived from ruminant cattles: the superior cow commodity having potential in the future and available in three districts, the superior buffalo commodity having potential in the future and available in two districts, the superior goat commodity having potential in the future and available in four districts, and the superior sheep commodity having potential in the future and available in four districts.
aspects in Banyumas has a strong external position to utilize the existing opportunities in order to overcome the existing threats. It shows that the strategy of the increased food security based on the macro aspects in Banyumas is located on the first cell, which means that the cell can be described as a condition that is experiencing the growth and development. The strategy that can be applied to the conditions at the first cell is the intensive one in the form of market penetration, market development, and pro-duct development, or the integrative one in the form of integrative (backward inte-gration, forward integration and horizontal integration).
Seeing the food supply still low, then it requires a comprehensive strategy so that the food can be provided sufficiently and continuously. But the strategy is not enough based on the macro aspects only, it requires a synergy with the micro aspects to increase the food security not only at the macro level but also at the level of the household or micro level. The food security at the macro level will have no meaning if it is not followed at the micro level.
Strategies to increase the food security is not enough if it only takes into account the macro conditions, such as food availability, according to Rukhsana and Asraful Alam, Savita Ahlawat and Dhian Kaur, and Jikun Huang, Scott Rozelle, Hongxing Ni and Ninghui Li in 2013 and Erric Tollens (2000) that the macro policy is not enough yet to increase the food security in the household level; it requires the policies paying more attention to the micro conditions or the household characteristics to increase the household food security, such as the research of Ening Ariningsih and Handewi PS Rachman (2008), Adrisa, YL, Gwary , MM
and Shehu H. (2008), Raphael O. Babatunde and Enrica C. Martinetti (March 2010), Faharudin and Andy Mulyana (2012), Robynn Cox and Sally Wallace (2013), which takes into account the micro conditions such as the household income, the age of the head of family, the legal issues ever faced and the household characteristics that will affect the food security conditions of the households.
The micro condition is an important factor to know the state of food security at the household level, although the macro food security, especially in terms of the food supply and the efficient marketing system, does not ensure the equal access to the food for the entire population. The conditions in Tanzania shows that the macro food production is enough but at the micro level are still experiencing the food insecurity (Erric Tollens, 2000). Jikun Huang et al, (2013) stated that to improve the household food security and the nutritional status require the government policies to encourage the growth of agriculture and farmers' income through the technological development, the institutional changes, the liberalization of prices and markets, the rural economic development, and the conducive policy and the trade liberalization, and the domestic reforms to give the impact of increase in the access of households to the nonagricultural employment and the wage income from the off –farm activities.
those are the households and the individuals (Savita Ahlawat and Dhian Kaur, 2013). The result research of Raphael O. Babatunde and Enrica C. Martinetti (2010) showed that the level of household food security is increased when there are remittances from abroad because their family members work abroad.
Pieters et al, (2013) showed that to in-crease the food security requires the policies not only at the macro level but also at the micro-level; it is because the food security at the macro level does not guarantee the food security at the micro level. The factors affecting the food status and the social nutrition in the short term are the policy of security and social assistance, while for long-term of public services are the social policy and the resource policy. At the macro level, the factor that plays the important role is the level of food prices. This is because the demand for food will greatly depend on the income and the food prices.
The formulation of strategies to increase the food security by paying attention on the characteristics of the household is very much needed especially based on the results of research on the household level by Barokatuminalloh and Neni Widayaningsih (2011 and 2012), which showed that most respondents are in the category of food insecurity. Under the conditions of food security seen from the availability of food and the low status of food security at the household level in Banyumas Regency, it requires the strategies that synergize both the macro and micro aspects.
The aims of this research are as follows:
first, to identify the characteristics of the
household seen from the educational level, the livelihood, the age of the head of family, the responsibility of family, and the level of family income; second, to identify the pattern
of expenditure conducted by each of house-holds especially the expenditure to fulfill their food needs; third, to identify the type of food consumed to fulfill the needs of protein and energy; fourth, to formulate the strategy for increasing the food security seen from the micro aspect by paying attention on the condition and strategy of the macro aspects.
RESEARCH METHODS
The approach used is the multidisci-plinary of science with a concentration of resource economics. The research method used is the qualitative and quantitative methods. The research location is in Banyumas Regency that covers 27 districts, with research time in May-July 2015. The Data are collected by the observation and the structured interviews, while the informants are determined by using the snowball technique.
Some of the analytical tools used in this research are as follows: the Analysis of Tabulation to know the characteristics of households in Banyumas Regency. The tabulation method is a very simple one but has the ability to explain sufficiently high level. This method only compares one category with another one. The next analysis tool is the Analysis of Internal and External (IE) to determine the strengths, weaknesses, opportunities and threats/ constraints in the communities to increase the social food security based on the social characteristics. This analytical technique uses the methods of Internal Factor Evaluation Matrix (IFE) and External Factor Evaluation Matrix (EFE).
factors of strengths and weaknesses of the characteristics of the target households in Banyumas, (b) Determining the weights for each of these factors. In determining the weights it uses a scale of 1.0 (the most important) to 0.0 (not important). The amount of all the weights should not exceed the total number of 1.00. The weights are
(c) Determining the rating on each of these factors. The rating scale used is: 1 = main weakness, 2 = small weakness, 3 = small strength, 4 = main strength. (d) Multiplying the value of each weight of the factors to the ratings to determine the score of weight. (e) Summing the score of weight to determine the score of weight. (f) The total score of weight is between 1.00 to 4.00. The values from 1.00 to 1.99 indicate a weak internal position, the values from 2.00 to 2.99 indicate the average consideration, and the values from 3.00 to 4.00 indicate a strong internal position.
Table 1.IFE Matrix
Internal
Factors Weight Rating
Total Score
characteristics of the target households in Banyumas Regency. (b) Determining the weight of each factor, in which the weight is determined by using the scales of 1.0 (the most important) to 0.0 (not important). The amount of all the weights should not exceed the total number of 1.00. The weights are calculated using the formula as follows:
Rating Rating Weight
(Husein Umar, 1999)
(c) Determining the rating on each factor, in which the rating scale is: 1 = low, the response is less, 2 = moderate, the response is average, 3 = high, the response is above the average, 4 = very high, the response is superior. (d) Multiplying the value of factor weight value by rating, which determining the score of weight. (e) Summing the score of weight, which determining the score of weight. (f) The total score of weight is 1.00-4.00. The value of 1.00 indicates that the society cannot take advantage of the opportunities and cannot overcome the threat. The value of 4.00 indicates that the society respond to the opportunities and threats very well.
Table 2.EFE Matrix
Internal
Factors Weight Rating
Total Score
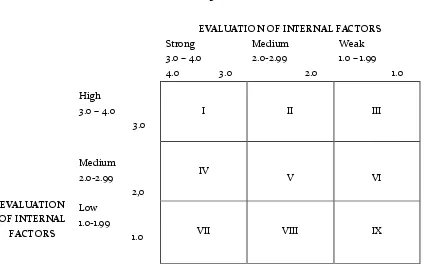
putting the score of weight of IFE matrix on the x-axis (horizontal), while the total score of weight of EFE matrix is placed on the y-axis (vertical). The IE matrix is divided into three major parts that have implications for different strategies as follows: (a) The division in cell I, II, IV can implement the strategies to grow and build. The strategies can be in te form of either intensive or integrative strategy. (b) The division in cell III, V, VII can implement the strategies to hold and maintain. (c) The division in cell VI, VIII, IX can implement the strategies to hold and divest). The more details can be seen in IE matrix table 3 below.
RESULTS AND DISCUSSION
The characteristics of respondents indicate that the educational level is still low, 62.8 percent have only finished the Elementary School. The livelihoods of 63 percent of respondents are workers, most
respondents age group is 44-56 years BY 37.2 percent, 60.2 percent of men and 39.8 percent of women, the number of dependents is an average of 2.8. The average household income is Rp. 1,000,391, with the most income in the group Rp 200,000 – Rp 960.000 of 54.38 percent. The average expenditure of both food and non-food amounted to Rp.970.268, with minimum expenditure of Rp 119,000 and maximum of Rp2.121.000. The more details of expenditure can be seen in Table 4.
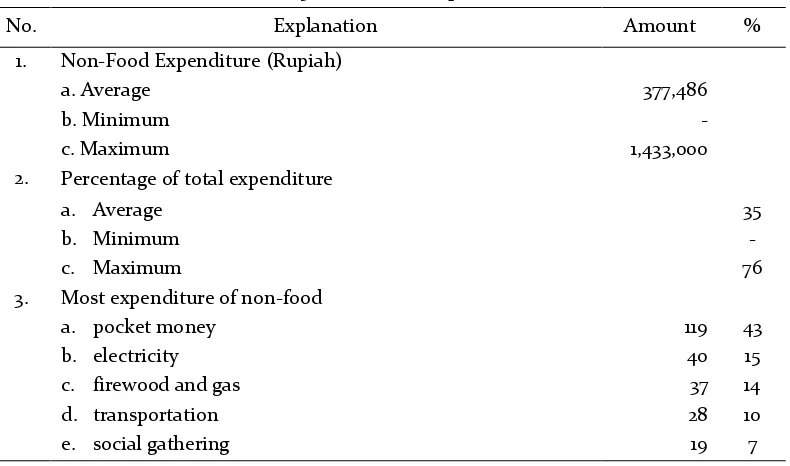
The level of expenditure is made by the households in the form of food and non food. The non-food expenditure made by the respondent is an average of 35 percent and the largest expenditures for non-food is for pocket money (43 percent). Noteworthy, there are the households with the largest non-food expenditures to buy cigarettes at 5 respondents. The more details on non-food expenditure can be seen in Table 5.
Table 3. IE Matrix
EVALUATION OF INTERNAL
FACTORS
EVALUATION OF INTERNAL FACTORS Strong
3.0 – 4.0 4.0 3.0
Medium 2.0-2.99 2.0
Weak 1.0 – 1.99 1.0
High 3.0 – 4.0
3.0
I II III
Medium 2.0-2.99 2,0
IV
V VI
Low 1.0-1.99
1.0 VII VIII IX
Table 4. Average Expenditure Level of Respondens Every Month
Range of Expenditure Total respondent Percentage
119,000 – 519,400 40 15
519,401 – 919,800 99 36
919,801 – 1,320,200 66 24
1,320,201 – 1,720,600 53 19
1,720,601 – 2,121,000 16 6
Total 274 100
Table 5. Non-Food Expenditure
No. Explanation Amount %
1. Non-Food Expenditure (Rupiah)
a. Average 377,486
b. Minimum -
c. Maximum 1,433,000
2. Percentage of total expenditure
a. Average 35
b. Minimum -
c. Maximum 76
3. Most expenditure of non-food
a. pocket money 119 43
b. electricity 40 15
c. firewood and gas 37 14
d. transportation 28 10
e. social gathering 19 7
The next expenditure is the food expen-diture by an average of 65 percent of the total. Thus, the food is still a major part of household expenditure. The more details on the food expenditure can be seen in Table 6.
Having seen the proportion of food and
non food expenditure, it requires the information about the initial conditions of food security for further analysis. The food security status in the family is closely related to how much expenditure is made for the needs of daily food.
Table 6.Food Expenditure
No. Explanation Amount %
1. Food Expenditure (Rupiah)
a. Average 592,781
b. Minimum 40,000
c. Maximum 1,551,500
2. Percentage of total expenditure
a. Average 65
b. Minimum 24
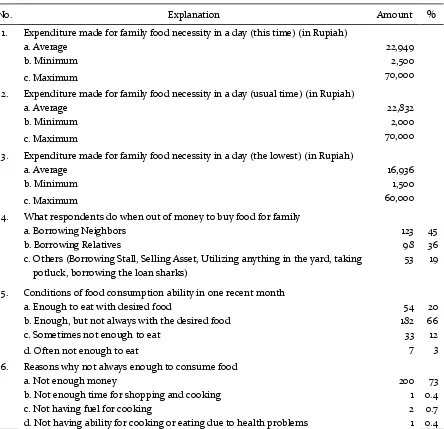
Nevertheless, many expenditures alone are not enough to describe the food security conditions. The amount of expenditure is only as the initial question and a general overview of the households but is not included as an indicator for food security. The average expenditure for the needs of daily food of the households in a day amounted to Rp 22,949,- (time of survey); Rp 22,382,- (usual) and Rp 16.936,- (lowest). Based on the research, it is not much different between the consumption at the time of survey and the usual condition, only a few households that experience a decrease or an increase; this indicates that the consumption of each family from time to time does not change.
Besides the daily food expenditure, the indicator used is what is done when the households are out of food supply and they have no income to obtain it. The majority of respondents have answered by borrowing the neighbors (45 percent), borrowing the relatives (36%), and the rest is 19 percent of borrowing the stall, selling the assets, utilizing anything in the yard, taking potluck, and also some respondents borrowing the loan sharks. Such conditions indicate that there is still a close family relationship and the close neighborhood relationship in rural areas. They help each other with one another, although actually their own situation is not much different. It is one of the advantages of living in the rural areas.
The initial description used further is how the ability og food consumption of each household is in on recent month. The majority of respondents (66 percent) answered that they have enough to eat but not always with the desired food type, while others (20 percent) have enough to eat, and
only a few (3 percent) that do not eat enough. The majority of the reasons why the households do not always consume the desired and qualified food is due to the insufficient income earned for food; this condition is experienced by 73 percent of the total respondents.
Based on some initial questions asked and the majority of answered delivered by the respondents, in general it can be seen that most of the respondents’ households still have relatively poor food security conditions. The more details on the initial conditions in the household food security can be seen in Table 7.
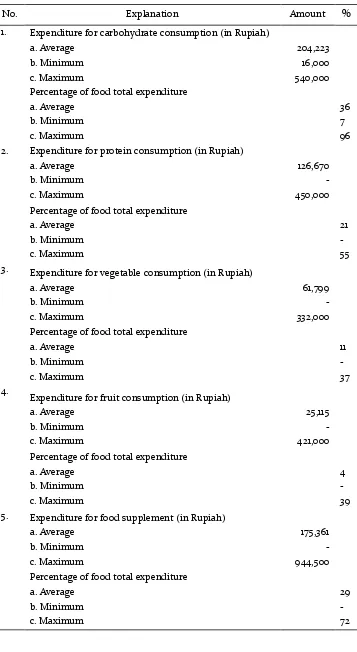
After the analysis of the initial conditions of food security in the family, it requires to study the proportion of food types consumed so that the expenditure and the types of food consumed by the
respondents’ households can be seen, as
shown in Table 8.
The types of carbohydrates consumed primarily are rice, and then corn, cassava, sweet potato, and oyek. There are 13.5 percent (37 respondents) that add to the cassava with an average cassava consumption of 8.209 percent of the total of carbohydrate consumption, 11 respondents or 4.015 percent that add to the sweet potatoes with the percentage of consumption of 4.5 per cent of the total of carbohydrate consumption, and there are 4 respondents (1.46 percent) that add to the corn consumption that is 0.362 percent compared to the total of carbohydrate consumed.
The major consumptions of vegetable protein are tahu, tempeh, soy, peanuts, and green beans. The respondents consuming the soy in direct form are only a little, in general the soy consumption is more in the form of
an ingredient in dishes with very little portions, for example as an ingredient in making vegetable nodes. The next source of protein consumed is peanuts and green beans with a little portion, and only 8 or 3 percent of respondents who consume. People consume peanuts for a snack, or for a mixture in dishes, so the portions are very small.
The sources of poultry protein are free-range chicken, broiler chicken, and ducks,
but mostly from broiler chicken. One of the reasons is because the price of broiler chicken is more affordable than the other poultry. Although some respondents have the free-range chicken to utilize the yard, the results are not for consumption but are sold as extra income, because the price of free-range chicken is relatively high. It is not so different from the ducks; the respondents prefer to sell their ducks especially when they need money.
Table 7.Initial Condition of Food Security in Households
No. Explanation Amount %
1. Expenditure made for family food necessity in a day (this time) (in Rupiah)
a. Average 22,949
b. Minimum 2,500
c. Maximum 70,000
2. Expenditure made for family food necessity in a day (usual time) (in Rupiah)
a. Average 22,832
b. Minimum 2,000
c. Maximum 70,000
3. Expenditure made for family food necessity in a day (the lowest) (in Rupiah)
a. Average 16,936
b. Minimum 1,500
c. Maximum 60,000
4. What respondents do when out of money to buy food for family
a. Borrowing Neighbors 123 45
b. Borrowing Relatives 98 36
c. Others (Borrowing Stall, Selling Asset, Utilizing anything in the yard, taking potluck, borrowing the loan sharks)
53 19
5. Conditions of food consumption ability in one recent month
a. Enough to eat with desired food 54 20
b. Enough, but not always with the desired food 182 66
c. Sometimes not enough to eat 33 12
d. Often not enough to eat 7 3
6. Reasons why not always enough to consume food
a. Not enough money 200 73
b. Not enough time for shopping and cooking 1 0.4
c. Not having fuel for cooking 2 0.7
Table 8. Proportion of consumed food types
No. Explanation Amount %
1.
Expenditure for carbohydrate consumption (in Rupiah)
a. Average 204,223
b. Minimum 16,000
c. Maximum 540,000
Percentage of food total expenditure
a. Average 36
b. Minimum 7
c. Maximum 96
2. Expenditure for protein consumption (in Rupiah)
a. Average 126,670
b. Minimum -
c. Maximum 450,000
Percentage of food total expenditure
a. Average 21
b. Minimum -
c. Maximum 55
3. Expenditure for vegetable consumption (in Rupiah)
a. Average 61,799
b. Minimum -
c. Maximum 332,000
Percentage of food total expenditure
a. Average 11
b. Minimum -
c. Maximum 37
4.
Expenditure for fruit consumption (in Rupiah)
a. Average 25,115
b. Minimum -
c. Maximum 421,000
Percentage of food total expenditure
a. Average 4
b. Minimum -
c. Maximum 39
5. Expenditure for food supplement (in Rupiah)
a. Average 175,361
b. Minimum -
c. Maximum 944,500
Percentage of food total expenditure
a. Average 29
b. Minimum -
The sources of protein derived from eggs are not much different from the poultry. The respondents prefer to consume the broiler chicken eggs for a more affordable price; only a few respondents who consume free-range chicken eggs. While for other types of eggs consumed are the quail eggs and the duck eggs, but with a small portion.
The sources of protein derived from ruminant poultry is only 29 respondents or 11 percent who consume the beef meat, with very little portion, an average of only 1 ounce every month. The respondents consume the beef meat only as a mixture to add the flavor of the food, or in the refined form such as meatballs; it is also done only once, especially when the children request. While for the mutton only 3 respondents who consume it, and it is also very rare. Further information is that the respondent could consume the meat from ruminant poultry during the Eid al-Adha, but the condition also does not happen every year because every year the worship sacrifice is not always conducted every year in their environment.
The sources of vitamins and micro nutrients required by the body are derived by the people from various types of consumed vegetables. Not all types of consumed vegetables are preferred; the respondents prefer the vegetables with more affordable price in order to support the family members’ need with limited income. For the types of relatively expensive vegetables, almost no respondents consume it, some of which include broccoli, cauliflower, various kinds of mushrooms, peppers and a variety of other expensive vegetables. Some vege-tables commonly consumed and acquired by buying them in the stalls or markets are: kale, eggplants, long beans, carrots, squash, chicory, winged bean, oyong, gendot and
sprouts. Besides, the respondents, especially those living in rural areas, often use the yard for growing various kinds of plants which fruits or leaves can be consumed so that not all the time they have to buy, among others are: spinach, cassava leaves, papaya leaves, katu leaves, melinjo leaves, young papaya, young jackfruit and banana heart. For those who have no yard, they, the respondents in rural areas, usually could ask the vegetables to the neighbors who have the yard. This habit is one form of togetherness and mutual help.
limited income; the fruits are not important for them and they only consume them at certain times.
The expenditure for supplementary food ingredients is more widely used for buying the spices, cooking oil and beverage ingre-dients such as tea, coffee and sugar. Not all respondents consume milk, only 25 percent of respondents who consume milk especially those having toddlers. Besides the additional food above, the respondents also buy the crackers and instant noodles. The two types of food have relatively affordable price, so it is often used as an option of consumption especially when the income is very limited for buying food.
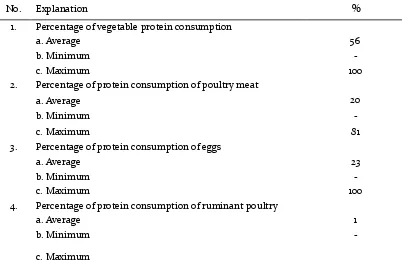
Furthermore, after examining the pro-portion of consumed food, then it also needs to see the proportion of the type of consumed protein compared to the total of consumed protein concerning that the needs of protein is much needed for the brain nutrients and for replacing the damaged cells. Table 9 indicates that the consumption of vegetable protein is an average of 56 percent; the poultry meat is an average of 20 percent, from the eggs is an average of 23 percent and from the ruminant poultry is an average of one percent. Viewed from the average number, it can be said that the type of consumed protein is good enough because the average have consumed the poultry and eggs although only a fifth of the total.
Table 9.Proportion of Consumed Protein compared with total of consumed protein
No. Explanation %
1. Percentage of vegetable protein consumption
a. Average 56
b. Minimum -
c. Maximum 100
2. Percentage of protein consumption of poultry meat
a. Average 20
b. Minimum -
c. Maximum 81
3. Percentage of protein consumption of eggs
a. Average 23
b. Minimum -
c. Maximum 100
4. Percentage of protein consumption of ruminant poultry
a. Average 1
b. Minimum -
Analysis of Internal Factor Evaluation (IFE) and External Factor Evaluation (EFE) Matrix
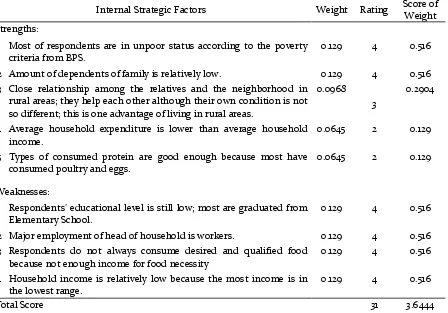
The Internal Factor Evaluation (IFE) Matrix is a matrix of identification of the internal factors of increasing the food security based on the micro aspects in Banyumas Regency in the form of strategic factors of strengths and weaknesses of the food security in Banyumas. The analytical result of the Internal Factor Evaluation (IFE) matrix indicates that the total value of the score of weight of IFE matrix is at 3.6444. This shows that the increase in food security based on the micro aspects in Banyumas has a strong internal position in using the strengths to overcome the weaknesses. More clearly, the following is the analytical result of the Internal Factor Evaluation (IFE) matrix that is presented in Table 10.
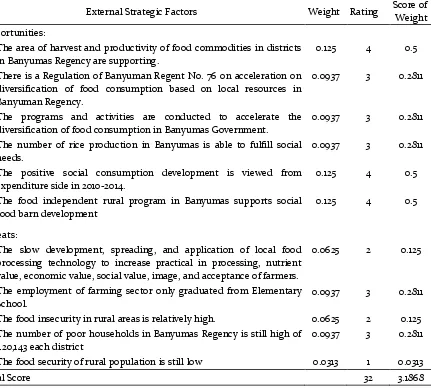
The External Factor Evaluation (EFE) Matrix is a matrix of identification of the external factors of increasing the food security by the micro aspects in Banyumas Regency in the form of strategic factors of opportunities and threats of the food security in Banyumas. The analytical result of the External Factor Evaluation (EFE) matrix indi-cates that the total value of the score of weight of EFE matrix is at 3.1868. This shows that the increase in food security based on the micro aspects in Banyumas has a strong external position to utilize the existing opportunities in order to overcome the existing threats. More clearly, the following is the analytical result of the External Factor Evaluation (EFE) matrix that is presented in Table 11.
Table 10. Internal Factor Evaluation (IFE) Matrix of Increasing Food Security Based on Micro Aspects in Banyumas Regency
Internal Strategic Factors Weight Rating Score of Weight Strengths:
1 Most of respondents are in unpoor status according to the poverty criteria from BPS.
0.129 4 0.516
2 Amount of dependents of family is relatively low. 0.129 4 0.516 3 Close relationship among the relatives and the neighborhood in
rural areas; they help each other although their own condition is not so different; this is one advantage of living in rural areas.
0.0968 3
0.2904
4 Average household expenditure is lower than average household income.
0.0645 2 0.129
5 Types of consumed protein are good enough because most have consumed poultry and eggs.
0.0645 2 0.129
Weaknesses:
1 Respondents’ educational level is still low; most are graduated from
Elementary School.
0.129 4 0.516
2 Major employment of head of household is workers. 0.129 4 0.516 3 Respondents do not always consume desired and qualified food
because not enough income for food necessity
0.129 4 0.516
4 Household income is relatively low because the most income is in the lowest range.
0.129 4 0.516
Table 11.External Factor Evaluation Matrix of Increasing Food Security Based on Macro Aspects in Banyumas Regency
External Strategic Factors Weight Rating Score of Weight Opportunities:
1 The area of harvest and productivity of food commodities in districts in Banyumas Regency are supporting.
0.125 4 0.5
2 There is a Regulation of Banyuman Regent No. 76 on acceleration on diversification of food consumption based on local resources in Banyuman Regency.
0.0937 3 0.2811
3 The programs and activities are conducted to accelerate the diversification of food consumption in Banyumas Government.
0.0937 3 0.2811
4 The number of rice production in Banyumas is able to fulfill social needs.
0.0937 3 0.2811
5 The positive social consumption development is viewed from expenditure side in 2010-2014.
0.125 4 0.5
6 The food independent rural program in Banyumas supports social food barn development
0.125 4 0.5
Threats:
1 The slow development, spreading, and application of local food processing technology to increase practical in processing, nutrient value, economic value, social value, image, and acceptance of farmers.
0.0625 2 0.125
2 The employment of farming sector only graduated from Elementary School.
0.0937 3 0.2811
3 The food insecurity in rural areas is relatively high. 0.0625 2 0.125 4 The number of poor households in Banyumas Regency is still high of
420,143 each district
0.0937 3 0.2811
5 The food security of rural population is still low 0.0313 1 0.0313
Total Score 32 3.1868
Analysis of Internal Eksternal (IE) Matrix
After getting the analytical results of the Internal Factor Evaluation (IFE) and External Factor Evaluation Matrix (EFE) matrix, the next step is putting the calculation results into the Internal External (IE) Matrix. IE Matrix aims to facilitate in obtaining the food security development strategy based on the macro aspects in Banyumas Regency, which will be more detailed when formulating the strategic alternatives. IE matrix is based on two key dimensions: total of score of weight of IFE matrix on the x axis and of EFE matrix on the y axis. On the x-axis of IE matrix, the total of weighted score
of 1.0 to 1.99 indicates the weak internal position; the total of weighted score of 2.0 to 2.99 indicates the average internal position; the total of weighted score of 3.0 to 4.0 indicates the strong internal position. As well as on the y-axis of IE matrix, the total of weighted score of 1.0 to 1.99 indicates the weak external position; the total of weighted score of 2.0 to 2.99 indicates the average external position; the weighted score of 3.0 to 4.0 indicates the strong external position.
grouped into three main areas. The division located in cell I, II and IV can be described as a division that is experiencing to grow and build. The strategies applied to divisions in the position of cell II and IV are intensive strategies (market penetration, market development and product development) or integrative strategies (backward integration, forward integration and horizontal integration). The divisions located in cell III, V and VII can be well managed through strategies to hold and maintain. The market penetration strategy and product development strategy are generally used against the divisions in the three cells. Then the divisions in cell VI, VIII and IX can be well managed by the strategy to harvest or divest.
From the analytical result of the IFE matrix, the total of weighted score is at 3.6444, which means that the x-axis of IE matrix indicates the strong internal position. While the analytical result the EFE matrix, the total of weighted score is at 3.1868, which means that the y-axis of IE matrix indicates the strong external position.
The analytical result of IE Matrix indicates an increase in the food security based on the aspects in Banyumas in cell I. This means that the cell can be described as the condition that is experiencing to grow and build. The strategy applied to the condition in the position of cell I in the increase in the food security based on the micro aspects in Banyumas Regency is the intensive form of market penetration, market development, and product development, and the integrative strategy in the form of backward integration, forward integration and horizontal integration.
The market penetration strategy is the development of food production in
accordance with the potential of the district areas considering the harvested area and productivity of food commodities in the districts in Banyumas that are supportive. Besides, it requires the socialization on nutrition and health to form the families and communities that are aware of nutrition and behave positively, as well as the nutrition campaign for improving the image of local food.
The market development strategy is by increasing the intervention in order to be efficient and effective on food aid or subsidized food to the poor segments of society and by developing the subsidized food for special groups in needs (children and pregnant women with low nutrition). The product development strategy is by conducting the development of food business to increase the additional value of economy, nutrition and quality of food availability that are diverse and nutritionally balanced through the strengthening of cooperation between the government, society, and private.
The backward integration strategy is the conservation of land and water resources through the rehabilitation and conservation of natural resources. Besides, it requires the development, supply, and superior service of means of production with supervision, and also the increased credit services that are easily accessible by the farmers and the farmer groups.
knowledge and awareness about the food security, especially at the household level which implementation can empower Dasa Wisma group, PKK, Majelis Ta’lim, Farmer Groups, and other independent groups.
The horizontal integration strategy is like the food reserve system development through the food barns or Institute of Rural Economy Enterprises. Besides, the provision of food aid to the poor communities and those committing the disasters should be precise in target, time and product.
The formulation synergy of strategy to increase the food security based on the micro and macro aspects in Banyumas are: first, to develop the food production accordance with the potential of the region and the superior food commodities in accordance with the regional specializations (districts). Second, it requires partnership and cooperation in the distribution of superior food commodity production with the parties involved in the marketing system of food commodities, so that it will be efficient and effective especially the commodities of subsidized food for the poor community group, and the development of subsidized food for special groups in need (children and pregnant women who have low nutrition). Third, the investment is needed to increase diversification of food through food business development to increase the value added of economy, nutrition and quality of food availability that are diverse and nutritionally balanced through the strengthening the cooperation between the government, society, and private. Fourth, it requires the cooperation between the farmers or farmer groups with the government agencies related to the development, supply and service of superior means of production with supervision, as well as increased the credit
services that are easily accessible by the farmers and the farmer groups. Fifth, to develop a variety of off-farm activities by forming cooperatives or small businesses and households on the basis of farming activities in order to increase the diversification of foo and to improve the welfare of farmers. Besides, in order to fulfill the consumption of safe, qualified, and nutritious food, it is necessary to increase the knowledge and awareness about the food security, especially at the household level which implementation can empower the formation of cooperatives or small businesses and households above also by utilizing Dasa Wisma group, PKK, Majelis Ta'lim, and other independent groups. Thus the formulation of the strategies above can be synergized by overcoming the food insecurity of poor households in both rural and urban areas in in Banyumas Regency
CONCLUSION
eggs, and one percent ruminant); 11 percent of vegetables, 4 percent of fruits, and 29 percent of complementary food. That most households still have relatively poor food security conditions, even if viewed on the poverty criteria from BPS, the majority of respondents are not in poor status
The analytical result of IE Matrix shows an increase in the food security based on the aspects in Banyumas Regency in cell I. This means that the cell can be described as a condition that is experiencing to grow and build. The strategy applied to the conditions that are in the position of cell I in the increase in the food security based on the micro aspects in Banyumas is an intensive strategy in the form of market penetration, market development, and product development and an integrative strategy in the form of backward integration, forward integration and horizontal integration.
The strategy formulation of both the micro and macro aspects can be synergized in order to achieve the system of food security and nutrition related to production, distribution, and supply of food at a macro level, both in national and regional areas and also about the micro aspects, ie the access to food at the household level and the individual and also the nutritional status of household members. The implication that can be drawn is that the system of food security and nutrition is not only about the production, distribution, and supply of food at a macro level, both nationally and regionally ranging from the province, regency / city, district, to village, but also about the micro aspects, those are the access to food at the household level and the individual and also the nutritional status of household members, especially children and pregnant women from poor households. It
requires the continuous improvement efforts conducted by the government (the related department: agricultural, council food security, industry, trade and cooperatives, health, religion and banking institutions), because the state is obliged to realize the availability of food in order to realize the affordability and fulfillment of food consumption with safety, quality and nutrition. Besides, people also need to be active through the community groups that exist (Dasa Wisma, PKK, Posyandu, WG, Cooperatives, Farmers Group, Majelis Ta'lim and other groups), in order to increase the knowledge as well as better access to education, health and especially food. Thus, all development actors (government, private and public) in hand to achieve the targets of the Millennium Development Goals (MDGs) that is decreasing poverty and hunger as an indicator of human welfare.
REFERENCES
Ahlawat, Savita and Dhian Kaur, 2013. Food Security in India: A Case Study of Kandi Region of Punjab”. World Academy of Science, Engineering and Technology. Vol:7 2013-04-28. http://waset.org/ publications/7483/food-security-in-india-a-case-study-of-kandi-region-of-punjab, diakses pada tanggal 13 Oktober 2014.
Adrisa, Y.L., Gwary, M.M. dan Shehu H. 2008. Food Security Status Among Farming Households in jere local Government of Borno State, Nigeria.
Journal of Tropical Agriculture, Food, Environment and Extension, Vol 7 No. 3 Sept2008 pp 199-205
Ariningsih, Ening & Handewi P.S. Rachman, 2008. Strategi Peningkatan Ketahanan Pangan Rumah Tangga Rawan Pangan. Jurnal Analisis Kebijakan Pertanian. Volume 6 No. 3, September 2008 : 239 – 255.
Babatunde, Raphael O. dan Enrica C. Martinetti, 2010.
“Impact of remittances on food security and
nutrition in rural Nigeria”. http://www.ifad.
Barokatuminalloh dan Neni Widayaningsih, 2011. Analisis Ketahanan Pangan Pada Rumah Tangga di Desa Miskin di Kecamatan Sumbang Kabupaten Banyumas. Eko-Regional Jurnal Pemba-ngunan Ekonomi Wilayah, Vol.6 , No.1.
______, 2012. Analisis Ketahanan Pangan Pada Rumah Tangga Perkotaan di Kota Purwokerto Kabupaten Banyumas. Prosiding Seminar Nasional “Pengem -bangan Sumber Daya Pedesaan dan Kearifan Lokal Berkelanjutan”, 23-24 Nopember 2011.
Cox, Robynn dan Sally Wallace, 2013. “The Impact of
Incarceration on Food Insecurity among House-holds with Children”. Fragile Families Working Paper: 13-05-FF. http://crcw.princeton.edu/ workingpapers/WP13-05-FF.pdf, diakses pada tanggal 20 Oktober 2014.
David, Fred R, 1995, “Strategic Management”, Prentice Hall International Editions
Faharudin dan Andy Mulyana, 2012.“Food Security And
PovertyIn Rural Of South Sumatera, Indonesia”. PROCEEDING The 13th Malaysia Indonesia Conference on Economics, Management and Accounting (MIICEMA) .
Gunawati, Endang Sri, Neni Widayaningsih dan Barokatuminalloh, 2014. “Srategi Peningkatan Ketahanan Pangan Berdasarkan Aspek Makro Di Kabupaten Banyumas”.
Husein, Umar. 1999. Riset Strategi Perusahaan. PT. Gramedia Pustaka Utama, Jakarta.
Jikun Huang, Scott Rozelle, Hongxing Ni and Ninghui
Li. “Impacts Of Agricultural Trade And Related
Reforms On Domestic Food Security In China”.
http://aparc.fsi.stanford.edu/sites/default/files/FA O_Trade-China-Food-Security-July-1-2003.pdf, diakses pada tanggal 20 Oktober 2014.
Neni Widayaningsih dan Barokatuminalloh, 2012. Penyediaan Ketahanan Pangan Melalui Kesadaran Pemberian ASI di Kecamatan Purwokerto Utara Kabupaten Banyumas, Purwokerto. Jurnal Ekonomi dan Bisnis, Vol.14 No. 1, Maret 2012
---, 2012. PotensiKomoditas Pangan Sumber Karbohidrat Dalam Mendukung Ketahanan Pangan Di Kecamatan Sumbang Kabupaten Banyumas. Purwokerto. Prosiding Seminar
Nasional ”Pengembangan Sumber Daya Pedesaan
dan Kearifan Lokal Berkelanjutan II”, 27 – 28 Nop 2012.
Pieters, Hannah, Andrea Guariso and Anneleen Vandeplas, 2013. Conceptual framework for the analysis of the determinants of food and nutrition security. FOODSECURE Working paper no. 13. http://www3.lei.wur.nl/
FoodSecurePublications/13_Pieters_Guariso_Vand eplas_ConceptualFra mework.pdf, diakses pada tanggal 13 Oktober 2014.
Rukhsana and Asraful Alam, 2013. “micro level analysis of food security and agricultral development : a
case study”, International Journal of advanced
studies in humanities and social science, Volume 1, Issue 3, 2013: 164-175. http://ijashss.com/ upload/IJASHSS-2013-1017.pdf, diakses pada tanggal 13 Oktober 2014.
Singh, R.B., 2013. Towards a Food Secure India and South Asia: Making Hunger History http://www. apaari.org/wp-content/uploads/2009/08/towards-a-food-secure-india-making-hunger-history.pdf, diakses pada tanggal 13 Oktober 2014.
Tollens, Erric. 2000. Food Security and Nutrition : A
Case Study from Tanzania”. http://www. ifrc.org/