Other uses, including reproduction and distribution, or selling or
licensing copies, or posting to personal, institutional or third party
websites are prohibited.
In most cases authors are permitted to post their version of the
article (e.g. in Word or Tex form) to their personal website or
institutional repository. Authors requiring further information
regarding Elsevier’s archiving and manuscript policies are
encouraged to visit:
Discussion
Was LUSI caused by drilling? – Authors reply to discussion
Nurrochmat Sawolo, Edi Sutriono, Bambang P. Istadi
*, Agung B. Darmoyo
Energi Mega Persada, Wisma Mulia 22nd Floor, JI. Jend. Gatot Subroto 42, Jakarta 12710, Indonesia
a r t i c l e
i n f o
Article history:
Received 4 January 2010 Accepted 14 January 2010 Available online 10 February 2010
Keywords:
Mud volcano LUSI
Underground blowout Earthquake East Java Watukosek
1. General
This paper is the Authors’ reply toDavies et al. (2010)discussion of the originalSawolo et al., 2009paper. The Authors wish to thank Dr. Davies and his colleagues for the discussion and continued contribution to this interesting case study.
The original paper and the ensuing discussion address whether a connection exists between the Banjarpanji-1 well and the LUSI mud volcano, and so they focus on the condition of the Banjarpanji-1 well. In this reply, the positions of the Authors andDavies et al. (2010)
(including previous papers ofDavies et al. (2008, 2007),Rubiandini et al. (2008)andTingay et al. (2008)) on the Banjarpanji-1 drilling data and analysis are compared point-by-point, to enable the reader to understand the basis for the respective positions. This discussion is grouped into four logical sequence to make it easy for the readers to follow; which is, i) the dataset used for the analysis, ii) the method of analysis, iii) the result of the pressure analysis on the condition of the casing shoe and its possible connection to the mud flow, and iv) other evidence and information from the Banjarpanji-1 well drilling.
The main issue between the Authors and Dr. Davies and his colleagues is on the dataset and evidence in analyzing the condition of the Banjarpanji well. It is obvious that Dr. Davies papers lack the complete dataset; this is puzzling to the Authors since Lapindo Brantas have been open and offered scientists to examine and
access their drilling data. Strangely, Dr. Davies never took up on the offer, and instead, they continue to ‘‘cherry-pick’’ drilling data that supports their hypothesis and disregarded the weightier dataset that does not. In the opinion of the Authors, if Dr. Davies and his colleagues were to integrate all the available data into their anal-ysis, then their conclusions would likely be different.
By comparison, the Authors have fully integrated the entire dataset, from which it becomes apparent that the hypothesis of a connection between the Banjarpanji-1 well and the LUSI mud volcano is not supported by data.
2. Point-by-point summary of authors’ response
Issue Sawolo et al.
(2009)
Davies et al. (2010)
discussion
Remarks
Dataset – The use of Integrated vs. ‘Cherry Picked’ data
Type and breadth of information used on fracture possibility
Complete set of information used to investigate condition of the well – Pressure, Active mud volume, Pumping and flow information, Hook load, Speed of trip, Mud Engineers report, etc.
Use Pressure vs. Time data only (Fig. 1D)
Analyzing well condition based on a single piece of information is misleading and leads to a flawed conclusion.
* Corresponding author.
E-mail address:[email protected](B.P. Istadi).
Contents lists available atScienceDirect
Marine and Petroleum Geology
j o u r n a l h o m e p a g e : w w w . e l s e v i e r . c o m / l o c a t e / m a r p e t g e o
(continued)
Issue Sawolo et al.
(2009)
Davies et al. (2010)
discussion BOP was able to be opened (Fig. 1B) Drill string is
a closed system. A pres-sure creep in the drill string does not repre-sents a drop in open hole pressure (Fig. 7 ofSawolo et al., 2009) Sudden press
loss was due to bleed-off a pressure creep in
Fig. 1D– region
Dataset – leak-off test: technique, interpretation and result
Leak Off Test
Due to the high compressibility of Leak Off Test at
the 13-3/8’’
WhyDavies et al. (2010), have two interpretations from a single LOT chart?
Issue Sawolo et al.
(2009)
Davies et al. (2010)
discussion
Remarks
Dataset – BHP methods and result
Main Bottom
Method unknown Engineer’s fill up method is
Result at 69860
depth¼15.1 ppg used as a check they enhance
Analysis method – taken at the drill pipe leg
Is the drill pipe side (leg) valid for pressure analysis?
No, because the float valve creates
Yes, because the pressure restriction is eliminated.
Mud logger RTD shows pressure restriction exists.
Analysis method – taken at the annulus leg
Is the annulus caved in at the time of the the well caved in creating a pressure the well caved in (Fig. 1B).
Other issues – no drags and unlikely to swab
Was there any
(continued)
Issue Sawolo et al.
(2009)
Davies et al. (2010)
discussion
An influx into the wellbore (a kick)
Other issues – amount of influx
What was the influx volume?
w370 bbls from mud logger RTD.
w360 bbls and 390–600 bbls (Davies et al., 2008) w750 bblsDavies
et al. (2010)
Davies et al. high influx volumes w750 bbls. Need to state reasons of change and evidence
Other issues – was the well killed?
Was the well killed?
Yes. Both annulus and drill pipe pressures were bled off (Fig. 1C), the BOP was opened, and the well did not flow.
No. An underground blowout occurred on 28th and 29th May 2006. Ability to open BOP was due to a cave-in which formed a pressure seal.
The well was killed as the BOP was able to be opened and circulated for 3 h priorto the well caving in (RTD
Other issues – length of open hole section
Did the long
Yes. Casing setting depths deviated is not a measure of well integrity as proven by other operators in the area.
Other issues – well safety and integrity
Is the well safe? Yes, kick tolerance was sufficient to drill to total depth.
No, the drilling window was too
Issue Sawolo et al.
(2009)
Davies et al. (2010)
discussion 5720 ft open hole using Landmark’s CasingSeatÔ casing design software shows the well is safe
Casing design was hole section (Davies et al., 2010).
Other issues – was there a channel between the well and the mud flow?
Was there
Yes. The drilling morning report
Other issues – was the flow through the wellbore?
Bit was still stuck two months and the bit will fall to the
Does not prove well remained intact
The well did not suffer drilling mud losses even after the eruption occurred.
Other issues – no near casing fluid flow
Sonan and that there is no underground blowout
Absence of a near casing flow does not show that the well was killed. laid one day after the mud flow had
Other issues – can a newly laid green cement plug block a mud flow?
3. Dataset for analysis
In the weeks and months after LUSI first erupted, publicly available data from Banjarpanji-1 was limited, and so early analysis from external parties relied on assumptions to fill the data gaps. Since then, the full dataset has been made public by
Sutriono (2007) andSawolo et al. (2008, 2009), and is further explained and supplemented in this reply. Banjarpanji drilling data access was offered in a number of international confer-ences (Istadi et al., 2008in London and Sawolo et al., 2008in Cape Town) for any scientist and practitioners to verify its authenticity. This allows any interested party to integrate the entire dataset into its analysis instead of relying on mere assumptions.
3.1. Mud logger’s real time data (RTD)
Mud logger’s RTD comprises the set of recorded drilling parameters and other well data that is automatically measured and stored in the mud logger’s computer. The Authors consider the RTD to be the most reliable data, because it is continuous, quantitative and unbiased.
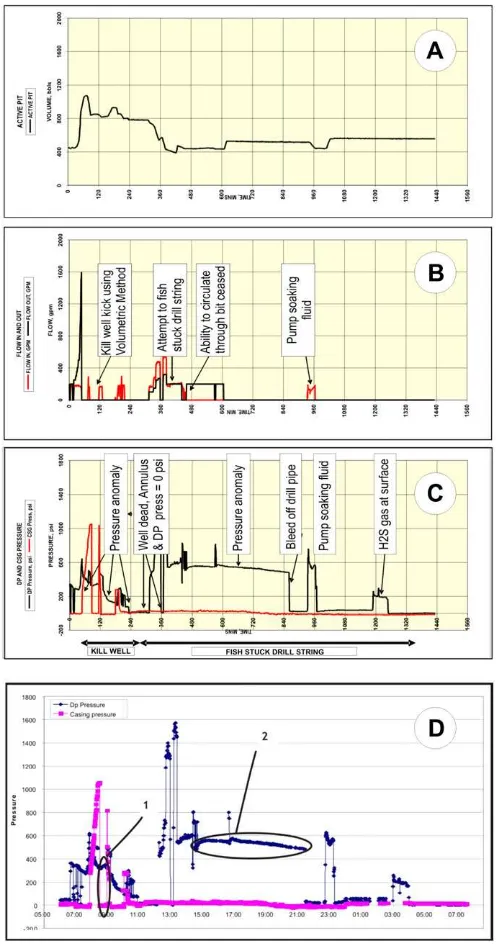
Analysis on the well’s condition to determine what took place at the bottom of the hole must be based on a full dataset or otherwise its conclusion will be misleading. For example, the drill pipe pres-sure decrease or creep (Fig. 1D– region marked 2) was interpreted byDavies et al. (2010), as‘fluids leaking from the open hole’.The sudden pressure drop to zero was interpreted to be due to fluid breach at the surface.
In the absence of any other information, Davies et al. (2010)
conclusion might be understandable. However, this conclusion is quickly revealed as nonsense when other information from the same period is integrated:
-The well was killed and it no longer has any pressure and energy to propagate any fracture. SeeFig. 7.
-There were no associated fluid losses. SeeFig. 1A.
-BOP was opened and circulation was possible (Fig. 1B), sug-gesting well has not collapsed
-The drill string is a closed system due to the non ported float valve (Fig. 7, Sawolo et al., 2009). A decrease in drill pipe pressure or pressure creep does not represent a drop in the open hole pressure.
-The sudden pressure loss was due to bleed-off at the surface. The drilling morning report shows the operation at the time was to prepare for pumping soaking fluid around the drill bit and its bottom hole assembly in order to get it free from
the differential sticking. This operation is also shown inFig. 1B
and C.
- If the claim of fractures and breaching to the surface is true, then the pumping of soaking fluid would not result in a pres-sure increase such as shown inFig. 1C. A pressure increase would not be possible in a fractured well.
- Results of the pressure tests suggest that the well was intact and not fractured (High injection test inSawolo et al. (2009)).
This other information does not support such a claim. Using a more complete set of information, Sawolo et al. (2009), can interpret the condition of the well and able to substantiate with more accuracy than an interpretation based solely on a pressure data (Fig. 1D).
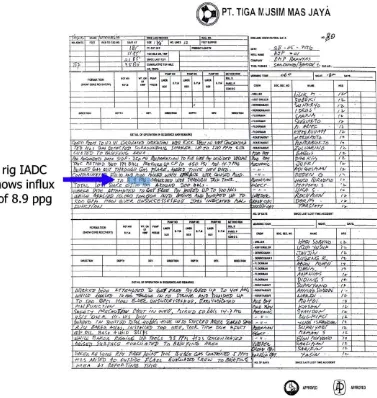
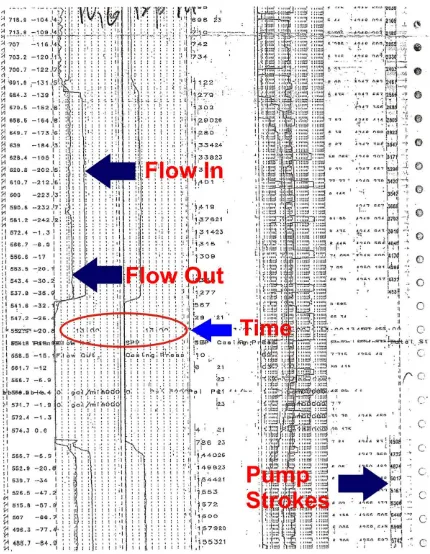
Fig. 1. A,B,C – Active tank volume, Flow in/out and Pressure vs. Time curve. These and other mud logger RTD information show the well condition at any time. Davies et al. used the Pressure information only, shown inFig. 1D. Sawolo used the complete dataset.
(continued)
Issue Sawolo et al.
(2009)
Davies et al. (2010)
discussion
Remarks
Other issues – well condition prior to pulling out of hole
What was the condition of the well prior to pulling the drill string out of the well?
Mud losses cured. Well stable for 7 h (Daily Drilling report and RTD 27th May 2006) before the drill string was pulled from well.
Well unstable, severe mud losses in progress prior to pulling the drill string out of the well.
3.2. Leak Off Test (LOT) data issues
In order to measure formation strength at the casing shoe, a LOT is done after each casing string is set and cemented (Bourgoyne et al., 1984). In Banjarpanji-1, the interpretation and value of the
LOT is different between the Authors andDavies et al. (2010), as follows:
The position of the Authors is the LOT at the 13-3/8’’ casing shoe of 16.4 ppg calculated by Lapindo Brantas is valid and consistent with wells in the region.
Fig. 2.LOT curve showing a smooth curve that is typical of LOT done on shale using oil-based mud. LOT pressure was interpreted as 16.4 ppg bySawolo et al. (2009)(red circle) and 15.4 ppg (Davies 1) 15.8 ppg (Davies 2) showed byDavies et al. (2010)(blue circles). (For interpretation of the references to colour in this figure legend, the reader is referred to the web version of this article).
Fig. 4. The interpreted values of LOT by Sawolo et al. Davies 1 and Davies 2 are plotted with typical LOT from Wunut and Tanggulangin wells. It shows that the Banjarpanji-1 LOT of 16.4 ppg (Sawolo et al., 2009) is in line with nearby offset wells at a similar depth.
The position ofDavies et al. (2010), is the LOT is lower at 15.4– 15.8 ppg, and claimed that Lapindo Brantas used a non-industry-standard LOT procedure.
3.2.1. LOT data
The 13-3/8’’ casing shoe LOT at Banjarpanji-1 well was per-formed by the Drilling Foreman from the cementing unit. By staying at the pumping unit, the foreman controls the volume of mud being pumped to the well and at the same time records the pressures to determine the LOT. Standard industry practice is to take pressures from the cementing unit pressure gauge which is the most accurate pressure gauge at the well-site.
Davies et al. (2008), reported a completely different LOT data from an unknown source. The Author suggests that Davies clarifies the source of LOT data and the accuracy of the pressure gauge. Was the test result taken by the responsible person? Did he have control of both mud volumes being pumped and direct access to the resulting pressure readings?
3.2.2. LOT technique
There is no universally accepted LOT procedure and inter-pretation, so LOT methods vary between companies (Lapeyrouse, 2002). In general, the LOT is done by closing the BOP at surface and then pumping mud at a constant rate until the desired test pressure is reached or until the well starts to take whole mud. The pressure at which the formation begins to ‘leak’ is called the ‘Leak Off ‘ pressure. In a plot of mud-pump pressure vs. time, this is where the curve starts to deviate from the straight line. This is how most oil and gas companies interpret the LOT graph when using non-compressible drilling fluids such as water-based mud. However, when using compressible drilling fluids such as the oil-based mud in Banjarpanji-1, the LOT interpretation technique needs to account for fluid compressibility. The compressibility of oil-based mud is almost twice the compressibility of water-based mud (Bourgoyne et al., 1984).
Lapindo Brantas followed the Unocal Operating Guideline (1998)for oil-based mud, in which the ‘fracture closing pressure’ is interpreted to be the formation strength. By using the fracture closing pressure, defined as the pressure at 10 s after the pump is switched off, the effect of fluid compressibility is minimized. This technique is detailed inSawolo et al. (2009). Similar techniques for oil-based mud LOT interpretation method are used by other oil and gas companies in the area, including both partners in the Banjarpanji-1 drilling; Santos, a major independent Australian oil and gas company, and Medco, a major Indonesian oil and gas company. As confirmed by their drilling engineers, Santos use the fracture closing pressure similar as per Lapindo Brantas, and Medco use the maximum injection pressure as their leak off pressure.
Davies et al. (2010), claim that Lapindo Brantas LOT technique is ‘contrary to all industry practices’ is false. Numerous oil and gas companies use similar technique including Santos and Medco, all participants in the Banjarpanji drilling project.
3.2.3. LOT interpretation results
The Authors’; interpreted LOT at the 13-3/8’’ casing shoe at 3, 580 ft. as 16.4 ppg; this is plotted onFig. 2in the red circle. This interpretation is based on the fracture closing pressure to account for the high compressibility of oil-based mud (Sawolo et al., 2009).
Davies et al. (2010), interpreted the LOT at the inflection point of the curve with a LOT value of 15.8 ppg (Davies 2). Another value was suggested in his summary as 15.4 ppg (Davies 1). It is unknown why Davies suggested two LOT values from a single LOT curve, but these two interpretations are shown inFig. 2in blue circles.
3.2.4. LOT results bench-marking
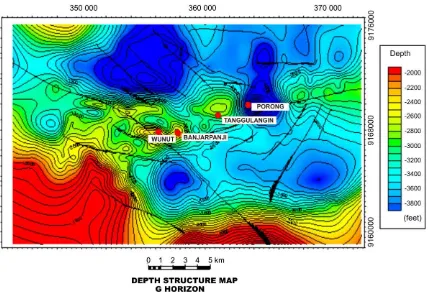
LOT results should resemble those in analogous nearby wells. In the case of Banjarpanji-1, the nearby wells are in Wunut and Tang-gulangin fields, some 2 km and 3 km away respectively. The Wunut field is especially analogous, because at the casing shoe depth of 3580 ft., Banjarpanji-1 is in the same structural closure as the Wunut field as shown inFig. 3. Comparison with the Porong-1 LOT is less significant since it is some 7 km away in a different structural setting. The different values of Banjarpanji-1 LOT interpretations are plotted with Wunut and Tanggulangin LOT inFig. 4.
The Author’s Banjarpanji-1 LOT of 16.4 ppg at 3580 ft. is consistent with offset wells in the Wunut and Tanggulangin fields. In contrast, Davies 1 and 2 interpretations are not supported by the offset well data. Similarly, Davies’ claim that Sawolo’s LOT of 16.4 ppg is‘unrealistically high leak off pressure’, ‘overestimating the pressure the well could tolerate’and ‘an erroneous value to use, is contrary to all industry practices and is an extensive overestimation of formation strength’ (Davies et al., 2010) is false. This baseless rhet-oric has no place in science. If Dr. Davies had done his field work, evaluated tests of the nearby wells and performed a proper research, then his appreciation will likely be different.
Consequently, the value of LOT to be used in the Pressure Analysis section is 16.4 ppg at 3580 ft. The much lower LOT value of 15.4 ppg and 15.8 ppg (Davies 1 and 2) are used in the sensitivity analysis as its worst-case scenario.
It should be noted that all offset wells in Wunut and Tanggu-langin fields were drilled using water-based mud. Using the non-compressible water-based mud, there is no issue of interpreting the data, and these LOT pressure were picked at the inflection point similar asDavies et al. (2008). One key well, Wunut 2, was drilled by a different operator, Huffco Brantas Inc, and their LOT was found to be in line with the rest of Wunut and Tanggulangin wells.
3.3. Bottom Hole Pressure (BHP)
Apart from the strength of the formation (LOT), Bottom Hole Pressure (BHP) is another important piece of information to calculate the pressure at the casing shoe.
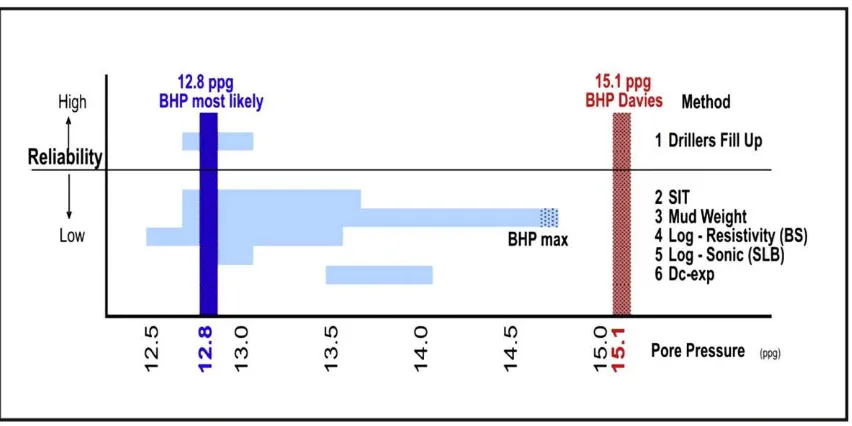
The Authors used the ‘fill up method’ to estimate BHP at Banjarpanji-1 at 12.8 ppg. This method is used by field engineers after a loss circulation has occurred; it is field-proven and a reliable method. Other pore pressure estimation methods based on mud weight and indirect methods are less reliable and have their own limitations. Although individually these methods may be less reli-able, when used as a group they can be used to check the result from the primary method to arrive at the most credible BHP. The results of these various pore pressure-estimating methods are plotted inFig. 5. The Authors’ estimated BHP of 12.8 ppg is supported by the other pore pressure estimation methods except for the Dc-exponent method, and so is used for subsequent pressure anal-ysis. A maximum BHP of 14.7 ppg (Fig. 5) is used for sensitivity purposes. This range of BHP estimate is supported by all pressure estimation methods that are based on actual well data and not ‘misleading and essentially contrived’ as claimed by Davies et al. (2010). This claim must be substantiated.
mud weight used while drilling. A 15.1 ppg BHP is physically impossible.
3.4. Other data for pressure analysis
Other data required to perform the pressure analysis are:
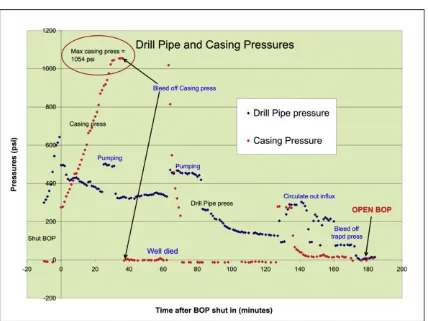
1. Maximum casing pressure¼1054 psi (Fig. 7)
This is the highest recorded casing pressure after the BOP was closed, at which time the casing shoe experienced the highest hydrostatic pressure. At this time, the well has not caved in and forms a pressure seal (Fig. 1B), so the pressure data was valid.
2. Fluid density at the top of the well¼8.9 ppg (Daily Drilling Report date 29th May 2006).
This fluid density was measured while circulating out the influx and shown inFig. 6.
3. Mud weight used during the well kill¼14.7 ppg. (Daily Drilling Report date 29th May 2006).
4. Method of analysis
Sawolo et al., 2009, estimated the pressure at the casing shoe by analyzing the annulus fluid column, whereasDavies et al. (2008),
analyzed the drill pipe fluid column. The differences and their limitations are discussed below:
4.1. Pressure analysis of the well
Wellbore pressure is estimated at the casing shoe, typically the weakest point of the wellbore, and compared with the LOT. If the pressure at the casing shoe is below its LOT, then the casing shoe is likely intact, and vice versa.
The wellbore pressure at the casing shoe can be estimated from either the drill pipe or the annulus, typically referred to as the ‘legs’ or ‘legs of the U-tube’. Both approaches will give the same answer provided the input data and assumptions are reliable. We will illustrate the different approaches and reasoning ofDavies et al. (2008), andSawolo et al. (2009), in performing their analyses.
4.2. Pressure analysis on the drill pipe leg (Davies et al., 2008)
wellbore pressure cannot be reliably estimated from drill pipe pressure. A schematic of the mud circulating system that shows the float valve is shown in Fig. 7 ofSawolo et al. (2009).
Davies et al. (2010) state two actions that purportedly elimi-nated the pressure discontinuity between the drill pipe and the open hole section.
Mud was pumped (slowly) through the drill pipe during the initial casing build up which opened the float valve and removed the pressure discontinuity, thereby allowing reliable annulus pressure estimation from drill pipe pressure.
This slow pumping was not done. Pressure restriction can be eliminated by slow pumping (equivalent of 2–5 strokes per minute by idling the mud or cement pump) that just barely opens the float valve without causing an excessive pressure on the drill pipe. The mud logger RTD showed pumping was done at 42 strokes per minute (Fig. 1B and mud logger RTD) to fill the well as part of the ‘Volumetric’ well control method. At this high pump rate, frictional pressure losses in the drill string are significant, and so pressure estimation at the bottom of the drill string is unreliable (Field Evidence, RTD in Sawolo et al., 2009).
The (float) valve has a small hole allowing pressure
communication.
This is false. Lapindo-Brantas drilling standard is to use a non ported (no hole drilled) float valve, as shown in the Banjarpanji-1 Drilling Program. This is further confirmed by the drill pipe pressure (around 500 psi) being higher than the annulus pressure (around 280 psi) when the BOP was shut in (Field Evidence, RTD in Sawolo et al. (2009)). If a small hole was drilled in the float
valve, the drill pipe pressure reading would be lower than the annulus as the drill pipe is full of heavier drilling mud whereas the annulus is filled with a mixture of drilling mud and lighter influx fluid.
The pressure restriction in the drill pipe was not eliminated. Therefore, pressure reading in the drill pipe is invalid and should not be used in any pressure analysis.
4.3. Pressure analysis on the annulus leg (Sawolo et al., 2009)
Davies et al. (2010), claimed the well caved in and packed off the drill string, thereby isolating the wellhead annulus from the open hole annulus, and making downhole pressure estimation from surface annulus pressure unreliable. The evidence cited was the lack of fluid flow up the annulus and the inability to circulate mud.
A close look at the mud logger RTD reveals that the well had not caved in at the time pressure measurements were made.
Fig. 1B shows that circulation remains unrestricted until around 14:30 h on 28th May 2006. This is the time when the well finally caved in. However, annulus pressure measurement was taken six hours prior to when circulation was lost, and so was valid.
The pressure data is shown inFig. 7.
The kill process was successful and the well was finally killed, both drill pipe and annulus pressure were bled off and the BOP was opened within three hours. The highest pressure recorded at the annulus was 1054 psi for use in the Pressure Analysis.
5. Pressure analysis result
The inputs for the pressure analysis of the casing shoe are as follows:
For the worst-case sensitivity analysis, the worst-case inputs were used:
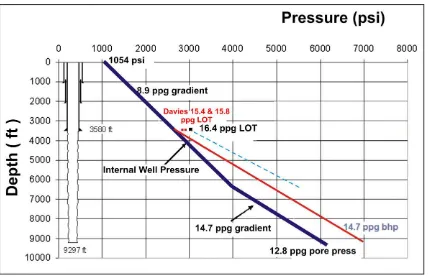
The analysis based on this data and the mechanics of con-structing the pressure analysis curve are described inSawolo et al. (2009), and summarized inFig. 8.
This curve shows that the pressure at the casing shoe was less than its fracture strength (LOT), which confirms that the well remained intact. Note that inFig. 8, even at the worst-case condition (15.4 ppg LOT and 14.7 ppg BHP), the wellbore pressure at the casing shoe is below the LOT, and the casing shoe remained intact. Davies et al. (2010), claim that the Authors have taken ‘an unrealistically high leak off pressure and unrealistically low pressure’in its pressure analysis is again proven wrong, as the sensitivity test is performed using the lowest leak off pressure (Davies 1 LOT inFigs. 2 and 4) and the highest possible bottom-hole pressure (as shown inFig. 5).
With the well remained intact, there is no connection between the well and the mud volcano. The underground blowout
hypothesis suggested byDavies et al. (2007, 2008, 2010)is, there-fore, not supported by pressure analysis.
6. Others issues
This section discusses other related field data and observations on the drilling of the Banjarpanji-1 well.
6.1. Mud losses that coincided with earthquake
Sutriono (2007)and Sawolo et al. (2008, 2009), revealed the Banjarpanji-1 drilling dataset to interested parties, and demon-strated that this dataset does not support a connection between the well and the mud volcano. The papers note two mud losses coin-cided with the main Yogyakarta earthquake and the aftershocks. This information is provided for sharing purposes and to provide a platform for other researches.
As stated in the introduction of theSawolo et al. (2009)paper, proving or disproving other hypothesis for the mud flow is beyond the scope of the paper. These include: mud volcano derived from over-pressured diapiric shale through fracture zone as conduit (Sunardi, 2007), fault reactivation (Mazzini et al., 2007, 2009), very long tectonic propagating fracture network aligned with the Watukosek fault zone (Istadi et al., 2008), earthquake (Davies et al., 2008, 2010; Manga, 2007; Mori and Kano, 2009) or geothermal activity (Sudarman and Hendrasto, 2007).
6.2. No drag and unlikely to swab
Davies et al. (2010)suggest that the statement ofSawolo et al. (2009)of ‘no apparent drag.unlikely to swab’contradicts the daily
drilling report which stated‘overpull encountered over 30,000 lbs’. The daily drilling report of 28th May 2006 does indeed report 30,000 lbs of overpull, but this statement is not supported by the Fig. 8.Pressure analysis showing a pressure profile in the well (internal well pressure) at different depths, shown in ‘Dark Blue’. The formation strength is shown in ‘Light Blue’ dotted line. The pressure in the well (‘Dark Blue’ line) stays below the formation strength (‘Light Blue’ dotted line) confirms that the well is intact. (For interpretation of the references to colour in this figure legend, the reader is referred to the web version of this article).
1. Bottom Hole Pressure ¼12.8 ppg at 9297 ft.
2. Leak Off Test ¼16.4 ppg at 3580 ft.
3. Maximum surface casing pressure ¼1054 psi
4. Mud weight ¼14.7 ppg
5. Surface fluid density ¼8.9 ppg
1. Bottom Hole Pressure ¼14.7 ppg, being the maximumpossible BHP (Fig. 5). 2. The Leak Off Test ¼15.4 ppg being the lowest LOT (Figs. 2 and 4)
mud logger RTD, which shows a relatively light overpull of around 10,000 lbs and no tell-tale signs of drag. In a really bad overpull condition, the ‘hook-load’ record will show an erratic with an increasing trend, whereas in a rough hole condition, it will simply show a bumpy erratic motion. The RTD record does not show any of
this tell-tale sign and therefore the Authors believe that it is a smooth holeand no drag.
The RTD also shows the pulling speed was a slowfive minutes per stand (Sawolo et al., 2009)with mud replacement. This data all suggests that swabbing wasunlikely.
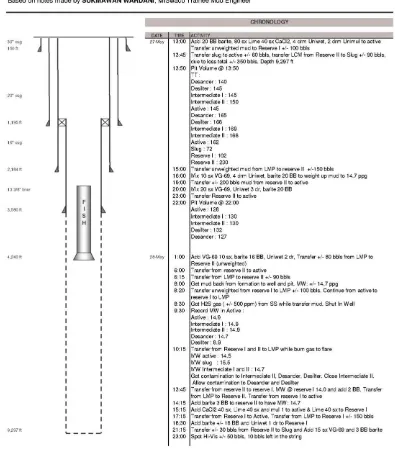
Fig. 9.Mud engineer report showing mud transfer into the active mud tanks at 06:00 h. This and other parallel operations done on the rig at the time make the influx volume estimation uncertain.
Table 1
RTD shows the volume of mud in the active mud tank remained almost constant over a four hour period, and after fresh mud was added, it remained constant for another two hours. This shows that the well was stable after the earlier major loss had been cured.
Time (27/5/2006) Activity Active mud tank (bbls) Remarks
w14:30 Spotting LCM completed 232 LCM added to cure the mud losses
14:30–15:00 POOH 4 stands 205
15:00 Started circulation through trip tank 212 Mud engineer mixing new mud
19:00 Ready to receive new mud 210 Mud volume almost constant in last 4 h.Well in stable condition
19:30 End of receiving mud 417
This is an instance where one has to decide what is the ‘‘harder data’’ – the daily drilling report or the mud logger RTD. The Authors’ position is the underlying mud logger RTD carries more weight because it is automated, continuous and quantitative.
6.3. Amount of influx
The estimated influx volume inDavies et al. (2008), isw360 bbls
in the table, 390 600 bbls in the paper. However, a significant increase to w750 bbls is reported by Davies et al. (2010). This
inconsistency in Davies’s claims, suggest a lack of understanding of the downhole conditions, the actual operations and the use of many assumptions in the claims.
The earlierDavies et al. (2008), influx volume is close to the Author’s estimate of w370 bbls. The Authors include a caveat to
determine the exact influx volume, which is due to the number of simultaneous operations occurring at the same time:
-Mud loss due to the top drive wash pipe leaking (RTD data
w06:30 h)
-Circulating of mud downhole (RTD dataw07:00 h).
-Pumping of mud into the active tank (starting at 06:00 h – M-I report shown inFig. 9).
The volume increase in the active tank of 250 bbls (shown in
Table 2) after the BOP was shut in means that other operations were occurring, such as mud transfer from the reserve tanks. With the BOP closed, the volume increase could not have come from the well. To estimate the influx volume, the Author based its calculation from the mud logger RTD. The mud volume in the active tank at the time was shown as follows:
The influx volume of 370 bbls was derived from the difference between:
This is a significantly lower than Davies’ estimate.
The Authors question the reasons for the inconsistency and the high influx volume reported byDavies et al. (2010).
6.4. Was the well killed?
Pressures in the drill pipe and annulus during the ‘volumetric’ kill process are shown inFig. 7. At the end of the kill, the annulus and drill pipe pressures were bled off and the BOP was opened to confirm that the well was dead.
Davies et al. (2010), claimed that the well was not killed and that cave-in of the hole explains why the blowout preventers could be
opened without any surface flow taking place. This claim is inconsistent with the mud logger RTD Figs.1B and10which shows that circulation was possible for three hours after the BOP was opened. The ability to circulate mud means that there was no pressure barrier in the annulus between the bit in the open hole and the surface. Therefore as no pressure was seen at the surface, the well must have been dead.
6.5. Propagation of fractures
Davies et al. (2010), propose that fracture propagation started by a fracture at the casing shoe and continued until the fracture breached the surface.
Davies et al. (2010), propose that the drill pipe pressure creep (marked 2 inFig. 1D) is evidence that fluids were leaking from the open hole and a fracture was propagating from the casing shoe to the surface. Further, the time when the fracture reached the surface is shown by the sudden pressure drop.
This claim is not supported by the full mud logger RTD infor-mation and other drilling evidence. This is explained as the example in the ‘Mud loggers Real Time Data’ section at the begin-ning of this paper.
6.6. Length of open hole section
Davies et al. (2010)suggest that deepening the well to 9297 ft resulted in a long open-hole section that jeopardized well integrity. Open-hole length by itself is not a safety issue. One partner in the Banjarpanji-1 well drilled two wells in their Jeruk field in Offshore East Java (seeTable 3) to a similar carbonate objective. Both wells had longer open-hole sections than Banjarpanji-1, yet they were both drilled without any special safety concerns. SoDavies et al. (2010), claim that the length of the open hole in Banjarpanji-1 created a safety issue is not supported by local experience.
6.7. Well safety and integrity
Well integrity depends mostly on bottom-hole pore pressure, fracture gradient and the mud weight used.
An accurate estimate of the bottom-hole pore pressure is needed in the determination of well safety. As shown in the ‘Bottom Hole Pressure (BHP)’ section, the most likely pore pressure is 12.8 ppg with an upper limit of 14.7 ppg as the well was being drilled with 14.7 ppg mud when it suffered a loss of circulation.
Tingay et al. (2008), based his safety window work on pore pressures from other authors:Davies et al. (2007)with 15.1 ppg and
Mazzini et al. (2007)with 14.6 ppg.
- Davies et al. (2007)pore pressure of 15.1 ppg is higher than the mud weight and is not supported by other pore pressure esti-mation methods (see Bottom hole pressure estiesti-mation,Fig. 5). Davies pore pressure is likely to be erroneous.
- Mazzini et al. (2007)suggested two possible bottom-hole pore pressures,
14.6 ppg based on Dc-exponent,
12.8 ppg based on ‘Fill up’ volume after the loss of circulation.
Tingay used the higher Dc-exponent-based estimate, although this technique is only applicable in shale or shaly formations (Bourgoyne et al., 1984), while the section being drilled was laharic volcanoclastic rock. It is unclear why the other pressure estimation suggested by Mazzini was not used.
The other input to the integrity test is the value of the Leak Off Test. As shown in the Dataset for Analysis section, the likely LOT Table 2
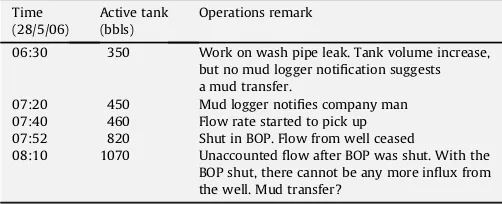
Active tank volume during the well kick. These recorded volumes are used to esti-mate the influx volume.
Time (28/5/06)
Active tank (bbls)
Operations remark
06:30 350 Work on wash pipe leak. Tank volume increase, but no mud logger notification suggests a mud transfer.
07:20 450 Mud logger notifies company man
07:40 460 Flow rate started to pick up 07:52 820 Shut in BOP. Flow from well ceased
08:10 1070 Unaccounted flow after BOP was shut. With the BOP shut, there cannot be any more influx from the well. Mud transfer?
Volume when the BOP was shut in ¼820 bbls (RTD 07:50 h) Volume at mud logger notification ¼450 bbls (RTD 07:30 h)
figure is 16.4 ppg, whereas Davies et al., LOT estimate of 15.4 and 15.8 ppg are much too low.
Based on these inputs,Tingay et al. (2008), concluded that the well was unsafe (Fig. 11B).
The analysis bySawolo et al. (2009)shown onFig. 11Ais based on a bottom-hole pore pressure estimate that has been cross checked with other pressure estimation methods. Similarly, the value of the LOT was cross checked with offset wells in the region. The analysis was made usingHalliburton Landmark’sCasingSeatÔ casing design software to check the safety of the well using actual
drilling data from the Banjarpanji-1 well. The result of the analysis shows that the well was safe (within its ‘kick tolerance’) to drill down to its final depth of 9297 ft.
The Authors maintain their position that using the most reason-able estimate BHP value of 12.8 ppg, mud weight of 14.7 ppg and a LOT of 16.4 ppg, the well had a sufficient safety factor and integrity to drill to the total depth of 9297 ft. The Authors do not support the analysis of
Tingay et al. (2008)because it is based on a faulty bottom-hole pore pressure estimate from a technique not suited to the situation, and which was not checked against other estimation methods.
6.8. Direct evidence for well failure?
Davies et al. (2010), cite evidence of a conduit between the well and the surface mud flow in the form of a Daily Drilling Report 30th May 2006, which stated that pumping mud downhole was coin-cident with decreased mud eruption intensity and longer quiet periods between eruptions.
The daily drilling report must be cross checked with other data. On the day of the mud eruption, the driller’s first reaction was to find out if there was a connection between the well and the eruption, because if such a connection existed, then is should be possible to kill the mud eruption from the wellbore. So the driller pumped mud downhole and recorded the mud eruption behavior and pump pressure. He reported that pumping mud had a notable effect on the geyser-like eruption. However, after further tests, it became clear that pumping mud did not have a repeatable effect on the eruption. The continued erratic and intermittent nature of the eruption suggested that the relationship between pumping and eruption behavior was coincidental. Whereas the high pump pressures (Field Evidence inSawolo et al., 2009) confirmed that there were no fractures and so pumping of mud was discontinued. In summary, if there was a conduit between the well and the surface eruption, then the pump pressure would be low or even a vacuum due to the Venturi-effect from large volumes of fluid flowing out of the wellbore. But in fact the pump pressure was even
higher than the Leak Off Test, which is consistent with pumping into a sealing well. This confirms that the well is intact.
6.9. Was the flow through the wellbore?
The question that is most asked is ‘Did the mud flow up the wellbore, fracture the formation at the casing shoe, exit the well-bore and flow to surface?’ as illustrated inFig. 12B(Table 4).
The section ‘Was the well killed?’ demonstrates that the well was killed and the BOP was open for about 18 h before the mud eruption was reported. If the mud flowed up the wellbore, the path of least resistance would be up the wellbore and through the wellhead as shown inFig. 12A. But there was no flow through the wellhead.
Rubiandini et al. (2008)andDavies et al. (2008), suggests that the casing shoe at 3580 ft. was breached by internal pressure from the well, the mud flowed up the wellbore to the casing shoe, where it exited and found its way to surface. The scenario is shown inFig. 12B
point ‘‘d’’. In subsequent paper,Davies et al. (2010), move the fracture point deeper to around 5000 ft. as shown inFigs. 12C and 13A,B.
This inconsistency in Davies’s claim, again, suggests a lack of understanding in actual operations and the use of many assump-tions in the claims.
The mud-flow rate was estimated at approximately 50,000 m3 initially, increasing to over 100,000 m3per day at the time of the re-entry operations. If the abrasive mud did flow up the wellbore at extremely high rate, it would be expected to erode the wellbore (Fig. 12B).Nawangsidi (2007), estimate that the resulting bore hole size would be theoretically 200 times the original wellbore size, which is a giant cave, where the drill string would fall to the bottom. Yet, two months after the first eruption, during re-entry work, the bit was still found in its original position. This suggests that the flow may never flow up the well in the first place.
6.10. No indications of near bore mud flow
Sonan and Temperature logs were run during the re-entry work to look for tell-tale noise and temperature anomalies that Fig. 11.Well integrity. The diagram ofSawolo et al. (2009), inFig. 11Ais based on actual mud weights and bottom-hole pore pressure from multiple methods and shows the well remains intact. The diagram ofTingay et al. (2008)inFig. 11Bis based on a 14.6 ppg bottom-hole pore pressure from the Dc-exponent.
Table 3
Comparison of uncased open-hole section of various wells in the area. The Jeruk field wells had longer open-hole sections than Banjarpanji-1 well, and this did not create safety concerns.
Well Name Operator Location Open hole
without casing
Jeruk-1 Santos Madura Strait, targeting the same formation as Banjarpanji-1 well
5951 ft
Jeruk-2 Santos As above 6782 ft
Banjarpanji-1 Lapindo Brantas
Onshore East Java, the same stratigraphic sections as Jeruk wells
can indicate flow of fluid behind the casing. Such near-casing flow is typical in deeper wells because fracturing the cement sheath is easier than fracturing the rock formation. In this case, the logs had ‘quiet’ log responses and there was ‘no anomaly’ in the temperature log, and so there was no evidence of near casing fluid flow.
The absence of this near casing fluid flow is explained byDavies et al. (2010), due to a cement plug that blocked the fluid flow (Fig. 13B). The suggestion is not realistic since the plug was laid one
dayafterthe mud flow was observed. Newly laid green cement plug cannot divert such a massive mud flow.
6.11. Mud flow diverted because of green cement plug?
Davies et al. (2010), take the position that the mud flow origi-nally created fractures at the shoe at 3580 ft. (Fig. 13A). Later, when a cement plug was placed, this plug acted to ‘prevent fluids from coming up the well above the plug’, and so the mud flow created new Fig. 12.Differences of opinion had the mud path is through the wellbore. The Authors position had the mud flow pass through the wellbore will result inFig. 12Aand B. Whereas
Davies et al. (2010), suggest that it fractured deeper due to a cement plugFig. 12C.
fractures below the cement plug at around 5000 ft. (as shown in
Fig. 13B).
There are a number of inconsistencies with this claim:
1. The injection test performed one day after the first mud erup-tion and prior to the pumping of cement showed a high injecerup-tion pressure (Sawolo et al., 2009). This is not consistent with a connection between the wellbore and the mud flow as shown inFig. 13A(and based onDavies et al., 2008), as such a connec-tion would result in a low pump pressure or even a vacuum. 2. The cement slurry was placed a day after the mud eruption was
reported. The slurry was normal oilfield 15.8 ppg cement slurry mixed by Halliburton with a pumping time (setting time) of four hours. During these four hours, the cement had almost no cohesive strength or compressive strength; a very basic under-standing of oil field’s cementing property (Dowell Schlumberger, 1984). Therefore, if the mud were flowing up the wellbore, it would have immediately swept away the green cement slurry. 3. The pressure test after the cement had set indicated a good
cement plug. Again, this is not consistent with setting a cement plug with mud flowing up the well. If mud were flowing up the wellbore, one would end up with no cement plug at all and no resistance to pumping.
The Authors disagree withDavies et al. (2010), that there was any fracture at the shoe or that the fractures moved deeper due to the cement plug that was laid one day after the mud flow had started. This is a physically impossible proposition.
6.12. Well condition before pulling out of hole
After the well was drilled to a depth of 9297 ft., it suffered a major mud loss of 130 bbls loss in 10 min. Loss-circulation material (LCM) was pumped into the wellbore and successfully plugged the losses and stabilized the well. The well was then monitored for around seven hours, during which time the well remained in a stable condition. The drill string was then started to be pulled out of hole. This is in contrast toDavies et al. (2010)claim that the decision to pull out of hole was made without verifying that a stable mud column was in place and it was done while very severe circulating mud losses were in progress.
This claim is not supported by the mud logger RTD, which shows the volume of the active mud tank was stable. Mud losses (if any) were very minor at 2 bbls in 4 h, representing 0.12% of total active mud volume. After fresh mud was added to the tank, the volume remained stable for another two hours (Table 1).
Authors’ note: It is not practical to scan and attach the long hard-copy mud logger’s RTD record to this paper. However, the Authors will make this RTD available to interested parties to verify the authenticity of this information.
The stable well condition was further supported by the dril-ling foreman, who wrote In the Daily Drildril-ling Report of 28th May 2006:
‘Spotted total 60 bbls loss circulating material, pull out of hole 4 stands of drill pipe to 8737 ft., monitor well through trip tank.
Well static.’
Fig. 14.The mud flow path proposed bySawolo et al. (2009)(Fig. 14A) has no connection with the well, unlike that proposed byDavies et al. (2008, 2010)(Fig. 14B). Table 4
What would have happen if the mud flow passed through the well?
Consequence if path flow originates from well Davies Claims of mud path flow
The Authors postulated consequences if the mud flowed up the wellbore. a) Mud should have flowed through the wellhead when the BOP was in the open position. b) Later when the well caved in, it would have been much easier for the mud flow to force its way through the cave-in and up the wellbore to surface, rather than fracture 5000 ft of new formation; c) hole would likely erode from the high mud velocity, and the cement plug and >90000 lb fish should fall to the bottom of the well; d) casing shoe would likely be the exit point as it is the shallowest uncased formation which has the least formation strength.
None of the above were detected, suggesting that the mud flow path was not through the wellbore.
This statement shows that the foreman was certain that the well was in a static condition and the mud losses cured. At this condi-tion, there is no reason why the operation of pulling out of hole cannot be started.
These evidence show thatDavies et al. (2010), claim that the decision to pull out of hole was made‘without verifying that a stable mud column was in place and it was done while very severe circulating mud losses were in progress’is again false. Davies et al. need to provide the evidence and data to support their claims.
7. Differences in opinion summary
In summary, the different opinions between Davies and his colleagues and the Authors are shown inFig. 14.
Fig. 14Ais the position taken by the Authors as described in the
Sawolo et al. (2008, 2009)and further expounded in this discussion reply. It shows that the casing shoe was intact and the mud flow is independent from the Banjarpanji-1 well drilling. This conclusion is based on the analysis of fully integrated dataset and evidence from the well.
Fig. 14Bis the position taken by Dr. Davies and his colleagues as described in the Davies et al. (2007, 2008, 2010), where it was claimed that the drilling operation triggered the mud flow. This claim is based on ‘‘cherry-picked’’ drilling data that supports their hypothesis and disregarded weightier dataset that does not, as shown in this discussion paper. The Authors believe that if Dr. Davies and his colleagues were to integrate all the available data into their analysis, then their conclusions would likely be different.
8. Conclusion
Early technical papers, such as Davies et al. (2008, 2007), Rubiandini et al. (2008) and Tingay et al. (2008) suggested a connection between the Banjarpanji-1 well and the mud volcano. These papers were based much on assumptions, unverified and partial dataset. It remains a mystery why these authors never asked or accepted our invitations to examine and access the drilling data that are open to them and any other scientists. It is unethical to use assumptions and unverified data from unknown sources for scientific publications especially considering the sensitivity of the subject and the social and economic consequences of its resulting statements and claims. When the full dataset is integrated as in
Sawolo et al. (2008, 2009), it is evident that the data points to an intact casing shoe, and therefore no connection between the well and the mud volcano.
This discussion aims to fill data gaps in the earlier papers, specifically to detail:
1. The need to integrate the entire mud logger Real Time Data (RTD) into the analysis. RTD is the best data source because it is automated, continuous and quantitative, and it captures pres-sures, mud volumes and key operating parameters of the rig. Davies’ papers used only a portion of this dataset and their conclusions are not supported by the full dataset.
2. How to determine which data to give more weight to, in instances of conflicting data. The authors of the early papers did not have access to the full dataset, and so they could not make a fully informed and rational decision on which data to use. 3. The importance of considering observational evidence outside
of the RTD. This supporting evidence by itself may not be conclusive, but it helps to limit the range of uncertainty. 4. The need to update assumptions when new data becomes
available. The Authors have presented additional new data which is mostly based on unbiased mud loggers RTD inSawolo et al. (2008, 2009)and supplemented in this reply paper. The
Authors find it odd for a rational scientist to continue to stick to assumptions and cherry-picked data when a full dataset is available. Numerous data sets used by Davies et al. are puzzling and inconsistent. For example Davies stated that ‘We know that.in the Banjar Panji-1, the pore pressures at 2130 m.are 38 MPa (5500 psi)’. First, what is the source and reference to this ‘We know that’? As no source is referenced in the technical paper. Second, this value is likely to be erroneous since it is strikingly higher than any of the six estimated pressures or other publicly available values. Other examples are the incon-sistencies in data usage. It is difficult to understand the reason for the continually changing influx volume as it is reported without any justifications or documentations. This lack of consistency in Davies’s claims, suggests a lack of understanding of the down hole conditions and the actual operations and hence the use of the many assumptions that leads to ques-tionable conclusions. As the use of the complete dataset is of utmost importance, we continue our offer to any interested parties, scientists and drilling practitioners to scrutinize and verify the authenticity of the data.
The Authors’ recent work strongly reinforces their position that the well remained intact, and there was no connection between the well and the mud volcano. The Authors disagree with Davies et al, that the casing shoe was fractured or that the fractures moved deeper due to the cement plug that was laid one day after the mud flow had started. Dr Davies et al, must know that newly laid green cement plugs cannot divert flow as they are non cohesive with low compressive strength. It is not understood why such a bizarre and physically impossible proposition is even considered.
The Authors recommend continuing the study of LUSI to help improve our understanding on the origin of mud volcanoes in the area. We must ensure, however, that any future work is done professionally and responsibly based on the result of one’s actual field work, analyzing the complete dataset and the proper appli-cation of sound engineering practice.
8.1. Side note on the social side of LUSI
The Authors echo the sympathies of Dr Davies and his colleagues to the many families whose lives have been disrupted by LUSI mud volcano. It is a very unfortunate incident and there are no winners. The Authors are pleased to report that Lapindo Brantas Inc. has provided massive assistance to the villagers affected in terms of evacuation, emergency sheltering, financial assistance and permanent replacement accommodation. This assistance was provided for ethical reasons, independent of the legal process which eventually cleared all charges against Lapindo Brantas Inc. The magnitude of assistance provided by Lapindo Brantas Inc. is to our knowledge unprecedented in Indonesia.
Acknowledgement
The Authors wishes to express appreciation to the management of MIGAS, BPMIGAS, EMP, Lapindo Brantas Inc. and our colleagues in TCC for their support and permission to publish the paper. Numerous constructive discussions and inputs from drilling engi-neers and geoscientists are also appreciated.
References
Bourgoyne Jr., A.T., Chenevert, M.E., Millheim, K.K., Young Jr., F.S., 1984. Applied Drilling Engineering. In: SPE Textbook Series, vol. 2.
Davies, R.J., Manga, M., Tingay, M., Lusiaga, S., Swarbrick, R., 2010. Discussion, Sawolo et al., 2009: ‘The LUSI mud volcano controversy: was it caused by drilling?’. Marine and Petroleum Geology 27 (7), 1651–1657.
Davies, R., Swarbrick, R., Evans, R., Huuse, M., 2007. Birth of a mud volcano: east Java, 29 may 2006. GSA Today 17, 4–9.
Dowell Schlumberger, (1984). Cementing technology. Dowell Schlumberger 1984. Halliburton Landmark software.http://www.halliburton.com/ps/default.aspx?page
id¼819&prodid¼MSE%3a%3a1055449576442969 CasingSeatÔ Casing Design Software.
Istadi, B.P., Kadar, A., Sawolo, N., 2008. Analysis & recent study results on east Java mud volcano. In: Proceedings of the Subsurface Sediment Remobilization and Fluid Flow in Sedimentary Basin Conference, October 2008. The Geological Society, Burlington House, Piccadilly, London.
Lapeyrouse, N.J., 2002. Formulas and Calculations for Drilling, Production and Workover. Elsevier Science, USA. http://www.drillingformulas.com/tag/leak-off-test/.
Manga, M., 2007. Did an earthquake trigger the may 2006 eruption of the LUSI mud volcano? EOS 88 (18), 201.
Mazzini, A., Nermoen, A., Krotkiewski, M., Podladchikov, Y., Planke, S., Svensen, H., 2009. Strike-slip faulting as a trigger mechanism for overpressure release through piercement structures. Implications for the LUSI mud volcano, Indonesia. Marine and Petroleum Geology 26, 1751–1765.
Mazzini, A., Svensen, H., Akhmanov, G.G., Aloisi, G., Planke, S., Malthe-Sorenssen, A., Istadi, B., 2007. Triggering and dynamic evolution of the LUSI mud volcano, Indonesia. Earth and Planetary Science Letters 261 (3–4), 375–388.
Mori, J., Kano, Y., 2009. Is the 2006 Yogyakarta earthquake related to the triggering of the Sidoarjo, Indonesia mud volcano? Journal of Geography 118 (3), 2009.
Nawangsidi, D., 2007. In search of theory on flow mechanism of wild mud blow. In: Proceedings of the International Geological Workshop on Sidoarjo Mud
Volcano, Jakarta, IAGI-BPPT-LIPI, February 20–21, 2007. Indonesia Agency for the Assessment and Application of Technology, Jakarta.
Rubiandini, R., Maarif, A.S., Wahid, S., Sukiadi, T.K., Wijoyo, S., Wibisono, Y., Saleh, M., Sumanta, K., SuhartoPrastiyo, Rohi, P.A., Julianto, M.D., 2008. In: Haryono, M.Y. (Ed.), To Kill Lapindo’s Well (Indonesian Version). GMLL, Jakarta.
Sawolo, N., Sutriono, E., Istadi, B.P., Darmoyo, A.B., 2008. East Java mud volcano (LUSI): drilling facts and analysis. In: Proceedings of the African Energy Global Impact, AAPG International Conference and Exhibition, October 2008, Cape Town, South Africa.
Sawolo, N., Sutriono, E., Istadi, B.P., Darmoyo, A.B., 2009. The LUSI mud volcano triggering controversy: was it caused by drilling? Marine and Petroleum Geology 26.
Sudarman, S., Hendrasto, F., 2007. Hot mud flow at Sidoarjo. In: Proceedings of the International Geological Workshop on Sidoarjo Mud Volcano, Jakarta, IAGI-BPPT-LIPI, February 20–21, 2007. Indonesia Agency for the Assessment and Application of Technology, Jakarta.
Sunardi, E., 2007. Studi Geologi Dan Geofisika Semburan Lumpur di Daerah Porong Sidoarjo, Jawa Timur. In: Proceedings of the International Geological Workshop on Sidoarjo Mud Volcano, Jakarta, IAGI-BPPT-LIPI, February 20–21, 2007. Indonesia Agency for the Assessment and Application of Technology, Jakarta. Sutriono, E., 2007. Pemboran Sumur Eksplorasi Banjarpanji-1. In: Proceedings of the
International Geological Workshop on Sidoarjo Mud Volcano, Jakarta, IAGI-BPPT-LIPI, February 20–21, 2007. Indonesia Agency for the Assessment and Application of Technology, Jakarta.
Tingay, M.R.P., Heidbach, O., Davies, R., Swarbrick, R., 2008. Triggering of the LUSI mud eruption: earthquake versus drilling initiation. Geology 36 (8), 639–642. Unocal Basic Drilling Well Control (2001): Definition of a kick, 2001.