Hiệp hội Hồ tiêu Việt Nam
Vietnam Pepper Association
Head office:135A Pasteur Str., Dist. 3 Hochiminh City Tel: (84) 08 8.237.288 – 08 8.223.901 / Fax: (84) 08 8.223.901
Email: [email protected] Website: www.peppervietnam.com
PRODUCTION, PROCESSING AND IMPORT EXPORT PEPPER (REPORT AT 42TH CONFERENCE OF EXPORTER)
IPC ANNUAL MEETING
(Dated 22-26/2011 in Lombok, Indonesia)
I. The major factors affecting the Vietnam Pepper Industry in 2011:
• Advantages:
- Pepper price increasing significantly compared to previous years and increase of income and profits of farmers boosting production and business
development.
- The support of the Government in term of fiscal policies, credit and guidance to improve farming methods, giving less difficulty in production
and circulation.
• Difficulties:
- The financial crisis, global economic depression continued and even more serious affecting the global economy, including Vietnam.
- The weather was unusual, pet and diseases are still complicated, production costs increasing, lacking of investment capital driving pepper
trees degrading faster, average yield and production in some areas came
down. High volatile market that mainly in uptrend, traders have to adapt
themselves to the new situation.
• Overview of the production and export:
shortened life of pepper garden, faster degradation and rapid death.
Therefore, the production of the year 2011was negligibly higher compared
to that of 2010.
- Processing, diversification of products and trade Vietnam pepper were not adequate to the potential advantage since depending on the market and due
to the limitation of commercial promotion of the sector.
- Thanks to the imbalance of global demand and supply market becomes beneficial to producers. Besides, the farmers have good communication,
update information, estimation of market trend so they dictate market,
dominated sales, choosing the right time to sell at good price, have
contributed to regulating the volume of the local exporters, becoming less
dependent on the international future market.
- Pepper price increased continuously over the past years, especially in 2011; the market has been so different to previous years that forced local
traders and exporters to change the way of trading and exports. There are
less forward contracts. Outright businesses are preferred to limit the risk.
1. PRODUCTION
a. Plantation Area
Unit: Hectares
Year New plant
Harvesting Area
Not yet
harvesting area Total
2010 1.500 43.500 7.500 51.000
b. Cultivation area of major provinces.
Unit: Hectares
Name of Province 2010 2011
Binh Phuoc 10.500 10.600
Dak Nong 7.100 7.600
DakLak 4.900 5.500
Ba Ria Vung Tau 7.000 7.000
Dong Nai 7.000 7.000
Gia Lai 5.800 6.300
Other Provinces 8.700 8.500
Total 51.000 52.500
c. Production
Unit: MTS
Year Black pepper White pepper Total
2010 80.000 20.000 100.000
2011 80.000 20.000 100.000
2012 ** 85.000 20.000 105.000
** Projection
2. TRADE
2.1. Quantity and export revenue
- During nine months of 2011 export volume reached some 104,842 tons earning USD 593.3 million, increased by 6.9 % in volume and
- Pepper export in the whole year is estimated at about 115,000 MTS and bringing back total revenue of USD 650 million.
Months
Year 2010 Year 2011
Quantity
(tons) Value
Quantity (tons)
Quantity (tons)
January 7,585 23.6 4,693 23
February 6,235 19.4 4,796 22.5
March 14,405 42.3 15,639 77.7
April 16,193 49.9 15,133 83.5
May 15,183 49.2 13,184 83.5
June 12,235 40.2 15,174 76.8
July 12,053 47.5 12,893 74.3
August 7,966 32.7 16,472 100.4
September 6,244 27.7 6,858 47.4
October 6,253 28
November 6,120 29.2
December 6,369 31.3
2.2. Import markets
PEPPER EXPORT BY COUNTRY OF DESTINATION (Quantity in mt. and Value in US$)
No. Country of destination
2010 From Jan to
September 2011
Qty Value Qty Value
BLACK PEPPER 94,139 313 89,325 474
1 American 13,980 49.24 17,389 99.00
2 United Arab 12,793 44.56 9,905 53.74
3 India 5,318 14.92 5,645 28.13
4 Germany 8,527 28.67 5,244 27.38
5 Egypt 3,066 9.16 4,993 26.30
6 Pakistan 3,655 11.23 4,873 26.22
7 Nerthlands 5,432 18.53 4,650 24.23
8 Russia 3,775 11.75 3,461 18.31
9 Spain 1,278 4.35 3,096 17.86
10 Singapore 2,466 5.84 2,689 12.92
11 England 2,582 10.09 2,191 11.92
12 Poland 3,055 10.19 1,912 9.59
13 Korea 2,124 7.68 1,717 9.55
14 Turkey 1,207 2.99 1,642 5.84
15 France 1,423 4.55 1,576 8.44
16 Ukraine 2,601 8.42 1,567 7.92
17 Philippine 1,985 5.89 1,233 5.71
WHITE PEPPER: 22,722 108 15,517 119
1 American 2,434 11.09 2,292 17.76
2 Germany 6,470 31.88 3,229 23.88
3 Nerthlands 2,894 14.52 2,156 16.44
4 Indonesia 2,391 9.51 733 5.70
5 Japan 794 4.14 632 4.86
6 England 609 3.3 590 4.40
7 Singapore 401 1.78 584 4.35
8 India 916 3.52 576 4.77
9 Spain 612 3.06 489 3.88
10 United Arab 387 1.84 383 2.78
11 Belgium 253 1.18 345 2.42
12 Sweden 289 1.57 253 1.98
13 Thailand 730 3.49 235 1.91
14 South Africa 299 1.72 232 1.80
Others 3,243 15.55 2,788 21.9
GRAND TOTAL 116,861 421 104,842 593,3
Source: Vietnam Pepper Association
2.3. The export of processed products:
locally with quite advanced technology; total capacity reached 70,000 MTS per
year, out of which there are more than 14 steam washed treatment factories,
including Vietnam and foreign companies such as Netherlands, Japan and India.
The factories produce clean pepper of high quality, meeting the requirements of
the international standards such ASTA, ESA and Japan.
Type of pepper 2011 2012
Black pepper
(with ground black pepper, crushed)
95,000
7,800
100,000
9,000
White pepper
(with ground white pepper, crushed)
20,000
2,500
20,000
3,000
Total 115,000 115,000
However there is still about 70% export of raw material product, whole
seeds while 70% of total production is from 500g/l and above. Black pepper
export accounting for about 80%, white pepper, ground pepper for 20%
depending on the customers’ requirements and consuming market.
2.4. Estimation of exports in 2012.
- The exports in 2012 estimated at 115,000 to 120,000 tons.
- The basis of estimation: The plantation area increased but the harvesting
area did not increase (it takes 4 years to harvest). The weather and climate,
the complicated situation of pets and diseases, the old and weak trees
continue to expire. There is possibility that supply could not meet the
2.5. Import
Unit: tons
No. Country 2010 2011 *
1 Indonesia 13,614 2875
2 Brazil 1,051 850
3 Singapore 1,227 839
4 Malaysia 955 388
5 India 843 137
6 China 230 112
7 Mexico 83 25
Others 468 11
Total 17,870 5,238
*: figure until June, 2011
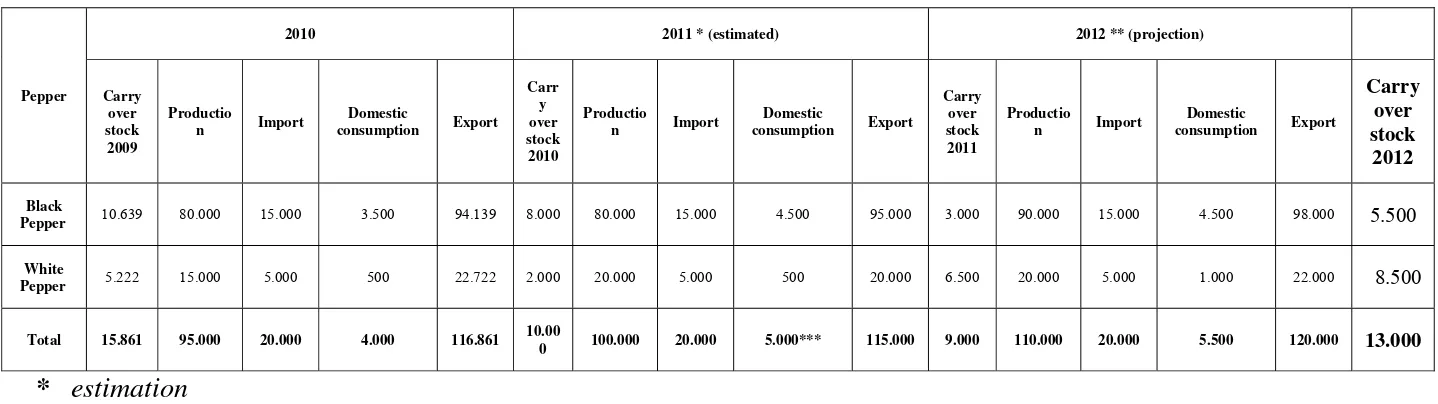
3. Summary of production, import and export, domestic consumption
and carry-over stock in 2010, estimation in 2011 and projection in
2012 (table 4)
4. Development program for pepper in the near future:
4.1. Development objectives
Ministry of Agriculture and Rural Development: stable scale of production
area of about 50,000 - 53,000 hectares, production reaches about 125,000 tons in
2015 and 135,000 tons in 2020. Export production reaches 135,000 tons in 2015
and 140,000 tons in 2020.Export value reaches USD 800 million in 2015 and
USD 1,000 million in 2020.
4.2. Problem Resolution of productivity, production, quality
improvement
Training IPC GAP, combines holding a workshop to learn experience
techniques, pest and disease prevention, sustainable organic farming, producing
the organic products, food safety and hygiene.
4.3. Solutions to the development of new products. Promotional
products, consumption.
Enhances the investment in processing technology, product diversifying,
improve quality, food safety and hygiene to meet the market’s demand,
international standards. Improving the trade promotion and mobilization
companies joining to find new customers, expand the market to boost export.
4.4. Methods of using and controlling fertilizers, pesticides on
pepper trees
The too expensive lesson that Vietnam Pepper farmers paid for the
condition of pepper tree that were fast dying, slow wilting over years; The reason
for this disease was too much chemical fertilizers, pesticides applying on the
pepper trees, causing polluted soil poisoning the pepper trees. When earthworm
and pets attacked the trees got diseased and spread to the others on a large scale,
consequently pepper died in mass. Now everyone acknowledge this matter very
clearly, switch to organic farming, using organic fertilizers, limitation of
chemicals fertilizers and pesticides are used, environmental improvement for
pepper trees to recover and survive, sustainable development, to have organic
products, ensuring no pesticide residues.
4.5. Solutions on trade and investment policy:
- Government, Ministry of Agriculture has favorable policies on credit,
investment tax on Agriculture as nursery garden, production practices
under GAP, building trade brand, promotion, holds the exhibitions, trade
fairs, visiting and doing survey inbound and outbound, support and giving
- Encourages joint ventures between foreign and local enterprises to invest
in production, trading, processing for export under the terms and
conditions of content and procedure of integration to the WTO.
4.6. Estimation of area and production in 2010 to 2012.
Unit: hectares, tons
CONCLUSIONS AND RECOMMENDATIONS:
For the sustainable development of the International Pepper Community
and the efficient operation of the IPC, we would like recommend the following:
1. IPC should continue to cooperate with international organizations (such as
FAO, WB, ...) in term of research to do projects on cultivation techniques,
processing and trade, building trade brand etc., to assist in implementation
of these projects in its member countries.
2. IPC needs timely information and accurate data on area, yield, harvest
progress, production and the volume of import and export of pepper in IPC
member countries.
3. IPC needs to strengthen relationships and help its member countries more
about diversity and richness of information. (The content of Weekly report
of IPC is very sketchy and very slow, lacking of regular estimation for the
situation of supply - demand, world market prices to help member
countries to plan up their production and trade efficiently).
4. During this conference, IPC needs review on its functions, tasks and role
of the IPC to its members, in term of right and responsibilities of each
member of the IPC. Concerning the annual fee paid to IPC among
Year Plantation area Production area Production
2010 51.000 43.500 95.000
2011 52.500 45.500 100.000
countries, it is necessary to discuss about in this meeting, to ensure the
reasonability and equal right and responsibilities from the IPC to the
members and vice versa. Regulations that were issued by IPC are too old
(since 1972) so we suggest IPC needs study, revise and add to be suitable
Report of 42nd Pepper Exporters Meeting, 25th Nov. 2011 162 Table 2:
SUMMARY OF PRODUCTION, DOMESTIC CONSUMPTION, EXPORTS, IMPORTS AND CARRY OVER STOCK IN 2010, ESTIMATION IN 2011 AND PROJECTION IN 2012.
Pepper
2010 2011 * (estimated) 2012 ** (projection)
Carry
consumption Export Carr
consumption Export
Carry
consumption Export
Carry
Total 15.861 95.000 20.000 4.000 116.861 10.00
0 100.000 20.000 5.000*** 115.000 9.000 110.000 20.000 5.500 120.000 13.000