Solusi Analitik Rambatan Panas dengan Syarat Batas Tak
Homogen
Analytical Solution of Heat Flow with Nonhomogeneous Boundary
Conditions
Jefery Handoko
1, Suharsono S.
11
Jurusan Matematika FMIPA Universitas Lampung
[email protected], [email protected]
Diterima 28 November 2016, direvisi 1 Januari 2017, diterbitkan 28 Mei 2017
Abstrak
Masalah rambatan panas dirumuskan dalam bentuk persamaan diferensial parsial yang tak bergantung pada waktu t dengan syarat batas tak homogen. Persamaan ini diselesaikan dengan metode analitik di sekitar titik temperatur kesetimbangan ditentukan dengan metode pemisah peubah sehingga diperoleh solusi analitik. Kata-kata kunci : Persamaan Diferensial Parsial, Rambatan Panas, Syarat Batas Tak Homogen.
Abstract
Heat flow problem is defined in the form of partial differential equation which is not depend on time t completed by nonhomogeneous boundary conditions. This equation solved by analytic method around temperature equilibrium point determined by the method of separation of variables for finding analytic solutions.
Keywords : Partial Differential Equation, Heat Flow, Nonhomogeneous Boundary Conditions
Pendahuluan
Konsep rambatan panas merupakan kemajuan dari perkembangan teknologi, salah satu misalnya pertukaran panas dan pembangkit listrik panas bumi [1]. Energi panas dapat digunakan dalam kimia sebagai contoh pada elektron pengelasan balok [2]
dan proses hidrasi reaksi kimia
[3].Perambatan dilakukan secara konveksi dengan tabung [4-5] dan konduktif-konveksi dengan rotasi dan gradien panas [6]. Optimisasi topologi pada panas [7] dan material untuk efisiensi dan minimum berat dan volume [8] menggunakan proses
perambatan. Pemodelan matematika
dilakukan pada pemanasan sementara lempeng [9], efek hisap/tiup aliran stabil [10], efek lepas penyusutan [11], serta efek radiasi termal [12].
Pandang sebuah model rambatan panas pada batang besi seragamsepanjang
L
dengan temperatur konstan pada sisi kiri dan sisi kanan. Persamaan ini menggunakan nilai awal dan syarat batas. Metode pemisah peubah tidak dapat langsung digunakan karena syarat batas tak homogen. Untuk menganalisis masalah ini, definisikan titik temperatur kesetimbangan dengan peubah waktu bebas dengan mengabaikan nilai awal [13].Teori/Metode
1. Rambatan panas dengan sumber dan syarat batas tak homogen
1.1. Syarat batas terhadap waktu Rambatan panas (tanpa sumber) pada batang besi seragam
dengan panjang
L
dengantemperatur tertentu dengan suhu 0
A
danB
0 di sisi kiri dan kanan. Jika syarat awal dipilih, masalah matematika untuk suhuu
(
x
,
t
)
adalah
)
(
x
Q
ku
u
t xx (1.1a)A
t
u
(
0
,
)
(1.1b)B
t
L
u
(
,
)
(1.1c))
(
)
0
,
(
x
f
x
u
(1.1d)1.2. Titik temperatur kesetimbangan
Titik temperatur
kesetimbangan
r
(
x
,
t
)
dengan temperatur diketahui dikatakan stabil pada persamaan panasmemenuhi0
xxr
(1.2a)dengan
)
(
)
,
0
(
t
A
t
r
(1.2b))
(
)
,
(
L
t
B
t
Dengan mengabaikan nilai
awal pada titik temperatur
kesetimbangan dapat dinyatakan unik dalam bentuk persamaan
x
1.3. Metode pemisah peubah Misalkan
Dengan menggunakan metode
pemisah peubah diperoleh
dan differensiabel terhadap x
xx xx
xx
v
r
u
. (1.3g)Substitusikan persamaan (1.3d – 1.3f) ke persamaan (1.1a) sehingga
Dengan metode pemisah peubah diperoleh hasil
Aplikasi Metode Pemisah Peubah
Diketahui persamaan panas dengan sumber energi termal
Q
(
x
,
t
)
sebagai berikutAkan dicari solusi dari persamaan di atas. Misal untuk studi kasus ini dipilih
A
maka berdasarkan (1.2d) diperoleh
x
Dengan menyulihkan persamaan (1.3e - 1.3g, 2.3) ke persamaan (1.3h) diperoleh
k
Dengan menggunakan metode pemisah peubah didapat
Substitusikan ke persamaan (2.16) dengan
c
suatu konstanta diperoleh batas dan nilai awal. Dengan persamaan (2.13 - 2.15) diperoleh1 2 diperoleh persamaan (2.32) yang dapat digambarkan sebagai berikut.
Gambar 1. Model rambatan panas.
Kesimpulan
Persamaan panas dapat diselesaikan secara analitik dengan syarat batas tak homogen
Penulis mengucapkan terima kasih kepada seluruh dosen dan staff Jurusan Matematika Universitas Lampung atas diskusi dan saran yang bermanfaat.
Referensi
[1] Salim N. Kazi, “An Overview of Heat
Transfer Phenomena”, Penerbit
Intech,Open Access,2012, p. 125 [2] R. Rai, P. Burgardt, J. O. Milewski, T. J.
Lienert, and T. DebRoy,”Heat Transfer and fluid flow during electron beam welding of 21Cr-6Ni-9Mn steel and Ti-6Al-4V alloy”,Journal of Physics D: Applied Phyics 42,1-12 (2009)
[3] K. Meinhard and R. Lackner,”Multi-phase hydration model for prediction of hydration-heat release of blended cements”, Cement and Concrete Research 38, 794-802 (2008)
[4] P. Canhoto and A. H. Reis,”Optimization of fluid flow and internal geometric of volumes cooled by forced convection in an array of parallel tubes”, International Journal of Heat and Mass Transfer 54,4288-4299 (2011)
[5] T. Yokomine, J. Takeuchi, H.
Nakaharai,S. Satake, T. Kunugi, N. B. Morley, and M. A. Abdou,”Experimental investigation of turbulent heat transfer of high prandtl number fluid flow under strong magnetic field”, Fusion Science and Technology 52, 625-629 (2007) [6] J. M. Lopez, F. Marques, and M.
Avila,”Conductive and convective heat transfer in fluid flows between differentially heated and rotating cylinders”, International Journal of Heat and Mass Transfer 90, 959-967 (2015) [7] E. M. Dede, “Multiphysics topology
[9] M. Y. Kim, “A heat transfer model for the analysis of transient heating of the slab in a direct-fired walking beam type reheating furnace”, International Journal of Heat and Mass Transfer 50,3740-3748 (2007)
[10] K. Bhattacharyya and G. C. Layek, “Effects of suction/blowing on steady boundary layer stagnation-point flow and heat transfer towards a shrinking sheet with thermal radiation”, International Journal of Heat and Mass Transfer 54, 302-307 (2011)
[11] K. Bhattacharyya, S. Mukhopadhyay, and G. C. Layek, “Slip effects on boundary layer stagnation-point flow and heat transfer towards a shrinking sheet”, International Journal of Heat and Mass Transfer 54, 308-313 (2011) [12] K. Bhattacharyya, S. Mukhopadhyay, G.
C. Layek, and I. Pop, “Effects of thermal radiation on micropolar fluid flow and heat transfer over a porous shrinking sheet”, International Journal of Heat and Mass Transfer 55, 2945-2952 (2012) [13] R. Haberman, “Applied Partial
Differential Equations with Fourier Series and Boundary Value Problems, Pearson Prentice Hall, 5th Edition, 2013.
The Analysis of Causal Relationship between Innovation, Research
& Development Expenditures and Economic Growth in Indonesia
Devi Oktiani
Baristand Industri Bandar Lampung
divya_de_vi @yahoo.com
Diterima 28 November 2016, direvisi 1 Januari 2017, diterbitkan 28 Mei 2017
Abstract
This paper starts with the overview of Research and Development (R&D) expenditures as an indicator of innovation. The objective of this research is to investigate the relationship between innovation which represented as government‟s R&D expenditure and economic growth in country level in Indonesia. Economic growth is represented by gross domestic product (GDP). The research focuses on agriculture, forestry, and fishery sectors. The analysis uses Granger‟s causality test, unit root test, and Vector Auto Regression (VAR) model estimation. The causal relationship were analyzed on the level which is stationary and has no co-integration relationship between variables. According to Granger‟s causality test applied, there are short term and long term causal relationship between R&D expenditure and economic growth.
Key word : R&D expenditures, GDP, Granger‟s causality, VAR model.
Introduction
The goal of innovation is create a positive change which make someone or something better, it also means renewal of science and technology that provide economic and social benefit [1]. This study focus on Research and Development (R&D) expenditures and economic growth related to innovation. R&D activities are generally accepted as the driving force of economic growth [2]. The increase of R&D in a certain level required in every country as the basis of innovation to move [1].
Indonesia, as the biggest country in south east Asia in term of nominal GDP and a country with the big number population, its economic growth has impact in regional and international trade. Government of Indonesia spend 0.08 % of GDP as R&D expenditure, this number is far below the average of countries in the world which is 2.1 % of GDP [3]. This study focuses on government expenditure in agriculture, fishery, and forestry, as this three sectors has big impact on national GDP.
The objective of this study is to empirically observe the causal relationship between R&D expenditures and economic growth in Indonesia. In the study, Granger‟s causality test will be applied by considering the data about government expenditure and GDP. The positive or negative impact is analyzed using Varian Autoregressive (VAR) model. In the literature review section of this study the
impacts of R&D expenditures on economic growth will be mentions, and then the results will be presented and evaluated in the empirical findings section. The methodology part will offer information about the data set and methodology used in the empirical part of this study.
Literature Review and Methodology
1. Theoretical Background
Economic growth is influenced by innovation and imitation. Innovation means firms invest significant resources in research and development (R&D) activities to discover qualitatively improved products and capture associated profits. Imitation means when the firms are successful, other firms were attracted by these profits and then they imitate and improve the development and production of new products [4].
Innovation is not only related to or driven by a relatively small group of high technology industries. Industries that are regarded as traditional industry or mature or „low-tech‟ often generate substantial amounts of sales from technologically new products and processes. The service sector is also strongly innovative, across almost all of its component activities, and this is particularly important since the service sector is the largest sector in all advanced economies [7].
On measuring the innovation, researchers may use either input measures such as R&D expenditures or innovation outcomes such as patents [8]. R&D intensity, the ratio of R&D expenditure to GDP is an important indicator to measure the extent of a country's efforts in technological innovation. R&D expenditure, by source of funds are grouped into: government funds, corporate funds, foreign funds, and other funds [9], [10].
Innovation process also requires a number of non-R&D activities such as the acquisition of patent, design, trial production, training of personnel, market research and, investment in new production capacity. [11]. R&D outputs includes copyrights, trademarks, patents, and other forms of intellectual property protection. Similar to tangible capital assets such as machinery and equipment, the R&D outputs can be used repeatedly, and generate income in a long period. Therefore, R&D expenditures is in common with investment expenditures than with the intermediate expenditures that firms make to support their production processes [12].The non-R&D expenditure may be of considerable quantitative importance. In many of these countries, information about non-R&D expen- diture on innovation is virtually not available [11]. As a result, innovation measurement is consider only R&D however, this is frequently considered unsatisfactory. R&D is naturally and strongly depend on the human capital factor, especially the highly qualified human resources in science and technology. So to support the R&D means not only to support the R&D projects and businesses but also the human capital involved [13]. Research and development is a key long-run determinant of productivity and consumer welfare and Innovation is widely rcognized as the key to long-term economic prosperity [14], [15]. The innovation, R&D expenditures and the investments in technology are ensuring competitiveness, progress, and a sustainable economic growth [16].
According to the theory of economic growth, since technical progress is closely associated with the knowledge emerging from R&D activities, the technical change is considered to be generated by formal R&D activities. Therefore, the new growth economic theory included R&D as a factor of influence in the macroeconomic models [17].
The impact of a technological innovation will generally depend not only on its inventors, but also on the creativity of the eventual users of the new technology [18].
Agricultural R&D is characterized by very long lags between research investments and their impacts. The benefits of today‟s research investments may accrue primarily to some future generation of producers and consumers. As a result agricultural R&D has been a highly profitable investment from society‟s point of view [19]. Measuring innovation in agricultural firms is complicated due to the complexities and uncertainties linked to the sector [20]. A common perception is that agricultural research is primarily the domain of the public sector, while research in other sectors is the domain of private sector. Recent years, R&D in agricultural sectors is prominent in rich countries. The trend has trended up significantly since 1981 and now almost half the OECD‟s agricultural R&D is performed by the business sector [19].
For governments in developing countries, structuring agriculture to contribute to economic growth has become a challenge [21], it includes technological innovation to raise adequate food supply and intensification of innovative agrarian programs [22]. While in OECD countries, the composition of R&D has shifted from low to high technology areas [23].
Theoretically, there is a positive linkage between innovation and economic growth. According to this hypothesis, R&D plays a major role in innovation, raising productivity and accelerating economic growth [Cetin 2013].The high level of R&D investment leads to higher level of total factor productivity (TFP), which will accelerates economic growth. It is also possible that economic growth positively affect total R&D investment. As a result, it can be argued that total R&D investment can Granger – cause economic growth, just as economic growth can Granger cause total R&D investment [24].
There are previous research which studies the causal relationship between R&D Seminar Nasional Riset dan Industri 2016
expenditure and economic growth. Haskel (2013) find a statistically significant correlation between market sector TFP growth and Research Council spending [25]. Akcay (2011) use VAR model, Johansen co integration, Granger causalty to analyze the causal relationship [24]. Pece (2015) provide evidence of a positive relationship between economic growth and innovation [16]. Sylwester (2001) investigates relationship between R&D and economic growth in 20 OECD and G7 countries, employing multi varian regression analysis. The rsults indicates that there is no strong causal relationship found between R&De xpenditures and economic growth in OECD countries, while a positive relationship between industry R&D expenditures and economic growth is establish in the case of the G7 countries [24],[26]. The results of Granger causality test of R&D expenditures cause GDP for Finland, France and Spain indicate that GDP causes R&D expenditures in Denmark and there is no causality between variables in other countries [27].
Bayarcelik (2012) develops a model to examine the relation between researchers employed in R&D departments, R&D expenditures, patents as innovation indicators, and Gross Domestic Product (GDP) as economic growth. The results indicates that there is a positive and significant relationship between R&D investment and number of the employees in the R&D department with GDP. However, there is a significant but negative relation between GDP and number of patents. Patent involves costs in terms of various fees including, such as, filing fees, agent fees and translation fees which makes patenting costly in the short-run [28].
Gumus (2015) provides an empirical analysis of the relationship between R&D expenditures and economic growth, and determines whether this relationship differs with respect to the degree of development. countries in the long run, which is consistent with the relevant literature. While for developing countries, the effect is weak in the short run but strong in the long run, as expected. The study adds new empirical evidence to the literature [29].
The study of the effect of total research and development (R&D) spending and its
sub-components (business and government R&D spending) on economic growth in 18 OECD countries over the period 1981-2012 indicate that total and business R&D spending do not have a statistically significant effect on economic growth. However, government R&D spending influences economic growth in both the short and long run. While R&D spending by government has a negative effect on economic growth in the short run this effect becomes positive in the long run. [30].
Sylvester (2001 studies the association between R&D and economic growth in 20 OECD countries using a multivariate regression. There is not found to be a strong association between the two. But when considering only G-7 countries, there is re- ported to be a positive association between industry R&D expenditures and economic growth [26].
The economic growth as an effect of R&D in the EU15 countries is less significant than that for other industrialized countries. Comparation between EU 15 and the US indicates that the US has been able to generate a stronger growth response from its R&D spending [31].
The impact of R&D activity has significant impact on economic growth only among the more developed countries. Among middle income and less developed ones, the effects are insignificant [32]. As an example, Tuna (2015) applies the Granger‟s causality analysis, it is mentioned that there is no causality relationship between the R&D goverment expenditure and GDP in Turkey [2]. The empirical analysis finds that R&D investment has played an important role in fostering productivity growth and productivity impact of R&D is stronger in more advanced industries [33].
There are also instances where studies show that innovative activities have a negative impact on firm growth, most commonly caused by the inability of the high cost of research to be recovered through increased sales or profits [34].
Innovation has a positive effect on per capita outputs of both developed and developing countries. However, only the large market OECD countries are able to increase their innovation by investing in R&D and the remaining OECD countries seem to promote their innovation by using the know-how of other OECD countries [35]. R&D subsidies and R&D tax incentive are used by most OECD countries and an increasing number of emerging economies [36].
The positive impact of innovative activities on firm is limited to the fastest growing firms, while for the others it often plays a negative role, that for those firms that R&D does not lead to a successful new product or process, it is simply a very large cost [29].
The analysis of the efficiency of R&D investment concludes that in the longer run, investment in capital goods is more efficient in achieving higher economic growth [37]. An economy with a larger stock of human capital will experience faster growth [38].
Because of the different results related to causal relatioship between R&D expenditure and economic growth, several governments increases their policy commitment to innovation with significant impacts on levels of R&D expenditures of their countries [39]. It is important to reform the management and funding of public investment in science and research, as well as public support to innovative activity in the private sector.
2. Methodology
Economic growth is measured as GDP. Innovation is measured as Government expenditure for R&D in agriculture, fishery, and forestry. The annual secondary data of GDP and R&D government expenditure are collected from FAO [40], [41]. The stationary of each variable, GDP and R&D are tested by unit root test. The Granger‟s causality test is applied on analyses the causal relationship Wool. Analysis uses Eviews software.
The variables is set in natural logarithmic in order to satisfy the linear parameter condition. The following model is used :
lnGDPit = c +α1 ln RNDit + Uit ………….. (1)
where GDP is GDP and RND is government expenditure for R&D. This model is used in previous research [29], [42], [6].
The following hypothesis for analyze the causal relationship:
a. GDP Granger cause RND
H0: There is no significant impact of GDP on RND.
H1: There is a significant impact of GDP on RND.
b. RD Granger cause GDP
H0: There is no significant impact of RND on GDP.
H1: There is a significant impact of RND on GDP.
Result and Discussion
The GDP of Indonesia is tend to increase (Figure 1), the government expenditure for R&D is also increase (Figure 2), even the percentage is still below the average countries. The government espenditure on R&D is increase almost four times during 2006, compare to 2005.
Figure 1. Annual GDP of Indonesia (Million Rupiah)
Source : Food and Agriculture Organization ot The United nations [40]
Figure 2. Annual Government R&D Expenditure of Indonesia (Million Rupiah)
Source : Food and Agriculture Organization ot The United nations [41].
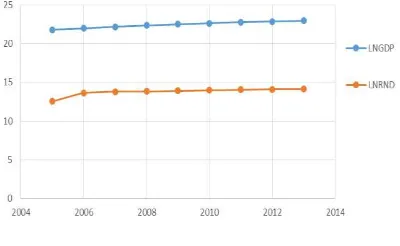
Variable RD is exponential, in order to satisfy the linear parameter condition as one prerequisite condition in linear regression method, the variables is converted in natural logarithmic (Figure 3)
Figure 3. Ln GDP and Ln RND
The stationary of series included in the analysis is tested. In the process, ADF root test is applied on the level, using the Akaike Information Criteria (AIC). The basic hypothesis for the unit root test is that each variable has a unit root.
Table 1. LNGDP Unit Root Test
t-Statistic Probability ADF test statistic
-3.451329 0.0421 Test
critical values
1%
level -4.582648 5%
level -3.320969 10%
level -2.801384
ADF test statistic for LNGDP (-3.45) is below the ADF critical value on 5 % significant level (-3.32), the null hypothesis ran be rejected, it means LNGDP has no unit root or stationary.
Table 2. LNRD Unit Root Test
t-Statistic Probability ADF test statistic
-48.62525 0.0001 Test
critical values
1%
level -5.835186 5%
level -4.246503 10%
level -3.590496
ADF test statistic for LNRND (-48.62) is below the ADF critical value on 5 % significant level (-4.24), the null hypothesis ran be rejected, it means LNRND has no unit root or stationary.
A causal relationship test is applied in order to determine the direction of cause and effect relationship between series examined in the research. Granger causality test based on Vector Autoregression (VAR) model is applied using stationary LNGDP and LNRND series. In VAR model, the causal relationship considering the variables in the previous year. This analysis considering the second lag (t-2). Software Eviews estimates the causal relationship based on the following equation: LNGDPt = α0 + α1LNGDPt-1 + αLNGDPt-2 + β1LNRNDt-1 + β2LNRNDt-2 +εt ……. (2) LNRNDt = α0 + α1LNRNDt-1 + αLNRNDt-2 + β1LNGDPt-1 + β2LNGDPt-2 +μt ……. (3)
The Granger causality indicates that LNRND Granger‟s cause LNGDP, while LNGDP does not Granger‟s cause LNRND (Table 3). The null hypothesis that LNRND does not Granger cause LNGDP can be rejected on 10 % significant level because the probability is 0,0684 , less than 10%. The null hypothesis that LNGDP does not Granger Cause LNRND cannot be rejected as the probability is 0.1092.
Table 3. Granger Causality Test
The following VAR models based on equation 2 and 3 is applied :
LNGDPt = 2.543712 + 0.147829 LNGDPt-1 + 0.398960 LNGDPt-2 + 0.527563 LNRNDt-1 + 0.037125 LNRNDt-2 …. (5) LNRNDt = 4.144854 + 0.203361 LNRNDt-1 + 0.263321 LNRNDt-2 + 0.082252 LNGDPt-1 + 0.263321 LNGDPt-2 …… (6) Table 4. Vector Autoregression (VAR) Estimates
LNGDP LNRND
LNGDP(-1) 0.147829 0.082252 standar error (0.16927) (0.17032)
t-statistic [ 0.87331] [ 0.48294] Null Hypothesis Statistic Prob. LNRND does not Granger
Cause LNGDP 13.6265 0.0684 LNGDP does not Granger
LNGDP(-2) 0.39896 0.263321 standar error (0.17292) (0.17399)
t-statistic [ 2.30712] [ 1.51343]
LNRND(-1) 0.527563 0.203361 standar error (0.22388) (0.22526)
t-statistic [ 2.35647] [ 0.90280]
LNRND(-2) 0.037125 -0.052704 standar error (0.02135) (0.02148)
t-statistic [ 1.73906] [-2.45372]
C 2.543712 4.144854 standar error (1.26843) -1.27624 t-statistic [ 2.00540] [ 3.24771]
R-squared 0.999567 0.997851 F-statistic 1153.755 232.2076 Akaike AIC -6.118065 -6.105797 Akaike AIC -12.4013
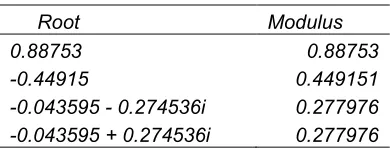
In order to observe the stability of VAR model it is necessary to check the roots of characteristic polynomial. If all of the roots in polynomial fungtion is within the circle or its absolute value is less then 1, it means that VAR model is stable. VAR model in this analysis is stable (Table 4) the absolute value of each variable is less than 1 (Table 5). Table 5. Unit Root Test of VAR Model
Root Modulus
0.88753 0.88753
-0.44915 0.449151
-0.043595 - 0.274536i 0.277976 -0.043595 + 0.274536i 0.277976
It can be concluded that government expenditure on research and development has significant and positive impact on economic growth. It is necessary to make policy and regulation more conducive to innovation. Government investment in science and research development can play an important role in development and other general-purpose technologies and in enabling further innovation.
Conclusion
The Granger causality indicates that in Indonesia, government expenditure on R&D Granger cause economic growth on GDP, while GDP does not Granger cause R&D Government expenditure. Government expenditure on research and development
has significant and positive impact on economic growth.
Referensi
[1] Burcay Yasar Akcali and Elcin Sismanoglu, “Innovation and the effect of research and development (R&D) expenditure on growth in some developing and developed countries”, Social and Behavioral Science 195, 768-775 (2015)
[2] Kadir Tuna, Emir Kayacan, and Hakan Bektas, “The relationship between research & development expenditure and economic growth : the case of Turkey”, Social and Behavioral Science 195, 501-507 (2015)
[3] The worlbank, http://data.worldbank.org/ indicator/GB.XPD.RSDV.GD.ZS,
accessed 20 November 2016
[4] Paul S. Segerstrom, “Innovation, imitation and economic growth” Econometrics and Economic Theory Paper 8818, 1-38, 1990
[5] Phillip LeBel , “The role of creative innovation in economic growth: Some international comparisons”, Journal of Asian Economics 631, 1-14 (2008)
[6] Erdil Sahin B, “The relationship between R&D expenditures and economic growth: panel data analysis 1990-2013”, EY International Congress on Economics II "Growth, Inequality and Poverty” November 5-6, 2015, Ankara Turkey, pp. 1-18
[7] Lynn K. Mytelka and Keith Smith, “ Innovation theory and innovation policy: bridging the gap”, Paper presented to DRUID Conference,
Aalborg, June 12-15
2001,UNU/INTECH1 Keizer Karelplein 19 6211 Maastricht, The Netherlands, pp. 1-22
[8] Poh Kam Wong, Yuen Ping Ho, and Erkko Autio, “Entrepreneurship, innovation and economic growth: evidence from GEM data”, Small Business Economics 24, 335–350 (2005)
[9] Hi Nongfu and Zhang Shiyun, “ Impacts of R&D expenditure on economic growth and structure based on Beijing dynamic CGE model”, unpublished
[11] Erik Brouwer a and Alfred Kleinknecht, “Measuring the unmeasurable: a country's non-R&D expenditure on product and service innovation”, Research Policy 25, 1235-1242, 1997
[12] Wulong Gu, Berouk Terefe, and Weimin Wang, “The impact of R&D capitalization on GDP and productivity growth in Canada” Economic Insight 16, 1-2 (2012)
[13] Jan Cadil and Ludmila Petkovova, “ Human capital, R&D and growth- some empirical findings, The 8th International Day of Statistics and Economics, 11-13 September 2014, Prague, 308-315
[14] Charles I. Jones and John C. Williams, “Too much of a good thing? The International Commerce and Economics, 223-240
[16] Andreea Maria Pece, Olivera Ecaterina Oros Simona, Florina Salisteanu, “An empirical analysis for CEE countries” Procedia Economics and Finance 26, 461 – 467 (2015)
[17] Gheorghe Zaman and Zizi Goschin, “Technical change as exogenous or endogenous factor in the production function models. Empirical evidence from Romania”, Romanian Journal of Economic Forecasting 2, 29-45 (2010)
[18] Nathan Rosenberg, “ Innovation and Economic Growth”, OECD Publisher, 2004
[19] Julian M. Alston, Philip P. Gardey, and Johannes Roseboom, “Financing agricultural research: international investment patterns and policy perspectives”, World Development 26 (6),. 1057-1071 (1998)
[20] Ariza,C., Rugeles, L., Saavedra, D, and Guaitero, B., “ Measuring innovation in agricultural firms; a methodological approach”, The electronic Journal of Knowledge 11(3), 185-198 (2013)
[21] Martin Falk, “R&D spending in the high-tech sector and economic growth” Research in Economics 61, 140–147 (2007)
[22] Bernard Nnamdi Emenyeonu,
“Communication and adoption of agricultural innovations: quantifications and notes towards a conceptual model”,
Africa Media Review 1(2). 105 – 119 (1987)
[23] Qin Fei and Rajah Rasiah, “Electricity consumption, technological innovation, economic growth and energy prices: Does energy export dependency and development levels matter?”, Energy Procedia 61 , 1142 – 1145 ( 2014 )
[24] Selcuk Akcay, “Causality relationship between total R&D investment and economic growth: evidence from United States”, The Journal of Faculty of Economics and Administrative Sciences 16, (1),79-92 (2011)
[25] Jonathan Haskel and Gavin Wallis, “Public support for innovation, intangible investment, and productivity growth in the UK market sector”, Economic Letters 119, 195-198 (2013)
[26] Kevin Sylwester, “R&D and economic growth”, Knowledge, Technology, & Policy, 13(4), 71-84 (2001)
[27] Murat Cetin, “ The hypothesis of innovation based economic growth: a causal relationship”, International Journal of Economic and Administrative Studies 6 (11), 1-16 (2013)
[28] Ebru Beyza Bayarcelik and Fulya Tasel, “Research and development: source of economic growth” Social and Behavioral Sciences 58, 744 – 753 (2012)
[29] Erdal Gumus and Ferdi Celikay,”R&D expenditure and economic growth: new empirical evidence”, The Journal of Applied Economic Research 9 (3), 205– 217 (2015)
[30] Cigdem Borke Tunali, “The effect of research and development spending on economic growth in OECD Countries”, Journal of Administrative Sciences 14(27), 59-79 (2016)
[31] Ari Kokko, Patrik Gustavsson Tingvall, and Josefin Videnord, “ The growth effects of R&D spending in the EU: a meta-analysis”,
Economics Discussion Paper no. 2015-29, 1-20 (2015)
[32] Maury Gittleman and Edward N, “R&D activity and cross-country growth comparisons” Cambridge Journal of Economics 19, 189-207 (1995)
[33] Dongyeol Lee, “Role of R&D in the productivity growth of Korean industries: technology gap and business cycle”, Journal of Asian Economics 45, 31-45 (2016)
[35] Hulya Ulku, “R&D, innovation, and economic growth: an empirical analysis”, IMF Working Paper, 1-37 (2004)
[36] Dirk Czarnitzki and Otto Toivanen, “Innovation policy and economic growth”, European Econoy Economic Papers 482 ,1-40, (2013)
[37] Zuzana Kristkova, “Impact of R&D investment on economic growth of the Czech Republic – a recursively dynamic CGE approach”, Prague Economic paper 4, 412-433 (2012)
[38] Paul M Romer, “Endogenous
technological change”, The Journal of Political Economy 98 (5), Part 2, S71-S102 (1990)
[39] Argentino Pessoa, “R&D and economic growth: how strong is the link?”, Economic Letters 107, 152-154 (2010)
[40] Food and Agriculture Organization of The United Nations,
http://www.fao.org/faostat/en/#data/IG, accessed 10 November 2016
[41] Food and Agriculture Organization of The United Nations,
http://www.fao.org/faostat/en/#data/MK, accessed 10 November 2016
[42] Alireza Poorfaraj, Ahmad Jafari Samimi, and Hadi Keshavarz, “Knowledge and economic growth: evidence from some developing countries “, Journal of Education and Vocational Research 1(1), 21-25, 2011
PEMBUATAN DAN PENGUJIAN KAPASITOR DARI PEMANFAATAN
LOGAM BEKAS BAHAN ALUMINIUM DAN KUNINGAN
Mohamad Marhaendra Ali, Deny Suryana
Balai Riset dan Standardisasi Industri Surabaya
Email : [email protected], [email protected]
Diterima 28 November 2016, direvisi 1 Januari 2017, diterbitkan 28 Mei 2017
ABSTRAK
Beberapa komponen elektronika seperti kapasitor selalu digunakan pada beberapa peralatan listrik rumah tangga sehingga kebutuhannya sangat besar. Di Indonesia untuk memenuhi beberapa komponen elektronika tersebut masih mengimpor dari negara lain. Secara umum kapasitor terdiri dari dua elektroda yang terbuat dari konduktor dan bahan dielektrik yang berada di antara kedua elektroda itu. Dalam pembuatan kapasitor ini selain menggunakan aluminium juga menggunakan kuningan sebagai komposisinya. Pada bahan plat aluminium memiliki nilai kapasitansi paling besar yaitu 25,91 µF sedangkan plat kuningan memiliki nilai kapasitansi 6,14 µF dengan menggunakan nilai Resistansiyaitu 1KΩ, nilai teganganyaitu 7 volt dan panjang plat 65 cm. Penambahan panjang plat dapat menngkatkan nilai kapasitansi kapasitor. Pada panjang plat 78 cm maka nilai kapasitansi kapasitor bahan plat alumunium sebesar 29,53 µF sedangkan plat kuningan 11,73 µF. Perekayasaan dan pembuatan komponen kapasitor dari logam bekas bahan aluminium dan kuningan sebagai substitusi komponen import nantinya diharapkan berguna bagi masyarakat dan industri.
Kata kunci: Kapasitor, nilai kapasitansi, charge discharge, plat aluminium, plat kuningan
ABSTRACT
Some electronic components such as capacitors always used in some electrical household appliances that need is great. In Indonesia to fulfill of some electronic components are still imported from other countries. Generally a capacitor consists of two electrodes made of conductor and dielectric material located between the two electrodes. In the manufacture of capacitors besides using aluminium also using brass in addition to using the former also used the former as its composition. On the aluminum plate material has the greatest capacitance value is 25,91 µF while brass plate has a capacitance value is 6,14 μF with using resistance value is 1KΩ, Voltage value is 6 volt and length plateis 65 cm. Addition length of aluminum plate can increase the capacitor capacitance value. The length of plate is 78 cm then the capacitor capacitance value of aluminum plate material is 29,53 μF while the brass plate is 11,73 μF. Engineering and manufacturing of capacitor co mponents from scrap metals of aluminum and brass materials as the substitution of imported components is expected useful for the public and industry. Engineering and manufacture of electronic components capacitors originating from scrap metal materials of aluminum and brass as substitution of imported components is expected useful for the public and industry.
Keyword :Capacitors, capacitance value, charge discharge, aluminum plate, brass plate
Pendahuluan
Pesatnya kemajuan industri teknologi informasi dan komunikasi selain berdampak positif juga berimplikasi negatif dengan lahirnya sampah atau limbah jenis baru yang dikenal dengan sampah elektronik atau electronic waste (e-waste). Sampah elektronik didefinisikan sebagai peralatan listrik dan elektronik yang telah rusak dan tidak dipakai Lagi oleh pemiliknya. dapat juga didefinisikan sebagai komputer dibuang, peralatan elektronik kantor, perangkat hiburan elektronik, ponsel, televisi dan lemari es . Sampah elektronik (e-waste) adalah limbah yang berasal dan peralatan elektronik yang telah rusak, bekas dan tidak dipakai lagi oleh pemiliknya. Sampah elektronik merupakan jenis limbah yang pertumbuhannya paling tinggi tiap tahunnya Dalam setiap sampah elektronik
yang cukup drastis dan mengakibatkan limbah elektronik juga terus meningkat. Beberapa komponen peralatan listrik dan elektronik bekas maupun limbahnya (e-waste) membutuhkan pengelolaan yang memenuhi syarat, karena mengandung bahan berbahaya dan beracun (B3) [1]. Penelitian dan pengembangan dalam bidang elektronika khususunya komponen elektronika masih terus dikembangkan sampai saat ini. Kemajuan dalam teknologi fabrikasi divais dan teknologi pengujian sangat mendukung terhadap perkembangan teknologi semikonduktor ini. Pengembangan teknologi di Indonesia ini masih terkendala oleh terbatasnya biaya riset yang tersedia. Indonesia merupakan sebuah negara yang kaya akan sumber daya alamnya tetapi pemanfaatannya masih belum optimal. Hal ini kurang menguntungkan bagi Indonesia karena untuk memenuhi kebutuhan
beberapa komponen elektronika masih
mengimpor dari negara lain. Kapasitor, termistor, resistor dan beberapa lainnya termasuk salah satu komponen yang masih diimpor. Oleh karena itu dalam penelitian dilakukan suatu perekayasaan dan pembuatan komponen elektronika yang berasal dari logam bekas aluminium dan kuningan untuk menghasilkan suatu komponen elektronika yang murah dan teruji kualitasnya. Beberapa komponen elektronika seperti kapasitor selalu digunakan pada beberapa peralatan listrik rumah tangga sehingga kebutuhannya sangat besar.
Kapasitor pada umumnya digunakan pada rangkaian elektronika. Selain itu kapasitor merupakan salah satu piranti elektronika yang penting dalam dunia elektronika. Jika melihat fakta, tidak ada elektronika yang dirangkai tanpa menggunakan kapasitor. meskipun secara fisik kapasitor tidak dipakai dalam suatu peralatan elektronika, tetapi sifat kapasitas tetap hadir pada piranti-piranti yang lain, baik itu pada resistor, dioda, ataupun transistor. Oleh sebab itu jika kita ingin menguasai teknologi modern yang selalu berkaitan dengan elektronika maka pemahaman akan kapasitas perlu dikuasai dan ditingkatkan . Secara umum kapasitor terdiri dari dua elektroda yang terbuat dari konduktor, dan bahan dielektrik yang berada di antara kedua elektroda itu. Untuk mempelajari sifat kapasitor tersebut diperlukan model ideal yang sederhana. Di dalam model ini bahan dielektrik dianggap bersifat isolator ideal, yakni tidak memiliki daya hantar listrik sama sekali. Dalam istilah ilmiahnya konduktivitas listrik suatu isolator ideal sama dengan nol. Muatan listrik tidak dapat menyeberangi bahan isolator ini [2]. Seiring
dengan berkembang pesatnya industri
elektronika, maka perkembangan kapasitor juga tumbuh dengan cepat, Banyak industri di dunia yang mengembangkan kapasitor sehingga dari
tahun ke tahun kapasitor yang dibuat semakin kecil dalam hal ukuran namun semakin besar kapasitas dan kemampuannya. Super-kapasitor dan ultra-kapasitor disiapkan untuk mengantikan penggunaan baterai dalam kendaraan dengan penggerak listrik [3]. Mengingat aluminium dan kuningan mempunyai sifat tahan korosi, ringan dan mudah didapat sehingga memungkinkan untuk dijadikan bahan baku sebagai elektroda yang terbuat dari konduktor dalam pembuatan kapasitor. Hasil dari penelitian ini bisa dijadikan sebagai referensi tentang pembuatan kapasitor dengan memanfaatkan limbah logam bekas menjadi material kapasitor.
Teori
Kapasitor adalah komponen elektronika yang digunakan untuk menyimpan muatan listrik dalam jangka waktu tertentu. Seperti sebuah baterai, kapasitor juga digunakan untuk menyimpan energi listrik hanya saja proses penyimpanan energi listrik pada kapasitor berbeda dengan proses penyimpanan energi listrik pada baterai. Di dalam kapasitor juga terdapat 2 buah terminal sama seperti baterai. Di dalam baterai terjadi reaksi kimia yang akan menyebabkan salah satu terminal menghasilkan elektron dan terminal yang lainnya menyerap elektron , sehingga terjadilah aliran muatan listrik. Sebuah kapasitor jauh lebih sederhana dibandingkan dengan baterai, kapasitor tidak menghasilkan elektron, tetapi kapasitor menyimpan muatan listrik. Di dalam kapasitor terdiri dari 2 buah terminal atau sering disebut lempeng konduktor dan bahan dielektrik yang disisipkan di antara kedua lempeng konduktor. Dielektrik adalah bahan isolator yang dapat digunakan untuk meningkatkan kapasitas sebuah kapasitor. Kapasitor sederhana dapat dengan mudah dibuat dengan menggunakan 2 buah lempengan aluminium dan selembar kertas [4].
Sebuah kapasitor dalam kondisi tidak diisi muatan listrik, maka pada kedua lempeng konduktornya tidak akan ada muatan listrik. Selama proses pengisian kapasitor, sebuah muatan listrik dipindahkan dari satu konduktor ke konduktor lainnya dan memberikan muatan positif pada salah satu lempeng konduktor dan muatan negatif pada lempeng konduktor lainnya. Contoh sederhana sebuah kapasitor dapat dibuat dari 2 lempengan konduktor dengan luas permukaan yang sama (A), yang dipasangkan paralel satu dengan lainnya dan terpisah pada jarak d seperti pada gambar berikut ini.
Gambar 1. Kapasitor sederhana
Melalui percobaan banyaknya muatan (Q) yang disimpan dalam sebuah kapasitor besarnya linier dan proporsioal terhadap beda tegangan pada kedua lempeng konduktor kapasitor atau secara matematis dapat ditulis :
(1)
(2)
Dimana :
Q : muatan listrik (satuan Coulomb ( C ) ) C : kapasitas kapasitor (satuan Farrad (F))
ΔV : Beda tegangan listrik pada kedua lempeng konduktor (satuan Volt (V))
Bila ada 2 buah pelat konduktor dengan luas permukaan yang sama yaitu A yang dipisahkan pada jarak d, kemudian lempeng konduktor bagian atas diberi muatan +Q dan lempeng konduktor bagian bawah diberi muatan –Q, maka medan muatan pada 2 buah lempeng konduktor tersebut dapat digambarkan sebagai berikut [5]
Gambar 2. Medan lstrik pada 2 lempeng konduktor
Dalam keadaan murni, logam bukan besi (timah putih, tembaga, nikel, aluminium) memiliki sifat yang sangat baik, namun untuk
meningkatkan kekuatannya diperlukan
tambahan logam sebagai unsur panduan. Ciri-ciri logam bukan besi adalah :
1. Daya tahan terhadap korosi yang tinggi 2. Daya hantar listrik yang baik
3. Mudah untuk dibentuk
Kebanyakan logam bukan besi tahan terhadap korosi (air atau kelembapan), misalnya : zat magnesium, tahan terhadap korosi dalam lingkungan udara bebas, akan tetapi di dalam air laut, ketahanan terhadap korosinya dibawah ketahanan baja biasa. Secara umum dapat
Tabel 1. Berat jenis dan titik cair logam
Logam Berat jenis (kg/m3) Titik cair (0C)
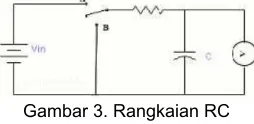
Pengecualian pada aluminium, pada permukannya terbentuk suatu lapisan oksida yang dapat melindungi logam aluminium tersebut dari korosi. Pada umumnya, logam non-besi mempunyai daya hantar listrik lebih baik dibandingkan dengan besi, sebagai contoh : tembaga mempunyai daya hantar listrik 5,3 kali lebih baik dibandingkan dengan besi, sedangkan aluminium 3,2 kali lebih baik [6]. Dalam gambar 3 tampak sebuah kapasitor yang dihubungkan seri dengan resistor dan dihubungkan pada sebuah sumber dc melalui sebuah sakelar. Pada saat sakelar dalam keadaan short, secara kontinyu kapasitor terisi muatan melalui resistor R hingga tegangannya sebesar E volt. Tegangan kapasitor saat diisi muatan listrik tampak seperti dalam gambar 4. Waktu yang diperlukan untuk mengisi kapasitor dari keaadaan kosong hingga 60 maksimum, yang dalam hal ini 60 dari E atau 0,6 E, dikenal sebagai konstanta waktu (time-constant)
rangkaian tersebut.
Gambar 3. Rangkaian RC
Bila kita perhatikan lagi gambar 3 apabila sekarang rangkaian dalam keadaan open, kapasitor tetap akan menyimpan energi dengan tegangan yang tetap sebesar E volt Apabila sakelar dihubungkan dengan ground
(a) (b) Gambar 4. Kurva pengisian dan pengosongan
Konstanta waktu pada pengisian dan
pengosongan kapasitor C melalui R selalu sama, yaitu sebesar :
T = C x R (3)
Dengan :
T = Konstanta Waktu ( s ) R = Resistansi (Ω ) C = Kapasitansi ( F )
Bahan dan Metode
Prinsipnya adalah substusi bahan penyusun kapasitor yang terdiri dari plat konduktor berupa aluminium dan kuningan serta bahan dielektrik berupa kertas. Substitusi dilakukan pada pengganti bahan dielektrik dengan sumber daya lokal dan perekat pada
kemasan menggunakan limbah plastik.
Pemilihan variabel dilakukan untuk mengetahui hubungan antar variabel terhadap kualitas produk yang dihasilkan. Variabel yang dipilih antara lain :
1. Variabel tetap : jenis bahan konduktor dan bahan dielektrik
2. Variabel bebas : Nilai T (waktu) didapatkan dari proses charge discharge
kapasitor, nilai kapasitansi (µF) dari kapasitor yang dibuat dan luas bahan penyusun
Peralatan yang digunakan pada penulisan ini adalah :
1. Capacitor Capasitance tester meter 2. Alat penggulung
3. Toolkit
4. Jangka sorong 5. Avo meter 6. Oscilloscope 7. Catu daya 8. Resistor 9. Project board
Bahan-bahan yang digunakan : 1. Aluminium bekas
2. Kuningan 3. Kertas 4. Minyak
5. Silinder rumah kapasitor
Perancangan pembuatan kapasitor disusun sesuai komposisi pada gambar 5. Untuk mendapatkan nilai kapasitansi kapasitor yang
telah dibuat berdasarkan variabel tetap dan variabel bebas yang telah ditentuka seperti diagram alir pada gambar 6.
Gambar 5. Perancangan pembuatan kapasitor
Gambar 6. Diagram alir pengujian nilai kapasitansi kapasitor
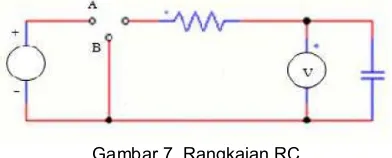
Setelah kapasitor hasil desain dan buatan sendiri telah jadi, maka untuk pengujian karakteristiknya, yaitu nilai kapasitansinya maka kapasitor tersebut disusun secara seri dengan resistor. Berikut gambar rangkaiannya:
Gambar 7. Rangkaian RC
Nilai T didapatkan dari proses charge discharge kapasitor. Siapkan stopwatch untuk mengetahui waktu yang ditempuh kapasitor saat proses charge discharge. Nyalakan stopwatch bersamaan dengan saklar switch pada posisi A.
Tekan stop pada stopwatch ketika tegangan sudah dalam keadaan steady atau sama dengan tegangan inputnya (Vin) yang ditandai dengan jarum pada avo meter analog berhenti. Sedangkan untuk proses discharge, pindahkan posisi switch pada posisi B. Bersamaan dengan itu, nyalakan stopwatch hingga jarum avo meter analog menunjukkan angka 0. Pengukuran dillakukan sebanyak 3 kali hingga didapatkan nilai ratanya. Setelah diperoleh nilai T rata-ratanya maka dapat dihitung nilai kapasitansinya menggunakan persamaan 3 yaitu T = C x R.
Hasil dan Pembahasan
Pada bab ini akan menguraikan secara rinci pengujian karakteristik kapasitor untuk beerbagai jenis bahan logam dan dielektrik bekas yang akan disajikan dengan data yang didapat untuk mendukung penulisan hasil dan pembahasannya. Seperti pada umumnya, kapasitor terdiri dari dua buah pelat material konduktif yang dipisahkan oleh lapisan dielektrik. Sebelum tahap pembuatan, bongkar terlebih dahulu kapasitor yang sudah ada, kemudian amati bahan penyusun kapasitor dan ukur berapa panjang dan lebar pelat material konduktif sejajar tersebut sehingga didapatkan luasannya. Begitu juga ketebalan dari plat tersebut. Bahan yang digunakan untuk pelat sejajarnya adalah aluminium dan kuningan bekas karena mengacu pada bahan pelat sejajar yang sebelumnya yaitu menggunakan aluminium dan kuningan yang tipis. Komposisi kapasitor yang dibuat seperti tabel 1 dibawah inii.
Tabel 2. Data komposisi bahan yang digunakan No Bahan
konduktor dielektriBahan k
Panjang
(cm) Lebar (cm)
1 Aluminium - aluminium
Kertas 65 6
2 Aluminium
- kuningan Kertas 65 6 3 Kuningan –
kuningan Kertas 65 6
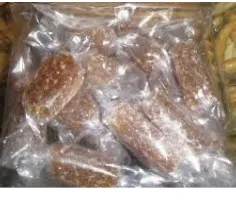
Sedangkan bahan yang digunakan sebagai dielektriknya adalah kertas bekas. Hal itu mengacu pada bahan dielektrik aslinya yaitu kertas tipis yang bisa menyerap minyak. Ketebalan dari kertas yang digunakan adalah sekitar 0,1mm. Pada gambar dibawah ini memperlihatkan bahan – bahan penyusun kapasitor yang akan dibuat.
Gambar 8. Aluminium bekas setelah dipotong dan sudah dirempelas (A), bahan kuningan (B), kertas
yang digunakan sebagai bahan dielektrik (C)
Antar plat tidak boleh saling bersentuhan sehingga ukuran kertas yang sebagai dielektrik ukurannya harus lebih panjang dan lebar dari plat plat yang digunakan. Kemudian pasangkan timah atau bisa juga tembaga pada masing-masing plat sejajarnya. Gulung serapat mungkin tumpukan pelat sejajar dan kertas hingga membentuk silinder dimana posisi pelat berada pada bagian bawah dan kertas berada pada posisi atas, beri perekat agar gulungan tersebut tidak terlepas. Bentuk perancangan kapasitor yang dibuat seperti gambar 9.
Gambar 9. Gulungan kapasitor dari berbagai bahan. KK = kuningan-kuningan, AK = aluminium-kuningan,
AA = aluminium-aluminium
Kapasitor dilakukan percobaan dengan merangkai kapasitor gulungan sendiri dirangkai seri dengan resistor seperti pada gambar 7. Berikut tabel hasil pengukuran waktu pada saat proses charge discharge kapasitor yang didapat. Untuk bahan konduktor yaitu aluminium-aluminium didapatkan waktu charge dan
Tabel 3. Data pengukuran waktu kapasitor dengan konduktor aluminium – aluminium
No Vdc (Volt) R (Ω) T (s)
Charge Discharge 1 7,0 1000 23,32 30,68 2 7,0 1000 20,53 28,72 3 7,0 1000 24,40 27,82 Rata - rata 22,75 25,91 29,07
Untuk pengujian kapasitor dengan bahan aluminium-aluminium yang dirangkai seri dengan resistor 1000 Ω dan diberi tegangan 7,0 Volt DC diperoleh T rata-rata = 25,91 s. Setelah diperoleh nilai T maka dapat dihitung nilai kapasitansinya yaitu :
T = C x R ;
= 0,02591 F = 25,91 µF
Sedangkan dari bahan lainnya yaitu aluminium-kuningan didapatkan waktu charge dan
discharge yang ditunjukkan tabel berikut ini :
Tabel 4. Data pengukuran waktu kapasitor dengan konduktor aluminium – kuningan
No Vdc (Volt) R (Ω) T (s)
Charge Discharge 1 7,0 1000 13,1 15,81 2 7,0 1000 11,08 17,94 3 7,0 1000 10,84 9,91
Rata – rata 11,67 13,11 14,55
T = C x R ;
= 0,01311 F = 13,11 µF
Dan kapasitor yang terakhir dengan bahan platnya kuningan-kuningan didapatkan waktu
charge dan discharge yang ditunjukkan tabel berikut ini :
Tabel 5. Data pengukuran waktu kapasitor dengan konduktor aluminium – kuningan
No Vdc (Volt) R (Ω) T (s)
Charge Discharge 1 7,0 1000 7,62 5,33 2 7,0 1000 6,54 6,58 3 7,0 1000 5,36 5,44 Rata – rata 6,50 6,14 5,78
T = C x R ;
= 0,00614 F = 6,14 µF
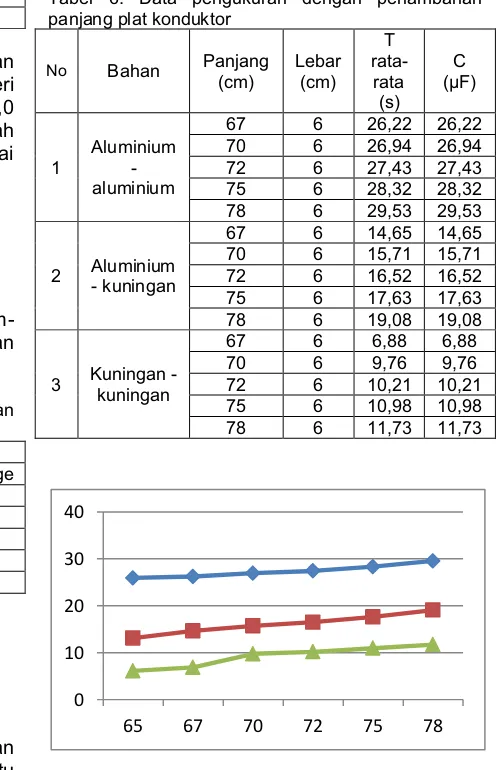
Penambahan luas penampang dengan komposisi plat yang sama dan jenis bahan dielektrik yang sama dapat meningkatkan nilai kapasitansi seperti ditunjukkan pada tabel 6 dibawah ini
Tabel 6. Data pengukuran dengan penambahan panjang plat konduktor
No Bahan Panjang (cm) Lebar (cm) T
rata-rata (s)
C (µF)
1 Aluminium - aluminium
67 6 26,22 26,22 70 6 26,94 26,94 72 6 27,43 27,43 75 6 28,32 28,32 78 6 29,53 29,53
2 Aluminium - kuningan
67 6 14,65 14,65 70 6 15,71 15,71 72 6 16,52 16,52 75 6 17,63 17,63 78 6 19,08 19,08
3 Kuningan - kuningan
67 6 6,88 6,88 70 6 9,76 9,76 72 6 10,21 10,21 75 6 10,98 10,98 78 6 11,73 11,73
Grafik 1. Penambahan panjang konduktor terhadap nilai kapasitans kapasitor yang dibuat
Kesimpulan
Kapasitor dengan bahan plat Aluminium- Aluminium merupakan kapasitor yang memiliki nilai kapasitansi yang paling besar dari komposisi kapasitor yang dibuat yaitu 25,91 µF dengan ukuran luas penampang plat yang sama dan jenis bahan dielektrik yang sama. Setiap penambahan panjang plat (p1) yang awalnya 65 cm menjadi 78 cm, nilai kapasitansi kapasitor semakin naik, yaitu 25,91 µF menjadi 29,53µF.
Daftar Pustaka
[1]. Leonardo, Sampah Elektronik ( e-Waste ) di Indonesia, wordpress.com [diakses November 5, 2014]
0 10 20 30 40
65 67 70 72 75 78
[2]. Sambas dan Aceng, Analisis Pengisian dan Pengosongan Kapasitor Dengan Metode Regresi Linier, Jurusan Fisika Fakultas Sains Dan Teknologi UIN Sunan Gnung Djati Bandung, 2011
[3]. Drs. Bisman P,M.Eng.Sc, Rancangan Kapasitansi Meter Digital, Sumatera Utara:
Fakultas Matematika dan Ilmu
Pengetahuan Alam Jurusan Fisika
Universitas Sumatera Utara, 2003.
[4]. Budiyanto, J, Fisika Untuk SMA/MA kelas XII. Pusat Perbukuan Departemen Pendidikan Nasional, 97-105, 2010
[5]. Djukarno, ayo kupas tuntas kapasitor, wordpress.com [diakses 6 Maret 2012] [6]. Manuntun Manurung dan Irma Fitria
Ayuningtyas. 2010. Jurnal Kimia 4 :
Kandungan Aluminium Dalam Kaleng Bekas Dan Pemanfaatannya Dalam Pembuatan Tawas. Bali, Bukit Jimbaran: Jurusan Kimia FMIPA Universitas Udayana, 2010
Peningkatan Nilai Ekonomi dan Penerapan Strategi Pemasaran
Berbasis IT Limbah Buah Pala Di Pekon Tanjung Anom, Kecamatan
Kota Agung Timur, KabupatenTanggamus
Increasing Economic Value and Implementing Marketing Strategy Base on
Information Technology of Nutmeg Waste In Pekon Tanjung Anom, Kota
Agung Timur District, Tanggamus Regency
Muhammad Saputra
1, Cahyani Pratisti
1Jurusan Manajemen, Fakultas Ekonomi dan Bisnis, ibi Darmajaya
[email protected]; [email protected]
Diterima 28 November 2016, direvisi 1 Januari 2017, diterbitkan 28 Mei 2017
ABSTRAK
Peningkatan nilai ekonomi dan penerapan strategi pemasaran berbasis IT saat ini sangat penting guna menyongsong era industry kreatif yang sangat membutuhkan inovasi-inovasi dengan memanfaatkan sumberdaya alam yang tersedia secara terpadu sehingga memiliki manfaat bagi masyarakat sekitar. Penelitian ini dilakukan di Pekon Tanjung Anom, Kecamatan Kota Agung Timur, Kabupaten Tanggamus dengan menggunakan metode deskriptif. Tujuan Penelitian ini memanfaatkan limbah buah pala yaitu kulit dan daging dari buah pala yang terbuang. Saat ini masyarakat hanya mendapatkan keuntungan dengan menjual biji dari buah pala yang tumbuh di pekon Tanjung Anom. Limbah kulit dan daging dari buah pala diolah menjadi aneka produk oleh-oleh yang memiliki nilai ekonomi kemudian dipasarkan menggunakan media internet, dan hasil dari penjualan produk olahan limbah buah pala dapat menjadi pendapatan tambahan masyarakat di Pekon Tanjung Anom.
Kata kunci : Nilai Ekonomi, Strategi Pemasaran, Buah Pala
ABSTRACT
Nowaday, increasing economic value and implementing marketing strategy base on Technology Information is very important in order to welcoming creative industry era that desperately needs innovations by utilizing integrated natural resources so that it has benefits for the surrounding communities. This research was conducted in Pekon Tanjung Anom, Kota Agung Timur District, Tanggamus Regency used descriptive method. The purpose of this study which utilizes waste nutmeg skin and flesh. At present, the communities only get advantage from selling the seed of nutmeg are grown in pekon Tanjung Anom. The Skin and flesh of nutmeg waste processed into various products that have economic value and then marketed by internet. The proceeds from selling of refined nutmeg waste products can be extra income for communities.
Keywords: Economic Value, Marketing Strategy, Nutmeg
Pendahuluan
Sumber daya alam (SDA) adalah segala sesuatu yang ada di alam yang dapat digunakan untuk memenuhi kebutuhan hidup manusia, yang tergolong didalamnya tidak hanya komponen biotik maupun komponen abiotik.
Pada umumnya, sumber daya alam
berdasarkan sifatnya digolongkan menjadi sumber daya alam yang dapat diperbaharui dan sumber daya alam tidak dapat diperbaharui.(1).
Pemanfaatan sumber daya alam harus dilakukan secara terpadu dengan menjalankan
prinsip menjaga produktifitas dan
memperhatikan kelestarian lingkungan. Peningkatan nilai ekonomi suatu produk yang dihasilkan dari sumber daya alam mutlak perlu dilakukan, dengan menciptakan nilai tambah
(Value Added) yang berdampak langsung terhadap pemasaran dan penjualan. Saat ini penggunaan IT untuk pemasaran dan penjualan produk dalam beberapa tahun terakhir berkembang dengan pesatnya(2).Adanya media internet proses pemasaran dan penjualan produk dapat dilakukan kapan saja tanpa terikat ruang dan waktu(3).
Pemanfaatan sumber daya alam dengan melakukan peningkatan nilai ekonomi serta penerapan strategi pamasaran berbasis IT sangat penting guna menyongsong era industri kreatif yang sangat membutuhkan inovasi-inovasi dengan memanfaatkan sumber daya alam secara terpadu sehingga memiliki manfaat bagi masyarakat sekitar.
Nilai Ekonomi adalah keseluruhan barang dan jasa yang dihasilkan suatu objek dengan memberikan manfaat berupa pendapatan.(4).
Salah satu cara meningkatkan nilai ekonomi suatu produk adalah dengan melakukan sebuah Inovasi. Inovasi diartikan sebagai implementasi praktis dari sebuah gagasan ke dalam produk atau proses baru. Inovasi bersumber dari individu, perusahaan, riset di universitas, maupun di laboratorium(5).
Inovasi memiliki lima karakteristik yang dapat mempengaruhi keputusan terhadap pengadopsian, meliputi: Pertama keunggulan Relatif (relative advantage) adalah derajat dimana suatu inovasi dianggap lebih baik atau unggul dari yang pernah ada sebelumnya. Kedua Kompatibilitas (compatibility) adalah derajat dimana inovasi tersebut dianggap konsisten dengan nilai-nilai yang berlaku. Ketiga adalah pengalaman masa lalu. Keempat adalah kebutuhan pengadopsi. Kelima adalah kerumitan (complexity) dimana inovasi dianggap sebagai suatu yang sulit untuk dipahami dan digunakan(6).
Pemasaran adalah proses perencanaan dan eksekusi dari kegiatan pembentukan konsep, penetapan harga, penetapan strategi promosi dan strategi distribusi dari ide-ide, produk dan jasa yang ditawarkan oleh suatu perusahaan untuk menciptakan suatu pertukaran yang memuaskan baik bagi pelanggan maupun perusahaan, sesuai dengan tujuan pemasaran yang telah ditetapkan (7).
E-marketing (electronic marketing) merupakan suatu proses pemasaran yang menggunakan teknologi komunikasi elektronik, khususnya internet. Internet adalah jaringan fisik yang menhubungkan komputer-komputer di seluruh dunia, terdiri dari infrastruktur jaringan
server dan jaringan komunikasi yang saling berhubungan sehingga dapat digunakan untuk menyimpan dan menyampaikan informasi. E-marketing merupakan bagian dari e-business
(electronic business). Definisi e-business sendiri
merupakan segala kegiatan yang dapat mendukung keseluruhan proses bisnis perusahaan, yang dilakukan melalui media elektronik seperti e-commerce, e-CRM (Customer Relationship Management), e-SCM (Supply Chain Management), e-procurement,
dan termasuk e-marketing di dalamnya (8).
Kota Agung Timur merupakan sebuah kecamatan yang terletak di Kabupaten Tanggamus dengan luas wilayah 73,33 km atau 1,58% dari total luas kabupaten Tanggamus(9). Timur yang memiliki potensi hasil perkebunan berupa buah pala.
Buah Pala atau yang dikenal dengan nama latin (Myristica fragrans) merupakan salah satu jenis rempah-rempah. Dalam setiap 100 g daging buah pala terkandung jumlah kalori (42 kal); protein (0,30 g); lemak (0,20 g); karbohidrat (10,90 g); kalsium (32 mg); fosfor (24 mg); besi (1,50 mg); vitamin A (29,50 IU); vitamin C (22 mg); dan air (88,10 g)(10).
Buah pala memiliki banyak manfaat. Beberapa hasil penelitian sebelumnya menunjukkan bahwa buah pala biasa digunakan sebagai obat diare, kembung, serta meningkatkan daya cerna, dan selera makan(11). Buah Pala juga berkhasiat sebagai korigensia,
karminatif, mengatasi kejang lambung, pegal linu, susah tidur, sariawan mulut(12), serta menghilangkan rasa mual, karena memiliki sifat
antiemetik yaitu senyawa kimia yang bermanfaat untuk mengatasi rasa mual(13). Buah pala juga dapat diolah menjadi aneka produk makanan seperti: manisan buah pala, sirup buah pala dan selai buah pala.(14)
Saat ini masyarakat pekon Tanjung Anom Kecamatan Kota Agung Timur Kabupaten Tanggamus hanya memanfaatkan buah pala dengan mengambil biji buah pala untuk dijual, sedangkan kulit dan daging buahnya menjadi limbah yang tidak terpakai.
![Figure 1. Annual GDP of Indonesia (Million Rupiah) Source : Food and Agriculture Organization ot The United nations [40]](https://thumb-ap.123doks.com/thumbv2/123dok/3993284.1936704/8.612.317.506.614.754/figure-annual-indonesia-million-rupiah-source-agriculture-organization.webp)