A SINGLE CLASSIFIER USING PRINCIPAL COMPONENTS VS MULTI-CLASSIFIER
SYSTEM : IN LANDUSE-LANDCOVER CLASSIFICATION OF WORLDVIEW-2 SENSOR
DATA
Laxmi Narayana Eetia,∗, Krishna Mohan Buddhirajua, Avik Bhattacharyaa a
Centre of Studies in Resources Engineering, Indian Institute of Technology Bombay, Mumbai 400076, India (laxmi.narayana,bkmohan,avikb)@iitb.ac.in
KEY WORDS:Loss in PCA, Multi-Classifier System, High Spectral-dimension, WorldView-2 image, principal components
ABSTRACT:
In remote sensing community, Principal Component Analysis (PCA) is widely utilized for dimensionality reduction in order to deal with high spectral-dimension data. However, dimensionality reduction through PCA results in loss of some spectral information. Analysis of an Earth-scene, based on first few principal component bands/channels, introduces error in classification, particularly since the dimensionality reduction in PCA does not consider accuracy of classification as a requirement. The present research work explores a different approach called Multi-Classifier System (MCS)/Ensemble classification to analyse high spectral-dimension satellite remote sensing data of WorldView-2 sensor. It examines the utility of MCS in landuse-landcover (LULC) classification without compromising any channel i.e. avoiding loss of information by utilizing all of the available spectral channels. It also presents a comparative study of classification results obtained by using only principal components by a single classifier and using all the original spectral channels in MCS. Comparative study of the classification results in the present work, demonstrates that utilizing all channels in MCS of five Artificial Neural Network classifiers outperforms a single Artificial Neural Network classifier that uses only first three principal components for classification process.
1. INTRODUCTION
Availability of more than one spectral channel in a satellite re-mote sensing dataset enables us to study and analyse various nat-ural and artificial phenomena by extracting information through image analysis techniques. However, a large number of chan-nels create high computational demand and also demand a large number of representative samples to train a classifier. Extract-ing enough number of representative samples/pixels is difficult in high dimensional data. In addition, there is redundant informa-tion found in more than one spectral channel which further adds to unnecessary computational demand. In such cases dimension-ality reduction methods are employed to resolve the issues. Principal Component Analysis (PCA) is widely used as dimen-sionality reduction technique in literature (Jolliffe, 2005, Gon-zalez and Woods, 2002). It condenses most of the information spread across many channels into fewer number of channels. Vari-ance of a data set, denoted by eigen values, decreases from first principal component to last component i.e. first principal compo-nent contains maximum amount of total variance of the data set (Byrne et al., 1980, Gonzalez and Woods, 2002). Last few com-ponents contain less variance and hence dropped in classification process. Therefore, by condensing higher number of channels into fewer number it reduces computational demand and possibly improves performance. In literature, application of PCA can be found in fields ranging from landuse-landcover mapping to face recognition (Byrne et al., 1980, Richards, 1984, Siljestrom Ribed and Moreno L´opez, 1995, Li et al., 2008). Though PCA helps in reducing computational demands and avoids the need for larger number of representative samples, it should be noted that lower order components or components with small variance do have some discriminating information leading to loss of information (Geiger and Kubin, 2012).
Having noted that there will be loss of information by discard-ing some of the bands directly or through some transformation
∗Corresponding author
like PCA, it is also true that it is difficult to estimate an unbiased covariance matrix without sufficiently large number of training samples, when there are large number of channels (Li et al., 2008, Chen, 2002, Karamizadeh et al., 2013). Naturally, the question arises, is there any other way that would enable us to avoid use of PCA dimensionality reduction technique and utilize all of the available channels for classification purpose?. We explore MCS in this context, each classifier working with the number of bands as the number of principal components, with the difference that subsets of input bands are chosen without any transformation. A group of more than one classifier employed for classification task is called an MCS or an ensemble (Oza and Tumer, 2008). Each classifier in this group is called an ensemble member. Clas-sifiers can be heterogeneous or homogeneous depending upon the need or information available about input data. The members are made to make error at some input values, so that each member is different from others in identification of objects. The outputs from each of these members are combined by a voting method (Van Erp et al., 2002), for final decision in classification task. The ensemble approach is widely used to improve generaliza-tion performance. Applicageneraliza-tion and efficiency of MCS method in analysing remote sensing data can be found in (Giacinto et al., 2000, Han et al., 2012, Waske and Braun, 2009, Tumer and Ghosh, 1996).
In this paper, we investigate the utility of multi-classifier systems (MCS) in LULC classification of WorldView-2 sensor data with-out the need to perform dimensionality reduction. Since multiple classifiers are employed in MCS, available channels can be dis-tributed among these ensemble members. A comparative study is done between classification using principal components by a sin-gle classifier and classification through a multi-classifier system. In this work a multi-classifier system is made of five artificial neural network classifiers as members. The test image is from WorldView-2 sensor that has 8 spectral channels.
In the present work, MCS gives higher classification accuracies,
ISPRS Annals of the Photogrammetry, Remote Sensing and Spatial Information Sciences, Volume II-8, 2014 ISPRS Technical Commission VIII Symposium, 09 – 12 December 2014, Hyderabad, India
This contribution has been peer-reviewed. The double-blind peer-review was conducted on the basis of the full paper.
compared to conventional method of data reduction by PCA and then using first three principal components for classification. First three components are chosen based on the percentage of total variance they contain and to avoid redundancy. Overall clas-sification accuracy and kappa coefficient produced by a single classifier utilizing principal components is 77.30 per cent and 0.73 respectively. Whereas, overall classification accuracy and kappa coefficient obtained through MCS, utilizing all channels, are 84.99 per cent and 0.82 respectively.
2. DATASET
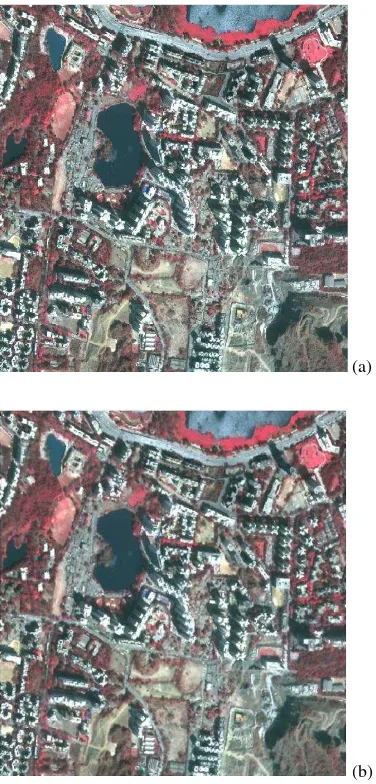
Test Image in this work covers a small region in Mumbai, India. The size of the image is 615x624 pixels. It covers nine differ-ent landuse-landcover categories. The scene is acquired through WorldView-2 sensor. Spatial resolution is 1.84m. It captures scene in 8 multispectral channels. Figure 1 shows the false colour composite of the scene. The spectral ranges of sensor are shown in Table 1.
(a)
(b) Figure 1: False colour composite of test image (a) Original (b) Smoothened by Wiener filter
3. METHODOLOGY
The procedure followed in data reduction, training, classifica-tion and accuracy estimaclassifica-tion are menclassifica-tioned in the following
sub-Band 1 Coastal 400-450nm Band 2 Blue 450-510nm Band 3 Green 510-580nm Band 4 Yellow 585-625nm Band 5 Red 630-690nm Band 6 Red Edge 705-745nm Band 7 Near IR-1 770-895nm Band 8 Near IR-2 860-900nm Table 1: Spectral ranges in WorldView-2 sensor sections. For training purposes a total of 6400 representative sam-ples/pixels are used and for evaluation a total of 1846 pixels test samples are used. The test image is smoothened by Wiener fil-ter (Lim, 1990) before extracting representative/test samples and further analysis. The Wiener filter is adaptive in nature, tailoring itself to the local image variance. Where the variance is large, it performs little smoothing. Where the variance is small, it per-forms more smoothing (Wiener, 1949). This approach often pro-duces better results than linear filtering. The adaptive filter is more selective than a comparable linear filter, preserving edges and other high-frequency parts of an image. Artificial Neural Network classifiers are used in this work for classifying the image shown in Figure 1(b).Accuracy evaluation measures are in terms of overall accuracy and kappa coefficient (Richards and Richards, 1999).
3.1 Classification by single classifier using principal compo-nents
A variance-covariance based PCA is applied on 8 band test image of WorldView-2 to obtain principal components. The eigen val-ues computed for each of these components are shown in Table 2. First three components are chosen for further analysis based on the fact that these three contain 98.23 per cent of total in-formation. In literature, components that contain about 95 per cent are considered fair for image analysis requirements. Also, using more number of components defeats the purpose of di-mensionality reduction. So, we considered only the first three components. Training samples are extracted from these three components and are utilized for training an artificial neural net-work classifier. In this net-work, neural netnet-work is composed of three layers- input layer, hidden layer and output layer. Nodes in each of these layers are three, fourteen and nine respectively. A well trained neural network whose generalization performance was good is chosen for classification. For classification purpose first three principal components are fed into trained classifier as inputs. Output obtained is then evaluated using test samples and a confusion matrix is generated for computing overall accuracy and kappa coefficient.
Principal Components Eigen Values Variance Extracted
PC1 16421.7 80.17
PC2 3430.71 16.74
PC3 270.215 1.32
PC4 132.865 0.65
PC5 88.3779 0.43
PC6 69.5003 0.34
PC7 37.7038 0.19
PC8 31.3936 0.16
Table 2: Eigen values and percentage information in components
3.2 Classification using MCS
three channel-combination are constructed. The different combi-nations are shown in Table 3. Hence, entire information available through all the channels are utilized in MCS classifier.
Ensemble Member Channel Combination Member 1 Red+Green+Blue Member 2 Red Edge+Green+Blue Member 3 IR1+Green+Blue Member 4 IR2+Green+Blue Member 5 Coastal+Green+Yellow
Table 3: Combination of channels as input to ensemble members Different combinations of channels bring variety in input images for each of the ensemble members. These different combina-tions assure that ensemble members are trained differently and are independent in classification task to satisfy the diversity re-quirement in ensemble classification. Else if members behaved identically, the whole logic of ensemble classification stands null and void. The idea of constructing diverse members using differ-ent inputs is adopted in the presdiffer-ent work and can also be found in (Pavlo et al., 2009). Diversity among ensemble members can be inferred from Table 4. It lists individual member classification accuracy along with user’s and producer’s accuracy of individual category.
Category Member 1 Member 2 Member 3 Member 4 Member 5 Users Accuracy
Tree Canopy 93.17 93.40 99.55 100 88.01 Vegetation 97.27 100 93.75 100 96.39 Water 96.86 86.63 93.70 86.45 84.58 Built-up 67.66 70.18 66.83 67.33 51.74 Roadways 53.70 58.86 66.18 63.81 52.25 Hovel Rooftops 52.85 78 64.21 72.28 67.30
Shadows 100 100 100 100 98.95
Barren Land 73.68 100 98.34 98.30 41.02 Playground 61.70 71.87 68.86 68.04 63.88
Producers Accuracy
Tree Canopy 99.34 100 98.45 100 98.89
Vegetation 100 100 98.13 100 100
Water 100 100 100 100 95.52
Built-up 83.95 94.44 82.09 82.71 91.35 Roadways 53.05 56.70 56.09 59.14 49.39 Hovel Rooftops 33.63 35.45 55.45 54.54 31.81 Shadows 92.02 68.09 83.43 61.34 58.28 Barren Land 49.41 54.70 70 68.23 9.411
Playground 75.65 100 100 100 80
Overall Accuracy
83.42 84.83 87.16 85.80 76.16 Kappa Coefficient
0.80 0.82 0.84 0.83 0.71
Table 4: Individual member accuracy estimates Each ensemble member is fed with a particular channel combi-nation for training and classification purpose. The criteria for selecting a neural network and its architecture are similar as dis-cussed previously. Each of these members produces its own clas-sification output. For each pixel an ensemble member produces a value for each category. These values are considered as confi-dence measures. To combine these outputs and arrive at a final decision, the concept of confidence voting-sum rule (Van Erp et al., 2002) is adopted in the present paper. A pixel is assigned a category if total sum of confidence measure for a category ex-ceeds other category values. The classification output is evalu-ated in terms of overall accuracy and kappa coefficient using test samples.
4. RESULTS AND DISCUSSIONS
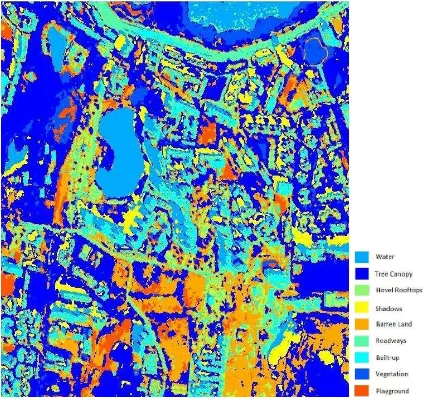
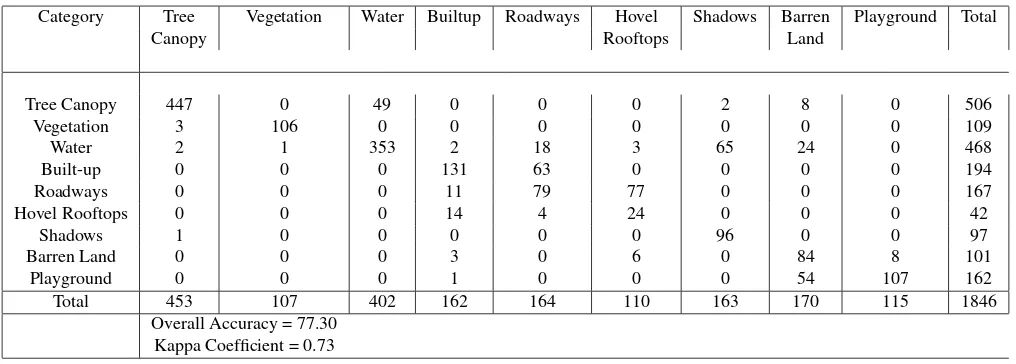
The present study is evaluated in terms of both qualitatively and quantitatively. The classification output obtained through single classifier using principal components and that obtained by using MCS are shown in Figure 2 and Figure 3. Confusion matrices are generated in each case for evaluation of classification result. These matrices are shown in Table 5-6.
It can be inferred by comparing Table 5 and Table 6 that in each individual category, accuracy has improved using MCS. Major
Figure 2: Classified output using single classifier
Figure 3: Classified output using ensemble(MCS)
improvements can be observed in water, roadways, hovel rooftops, shadows and considerable amount of improvement in other cate-gories. There is improvement of about 7.69 % in overall accuracy and 0.09 in kappa coefficient on comparison. The lower accuracy obtained in Table 5 might be attributed to loss of information by excluding lower order components in principal component anal-ysis. Where as in MCS because of all the available channels were used, it produced better accuracy.
5. CONCLUSIONS
This paper demonstrated the efficiency and utility of Multi Clas-sifier System (MCS) in dealing with high spectral-dimension re-mote sensing data such as WorldView-2 image. It has demon-strated that using MCS, one can achieve two benefits. Firstly, the need for dimensionality reduction can be avoided and secondly, higher classification accuracy can be achieved. In addition, the present paper shows that the usage of first few principal compo-nents could produce lower classification accuracy.
ISPRS Annals of the Photogrammetry, Remote Sensing and Spatial Information Sciences, Volume II-8, 2014 ISPRS Technical Commission VIII Symposium, 09 – 12 December 2014, Hyderabad, India
This contribution has been peer-reviewed. The double-blind peer-review was conducted on the basis of the full paper.
Tree Canopy 447 0 49 0 0 0 2 8 0 506
Total 453 107 402 162 164 110 163 170 115 1846
Overall Accuracy = 77.30 Kappa Coefficient = 0.73
Table 5: Confusion matrix generated by single classifier using first three principal components
Category Tree Vegetation Water Built-up Roadways Hovel Shadows Barren Playground Total
Canopy Rooftops Land
Total 453 107 402 162 164 110 163 170 115 1846
Overall Accuracy = 84.99 Kappa Coefficient = 0.82
Table 6: Confusion matrix generated by MCS
REFERENCES
Byrne, G., Crapper, P. and Mayo, K., 1980. Monitoring land-cover change by principal component analysis of multitemporal landsat data. Remote Sensing of Environment 10(3), pp. 175 – 184.
Chen, H., 2002. Principal component analysis with missing data and outliers. Electrical and Computer Engineering Department Rutgers University.
Geiger, B. C. and Kubin, G., 2012. Relative information loss in the pca. In: Information Theory Workshop (ITW), 2012 IEEE, IEEE, pp. 562–566.
Giacinto, G., Roli, F. and Bruzzone, L., 2000. Combination of neural and statistical algorithms for supervised classification of remote-sensing images. Pattern Recognition Letters 21(5), pp. 385–397.
Gonzalez, R. C. and Woods, R. E., 2002. Digital image process-ing.
Han, M., Zhu, X. and Yao, W., 2012. Remote sensing image classification based on neural network ensemble algorithm. Neu-rocomputing 78(1), pp. 133–138.
Jolliffe, I., 2005. Principal component analysis. Wiley Online Library.
Karamizadeh, S., Abdullah, S. M., Manaf, A. A., Zamani, M. and Hooman, A., 2013. An overview of principal component analysis. Journal of Signal and Information Processing 4, pp. 173. Li, C., Diao, Y., Ma, H. and Li, Y., 2008. A statistical pca method for face recognition. In: Intelligent Information Technology Ap-plication, 2008. IITA’08. Second International Symposium on, Vol. 3, IEEE, pp. 376–380.
Lim, J. S., 1990. Two-dimensional signal and image processing. Englewood Cliffs, NJ, Prentice Hall, 1990, 710 p.
Oza, N. C. and Tumer, K., 2008. Classifier ensembles: Select real-world applications. Information Fusion 9(1), pp. 4–20. Pavlo, A., Paulson, E., Rasin, A., Abadi, D. J., DeWitt, D. J., Madden, S. and Stonebraker, M., 2009. A comparison of ap-proaches to large-scale data analysis. In: Proceedings of the 2009 ACM SIGMOD International Conference on Management of data, ACM, pp. 165–178.
Richards, J., 1984. Thematic mapping from multitemporal im-age data using the principal components transformation. Remote Sensing of Environment 16(1), pp. 35–46.
Richards, J. A. and Richards, J., 1999. Remote sensing digital image analysis. Vol. 3, Springer.
Siljestrom Ribed, P. and Moreno L´opez, A., 1995. Moni-toring burnt areas by principal components analysis of multi-temporal tm data. International Journal of Remote Sensing 16(9), pp. 1577–1587.
Tumer, K. and Ghosh, J., 1996. Analysis of decision bound-aries in linearly combined neural classifiers. Pattern Recognition 29(2), pp. 341–348.
Van Erp, M., Vuurpijl, L. and Schomaker, L., 2002. An overview and comparison of voting methods for pattern recognition. In: Frontiers in Handwriting Recognition, 2002. Proceedings. Eighth International Workshop on, IEEE, pp. 195–200.
Waske, B. and Braun, M., 2009. Classifier ensembles for land cover mapping using multitemporal sar imagery. ISPRS Journal of Photogrammetry and Remote Sensing 64(5), pp. 450–457. Wiener, N., 1949. Extrapolation, interpolation, and smoothing of stationary time series. Vol. 2, MIT press Cambridge, MA.
ISPRS Annals of the Photogrammetry, Remote Sensing and Spatial Information Sciences, Volume II-8, 2014 ISPRS Technical Commission VIII Symposium, 09 – 12 December 2014, Hyderabad, India
This contribution has been peer-reviewed. The double-blind peer-review was conducted on the basis of the full paper.