_____________________________________________________ * [email protected]
REMOTE SENSING BASED METHANE EMISSION INVENTORY VIS-A-VIS RICE
CULTURAL TYPES OF SOUTH ASIA.
K R Manjunatha*, Revati Morea, Prakash Chauhana, Anjana Vyasc, Sushma Panigrahyb and J.S. Pariharb a
Space Applications Centre, Indian Space Research Organisation, Ahmedabad, India – ([email protected]) b
Formerly with Space Applications Centre, Indian Space Research Organisation, Ahmedabad,India c
CEPT University, Ahmedabad, India Commission VI, WG VI/4
KEY WORDS
:
Methane, IPCC, Rice cultural types, South-Asia, Remote Sensing, GISABSTRACT
Rice cultivation has been recognized as one of the major anthropogenic source for methane (CH4) emissions which is a microbial mediated anaerobic activity, mainly favoured by the flooded conditions in the rice fields. Information available on CH4 emission is limited, especially in a spatial domain, mainly because of the complexity involved in generating such data. The current approach demonstrates the use of secondary data sources available on the methane emission scaling factors, coupled with the information derived on rice cultural types and crop calendar. Methane emission from each type of rice field was firstly calculated by multiplying the emission factor by the corresponding cultivation area and length of cropping period. The values were then extrapolated over each country with respect to the rice area and crop duration for under each cultural type. The rice cultural type wise methane emission value for South Asia was derived by summation of individual emission values for the respective cultural type within each country. The total methane emission derived for South Asia region is (4.7817 Tg/yr). The mean methane emission estimates derived for each country are viz. India (3.3860 Tg/yr), Bangladesh (0.9136 Tg/yr), Pakistan (0.2675 Tg/yr), Sri Lanka (0.1073 Tg/yr) and Nepal (0.1074 Tg/yr). The derived methane emission estimates could be used to study the regional variations within the country and also to adopt the mitigation strategies to combat the high methane emission values within specific cultural type by means of altering the farming practise or water regime.
1. INTRODUCTION
Methane (CH4) emission from various sources is an important matter of concern because of its relatively fast increase and its per molecule, 60 times more effectivity than CO2 in causing global warming (IPCC, 2001). Rice cultivation has been recognized as one of the major anthropogenic source for CH4 emissions (Denier Van Der Gon, 2000; Li et al, 2002). Methane emission for the rice fields is a microbial mediated anaerobic activity, mainly favoured by the flooded conditions in the fields. Increase in rice production is suspected to meet the food demand for rising population which will lead to increase in methane emissions by 36 percent from rice fields in South and South-East Asia (US-EPA,2006). It has been reported that rice fields contribute about 10–15% to global CH4 emissions (Prather & Ehhalt, 2001),with an estimated annual emission of 50–100 Tg of methane (Reiner and Milkha 2000) and 33 to 40 Tg/yr(Yan et al, 2009). Flooded rice fields are the third largest source of agricultural emissions and contribute about 10 - 30% of the global methane arising from anaerobic decomposition of organic matter (Wahlen et al, 1989).
Various biotic and abiotic factors viz. temperature, humidity, soil organic matter, manure amendments, temperature, water status, soil characteristics, moisture content and microbial activity, availability of methanogenic substrate generated from organic residues, plant-borne material available during the cropping season affect the rate of methane emission from rice fields ( Cicerone et al, 1988, Ehhalt,1974,Wahlen et al,1989). Thus methane assessment with respect to rice cultural types is essential as it is influenced by the field conditions. The methane
emission assessment requires the information on rice growing areas. In present paper we demonstrate the use of geospatial rice datasets and adaption of cultural type specific emission co-efficient to derive country-level methane emission inventory for South Asian countries.
Owing to its role in food security, rice will play a major role in the methane emission and apparently in increasing trend of atmospheric methane concentration. Thus it is necessary to estimate the methane emission for rice fields in context to a strong inter-relationship between agriculture and climate change. Information available on CH4 emission is limited, especially in a spatial domain, mainly because of the complexity involved in generating such data. Also the ground sampling over the large extent of study area is not feasible in most of the countries. Considering significance of methane emission and current scenario, the present work aims to derive the spatial pattern of methane emission for major rice producing countries of South Asia by integrating a remote sensing and GIS approach.
2. METHODOLOGY
The detailed methane emission assessment with respect to the rice cultural types was carried out over India. The season-wise and state-wise sampling for in-situ measurements was conducted for total 471 sampling units over India by Manjunath
et al, (2008). The total methane emission from the rice lands
was calculated by multiplying the rice area within a stratum by corresponding emission values and range of emissions (minimum and maximum) by using a Standard emission factors (SIFs) within a category, as suggested by the approach used earlier by Manjunath et al, (2008).
2.3 Analysis approach: The methane emission from rice fields is directly proportional to area under the rice cultural type and total crop duration. Earlier allocation of areas to rice cultural types were allocated on the basis statistical data for harvested rice area or country specific reports to calculate the methane emission values (Yan et al,2009; Gupta et al,2008; IPCC, 1996).The statistical data has its own limitations as the timely procurement of data involves a labour n time cost. Application of the remote sensing derived information on rice croplands will provide a valuable input for CH4 emission studies. The current approach demonstrates the use of secondary data sources available on the methane emission scaling factors, coupled with the information derived on rice cultural types and crop calendar using a remote sensing and GIS data. The rice area within a country was stratified into the IPCC compliance rice cultural types with potential environment for methane emission viz. wet continuous irrigated, intermittent flooded, flood prone, drought prone, deep water. The information on the total duration of rice crop was derived from the remote sensing based rice crop calendar (Figure 1).
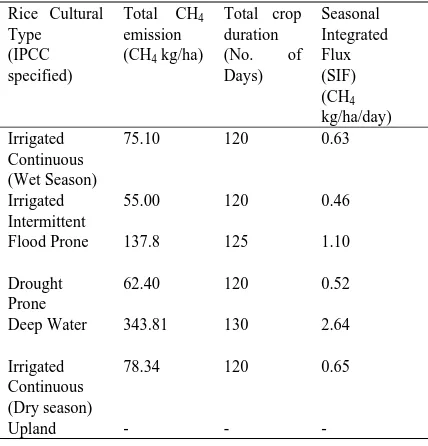
Table 1. Standard (CH4) emission factors kg/ha/day with respect to IPCC specified rice cultural types (Calculated from Indian methane emission inventory, Manjunath et al, (2006)
Rice Cultural
Earlier a detailed methane emission assessment was carried out over Indian region, which involved the close chamber sampling techniques for the CH4 emission measurements (Manjunath et
al,2006). In present study the average methane emission
coefficient derived over the India and standard emission factors as suggested by IPCC (Intergovernmental Panel on Climate Change) were used for the methane emission assessment.
The methane emission assessment for different countries is carried out by extrapolating the emission values from Indian rice paddies. The methane emission rates for each country were estimated based on the rice area derived using remote sensing data and the extrapolating the methane emission factors of Indian region. The quantification of the seasonal integrated flux (SIF) kg/ha/day for CH4 emission factor was deduced from the Indian CH4 emission factors (Table 1). Methane emission from each type of rice field was firstly calculated by multiplying the emission factor by the corresponding cultivation area and length of cropping period (Equation 1).
T(CH4)=SIF * A*D
(1)
where T(CH4) is the annual total CH4 emission from the rice
fields, SIFis the seasonal integrated flux(emission factor), A is the rice area in (ha), D is the total crop duration of the rice cultural type in a cropping season. The values were then extrapolated over each country with respect to the rice area and crop duration for under each cultural type. The remote sensing derived crop duration was used for calculating D. Present approach envisages the use of remote sensing and GIS techniques/derived input to assign/estimate the methane emission values over a large study area base on major factor of rice cultural type and duration.
Figure 1. Schematic methodology for the methane emission assessment
3. RESULTS AND DISCUSSIONS
This methodological approach demonstrates the gross CH4 emission estimation in timely and manner byutilization of the least ground truth data. In this study the remote sensing derived rice cultural type map and rice crop calendar is utilised effectively to assign the CH4 emission coefficients at country level. Country wise methane emission assessment for the major South Asian countries was derived.
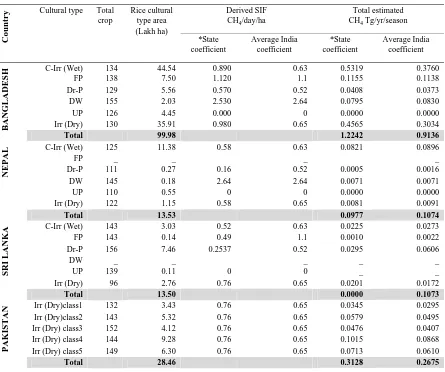
Table 2 (Appendix) shows the assignment of the state -wise coefficient to the neighbouring countries on the basis of similarity between the rice cultural type and cropping calendar as (Bangladesh: West Bengal, Nepal: Uttar Pradesh, Sri
Lanka: Tamil Nadu, Pakistan: average(Uttar Pradesh, Bihar, West Bengal ) and the total estimated CH4 from the respective cultural types. The total CH4 estimated using the state coefficient and by using average coefficient from India vary which explains the cultural type wise heterogeneity in the CH4 emissions as the state specific coefficient confines to specific
Rice crop calendar (curve fitting approach)
Calculation and Extrapolation of the methane emission values at country level for the other
countries
Rice cultural type wise CH4 emission factor
cultural type within a smaller region where as the average coefficient from India represents the CH4 estimate for a cultural
type for the larger extent of area (total country level).
The mean methane emission estimates derived for each country are viz. India (3.830 Tg/yr), Bangladesh (0.9136 Tg/yr), Pakistan (0.2675 Tg/yr), Sri Lanka (0.1073 Tg/yr) and Nepal (0.1074 Tg/yr). The rice cultural type wise methane emission value for South Asia was derived by summation of individual emission values for the respective cultural type within each country. It was observed that the continuous irrigated (wet season) accounts for the highest methane emission of (1.4414 Tg/yr) followed by drought prone (1.4282 Tg/yr), irrigated continuous (dry season) (0.8096 Tg/yr) and flood prone (0.7235 Tg/yr).The derived CH4 values were compared with the reported CH4 estimates at national level from the reference sources(Yan et al,2009; ALGAS;UNFCC). The total emission values for South Asia derived by using average methane emission coefficient from Indian region followed by crop duration wise extrapolation to the other countries was estimated as5.226 Tg/ha/yr as compared to the 8.205 CH4 Tg/ha/yr by Yan et.al (2009). Also the estimated CH4 values vary at country level (Table 3).The reason for disagreement may be due to the differences in the data used; the present utilises the farm level CH4 emission derived over Indian region and there extrapolation for other countries based on rice cultural type-wise similarity whereas the other studied have estimated the methane emission based on the experimental data assigned with respect to the agro-ecological zone and field parameters such as soil and organic amendments
Table 3. Country wise Total (CH4) emission Tg/ha/yr derived in the study and comparison with reference sources
Reference CH4 emission Estimated Total CH4 emission Tg/ha/yr Country Yan et ALGAS UNFCC
A B
India 5.876 4.110 3.830 3.830
Pakistan 0.430 0.526 __ 0.313 0.268
Banglade 1.548 0.767 __ 1.220 0.914
Nepal 0.194 __ __ 0.098 0.107
Sri 0.157 __ 0.042 0.073 0.107
Total 8.205 5.534 5..226
A- Deduced using region specific co-efficient B- Deduced using average co-efficient
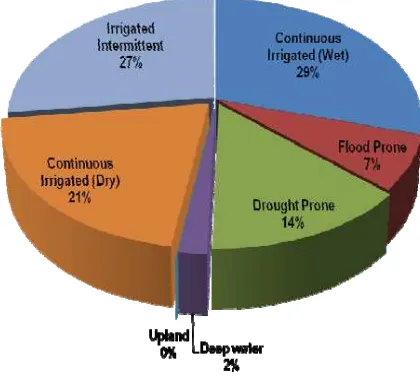
Amongst the rice cultural types the percent contribution from continuous irrigated (wet season) was the highest (29%) as continuous irrigated rice fields are the most favourable sites for methane emission cause of water logged conditions in the field.
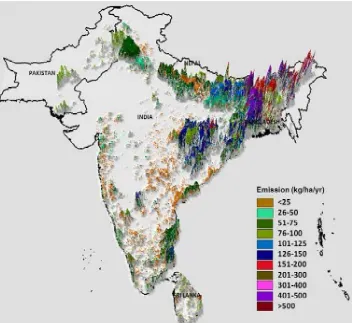
The CH4 emissions from irrigated intermittent cultural type was estimated as (27%).The irrigated intermittent rice cultural type was derived only for India and is referred here from the earlier studies (Manjunath et al,2006). (21%) CH4 emissions were estimated from the dry season irrigated continuous rice cultural type, followed by 14% from drought prone rice. The least was from the flood prone (7 %). (Figure.2).The CH4 emissions from the upland rice cultural type was absent as the upland fields exhibit non-water logged conditions and thus unfavourable for CH4 production (IPCC,1996).The CH4 emission from rice fields is uncertain and may vary considerably with the sensitive factors discussed in earlier section (section 1). Mainly the factors viz. soil organic matter and duration of the flooding, fertilizer amendments should be considered for detailed methane assessment to remove the uncertainties in the present methodology. Finally the methane emission image for the South and South Asian countries using remote sensing and GIS approach coupled with the derived (Figure 3, Appendix). The methodology gives a general overview of CH4 emission pattern over the South Asian countries using emission confidents from Indian region and has a scope to refine using the simulation models and soil, climate, field data for other countries.
Figure 2. Percent contribution n of CH4 emission with respect to IPCC compliance rice cultural types estimated for South Asia using remote sensing and GIS approach
4. CONCLUSIONS
The country specific CH4 emission rates with respect to the IPCC specified rice cultural types are derived in the present study. The approach demonstrates the integrated use of RS and GIS derived geospatial rice data base for rice area and rice crop calendar to extrapolate the CH4 emission values from India for the neighbouring countries. The derived methane emission estimates could be used to study the regional variations within the country and also to adopt the mitigation strategies to combat the high methane emission values within specific cultural type by means of altering the farming practise or water regime. The estimated methane emission values may be improved further if the regional methane flux values, ground truth data, and site specific conditions for manure amendments and organic matter data are considered at state or district level at the country level country.
ACKNOWLEDGEMENTS
Authors are thankful to Mr. A.S. Kiran Kumar Director, SAC for the encouragement and guidance given during the study. This work was carried out as part of Geo-spatial Characterization of Rice-ecosystems of South and Southeast Asia, project under PRACRITI-PRogrAmme on Climate change Research In Terrestrial environment, an Earth Observation Application Mission project of Indian Space Research Organisation
REFERENCES
Cicerone, R. J., and R. S. Oremland, 1988. Biogeochemical aspects of atmospheric methane, Global Biogeochemical
Denier Van Der Gon, H. 2000. Changes in CH4 emission from rice fields from 1960s to 1990s: 1. Impacts of modern rice technology. Global Biogeochemical Cycles, 1, 61– 72. Ehhalt, D. H., 1974 . The atmospheric cycle of methane, Tellus, 26,pp. 58-70.
Gupta, P.K Gupta V., Sharma C., Das,S. N., Purkait,N., Adhya, T. K., Patahak, H., Ramesh, R., Baruah, K.K., Venkatratnam, L., Singh,G., Iyer,C.S.P., 2008. Development of methane emission factors for Indian paddy fields and estimation of national methane budget. Chemosphere, doi:10.1016/
j.chemosphere.2008.09.042
IPCC, 1996. Agriculture. Revised 1996 IPCC Guidelines for National Greenhouse Gas Inventories: Reference Manual, Cahpter 4, pp 4.53-4.75.
Le Toan, T., Ribbes, F., Wang, L., Floury, N., Ding, K., Kong, J., 1997. Rice crop mapping and monitoring using ERS-1 data based on experiment and modelling results. IEEE Transactions
on Geoscience and Remote Sensing, 1, 41–56.
Li, C. S., Frolking, S., Xiao, X. M., Moore, B., Boles, S., Qiu, J. J., et al. 2005. Modelling impacts of farming management alternatives on CO2, CH4, and N2O emissions: A case study for water management of rice agriculture in China. Global
Biogeochemical Cycles, 3,pp. 19.
Manjunath K. R., Panigrahy, S., Kundan Kumari, T. K. Adhya, Parihar, J. S., 2006, Spatiotemporal modelling of methane flux from the rice fields of India using remote sensing and GIS.,
International Journal of Remote Sensing,27, 4701-4707.
Manjunath, K.R., Panigrahy, S., Adhya, T.K., Beri, V., Rao, K.V., and Parihar, J.S., 2008. Methane emission inventory from Indian rice- ecosystems using remote sensing, GIS and Field Observations. Scientific Report: SAC/ AFEG/ AMD/ EIAA/ SN/03/2008.
Prather, M., & Ehhalt, D., 2001. Atmospheric chemistry and greenhouse gases. In J. T. Houghton, Y. Ding, D. J. Griggs, M.
Noguer, P. J. van der Linden, X. Dai, K. Maskell, & C. A. Johnson (Eds.), Climate change 2001: The scientific basis (pp. 239–287). Cambridge, UK7 Cambridge University Press. Reiner,W., Milkha, S. A., 2000. The role of rice plants in regulating mechanisms of methane missions. Biol Fertil Soils 31:20–29. doi:10. 1007/s003740050619
US-EPA, 2006: Global Mitigation of Non-CO2 Greenhouse Gases. United States Environmental Protection Agency, EPA 430-R-06-005,Washington,D.C.website:http://www.epa.gov/ nonco2/econ-inv/downloads/GlobalMitigationFull Report. pdf (accessed 10 March2011).
Wahlen, M., N. Tanaka, Henry, R., Deck, B., Zeglen, J., Vogel, J. S., Southon, J., Shemesh, A., Fairbanks, R., and Broecker, W., 1989. Carbon-14 in methane sources and in atmospheric methane: The contribution from fossil carbon. Science, 245, pp. 286-290.
Yan X, Ohara T, Akimoto H, 2003. Development of region – specific emission factors and estimation of methane emission from rice fields in the East, Southeast and South Asian countries, Global Change Biology, Vol. 9,237-254.
Yan, X., H. Akiyama, K. Yagi, and H. Akimoto (2009), Global estimations of the inventory and mitigation potential of methane emissions from rice cultivation conducted using the 2006 Intergovernmental Panel on Climate Change Guidelines,
Global Biogeochemical Cycles, 23, GB2002,
doi:10.1029/2008GB003299. Website sources
ALGAS :Asia Least-cost Greenhouse gas Abatement Strategy. http://ntweb03.asiandevbank.org/oes0019p.nsf/pages/sitemap (accessed on 10 April,2013)
UNFCCC Country communications
APPENDIX
Table 2. Rice cultural type-wise total (CH4) emission Tg/ha/yr.
Co
untry
Cultural type Total crop
Rice cultural type area (Lakh ha)
Derived SIF CH4/day/ha
Total estimated CH4 Tg/yr/season *State
coefficient
Average India coefficient
*State coefficient
Average India coefficient
BAN
G
LADES
H C-Irr (Wet) 134 44.54 0.890 0.63 0.5319 0.3760
FP 138 7.50 1.120 1.1 0.1155 0.1138
Dr-P 129 5.56 0.570 0.52 0.0408 0.0373
DW 155 2.03 2.530 2.64 0.0795 0.0830
UP 126 4.45 0.000 0 0.0000 0.0000
Irr (Dry) 130 35.91 0.980 0.65 0.4565 0.3034
Total 99.98 1.2242 0.9136
NE
PAL
C-Irr (Wet) 125 11.38 0.58 0.63 0.0821 0.0896
FP _ _ _ _
Dr-P 111 0.27 0.16 0.52 0.0005 0.0016
DW 145 0.18 2.64 2.64 0.0071 0.0071
UP 110 0.55 0 0 0.0000 0.0000
Irr (Dry) 122 1.15 0.58 0.65 0.0081 0.0091
Total 13.53 0.0977 0.1074
S
R
I L
A
NK
A C-Irr (Wet) 143 3.03 0.52 0.63 0.0225 0.0273
FP 143 0.14 0.49 1.1 0.0010 0.0022
Dr-P 156 7.46 0.2537 0.52 0.0295 0.0606
DW _ _ _ _ _
UP 139 0.11 0 0 _ _
Irr (Dry) 96 2.76 0.76 0.65 0.0201 0.0172
Total 13.50 0.0000 0.1073
PA
KISTAN
Irr (Dry)class1 132 3.43 0.76 0.65 0.0345 0.0295
Irr (Dry)class2 143 5.32 0.76 0.65 0.0579 0.0495
Irr (Dry) class3 152 4.12 0.76 0.65 0.0476 0.0407
Irr (Dry) class4 144 9.28 0.76 0.65 0.1015 0.0868
Irr (Dry) class5 149 6.30 0.76 0.65 0.0713 0.0610
Total 28.46 0.3128 0.2675
C-Irr-Continuous Irrigated (Wet season), FP- Flood Prone, Dr-P- Drought Prone, DW- Deep Water, UP-Upland, Irr- Irrigated (Dry season)