KEY WORDS: Large structures, dams, viaducts, cooling towers, tunnels, monitoring, instrumentation, geometric survey, 3D laser-scanning, photogrammetry, deformation, degradation, mapping, technology
ABSTRACT:
Whatever the age of a large structure (dam, viaduct, cooling tower, nuclear containment, tunnel,...) It has to be periodically monitored. It is a challenge to realise these services when the access is limited and difficult for Man. This paper introduces a global approach, developed by SITES, through examples of application on different concrete dams or cooling towers, and their results. This global method involves three techniques: the SCANSITES®(a visual inspection system), the LIDAR (3D laser scanning) and high
resolution photogrammetry.
1. INTRODUCTION
Lots of Large structures like dams, towers, tunnels, were built in the 60’s. Lots of them are still here and working 60 years later. Some of these industrial projects might be categorised in the next decades as historical heritage for their rareness, their innovation or their size.
It would be catastrophic if these structures were to fail, as they have too great an importance: economic or emblematic significance, or just for safety reasons. In this way and regarding their size and constitution, which are exceptional, the structural health of dams, cooling towers, viaducts, or nuclear containment has to be monitored in order to avoid heavy and expensive repairs that might be done too late and using methods which would require shutdown of the facility.
For decades, among the existing monitoring devices and methodologies applied to different types of large structures, two are widely used for safety management: visual inspection and geometric survey. The first is usually carried out with empiric methods, and the second is realized using accurate but discrete methods such as geodetic micro-triangulation or sensors instrumentation.
This paper introduces a new approach, using an exhaustive and numeric method called SCANSITES 3D®.
The SCANSITES 3D® is based on the combination of the SCANSITES® method, an advanced tool which provides numeric defect inspection of large structures, a new wide ranged LIDAR technology aiming to deliver 3D exhaustive geometric mapping, and very high resolution photogrammetric coverage. In the first part of this paper, we will introduce the SCANSITES® method, the LIDAR coverage and the photogrammetry. In the second part, we will explain how the combination is achieved and which data can be extracted on large structures. Before concluding, we will extend this paper to tunnel auscultation.
2. SCANSITES®OVERVIEW
Due to concrete or metal material use, knowledge of the structure cracking, corrosion and visual evolution is necessary for monitoring.
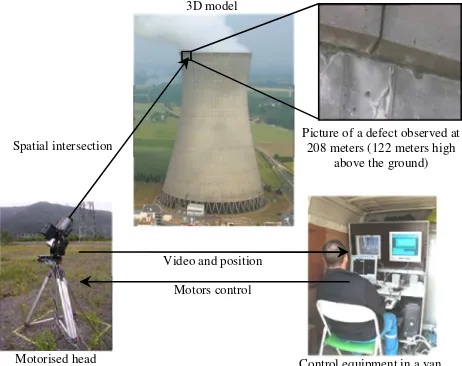
In the past, many owners weren’t completely satisfied with the traditional defect mapping process, using binoculars or rope access. The main drawback is the difficulty to produce a scaled defects map enabling an accurate and reproducible monitoring (crack evolution, opening measurement…). To answer this problem, the SCANSITES®was developed in the 1990’s. This system aims to produce a digital defects mapping connected to a database which is working as a true real-time G.I.S. (Geographic Information System) “Figures 1 and 2”. It is composed of:
- a hardware tool with a robotized video inspection head (focal length from 200 to more than 4000 mm) and its controllers “Figure 1”,
- a software suite including a database and several dedicated inspection tools (defects localization, cracks opening measurement, geometric and pathological characteristics, mapping tools) “Figure 2”.
The whole system is designed to operate on-site, without heavy carriage. Several dozens of dams, cooling towers and nuclear containment building, viaducts and chimneys have been examined by the SCANSITES®, in France and across the world, by SITES Company team.
Figure 1. SCANSITES®in operation 3D model
Motors control Video and position Spatial intersection
Picture of a defect observed at 208 meters (122 meters high
above the ground)
Figure 2. Defects mapping (conical
Figure 3. Picture of a defect captured wit
3. LIDAR OVERVIEW
The LIDAR “Figure 4” is a device which pro surveying in 3D coordinates. This technolog been used for long range applications for less It is based on two angular coders linked to and vertical) and a remote laser distance m (time of flight of laser emission or phase shi system works with enough velocity to 100 000 points each second. For the majority a wide range LIDAR is used. It is able to sc 1000 meters onto surfaces.
The result of a LIDAR survey, called “point It is composed of dozen of millions points laser intensity. The average density is 1 poi and the accuracy of the modelling surface i (5-10 mm). The surface can be compared to order to extract the deviations.
Most of the time, 3 to 5 points of view are n to 8 for cooling towers. The different poin linked to each other and placed into a single based on the gravity.
LIDAR is not limited to large structures. No units with full dome 360° field of view are a scan and archive the geometry of castles, m inside purpose. Some of these units can catc points in 1 second with max range of 100 m SITES company for tunnel inspection.
al projection)
ith SCANSITES®
EW
produces high density logy is mature and has less than 10 years.
to mirrors (horizontal e measurement device shift technology). The o acquire more than rity of large structures, scan structures, up to
int cloud” “Figure 5”. known in XYZ and oint each 5 to 20 mm e is a few millimetres to theorical shapes in
re needed for a dam, 6 int clouds have to be gle coordinate system
Nowadays, short range re available in order to monuments and other atch up to 1 million of 0 meters. It is used in
Figure 4. LIDAR in operation
Figure 5. Point cloud of Castle
4. HIGH DEFINITION ORTH COVERA
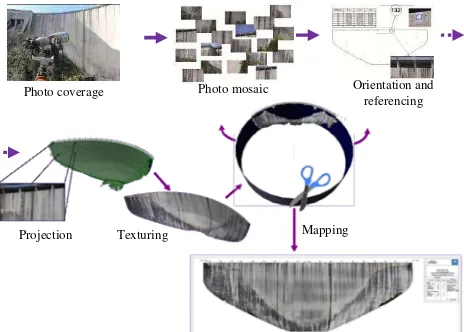
The photogrammetric coverage d definition pictures of the structure any defects.
It is possible to produce a visual i lens and high definition digital c referenced pictures. “Figure 6” The give a pixel equivalent to a few m which makes it possible to detect th As the photos’ positions and orien Euler angle), each photo can be p texture it. The next step is to proje primitive (plane, cone, and cylin projected assembly of image i “Figure 7”
At each point of view, complete p given focal lens: more than 1000 point of view which represents a complete detailed inspection of a co After the projection and assembly orthophotography can reach up to 2 More and more, with the digital progress, the inspection based completely replace the SCANSIT operations and associated treatmen be fully compatible and replaceab inspection, database, mapping and
on on the left bank of a dam
– deviation to mean plane
RTHOPHOTOGRAPHIC ERAGE
delivers exhaustive and high ure, including the parts without
l inspection, using a long focal l camera in order to produce The camera and lenses used can millimetres onto the structure, t the main defects.
rientations are known (XYZ and e projected on the 3D mesh to roject the textured 3D mesh on a linder) to obtain a map. This is called orthophotography.
photo coverage is done with a 00 photos can be done for one s about 10 000 photos for the a cooling tower.
ly of each photo, the size of the o 25 billion of pixels.
al photography and computing ed on orthophotography can SITES® inspection. The field ents were designed in order to eable: the tools used to do the
Figure 6. High resolution camera, 600 mm lens and panoramic head facing upstream wall of a dam
Figure 7. Block diagram of orthophotography operations
5. OPERATIONS
The SCANSITES 3D® monitoring requires that all data is known in a single XYZ referential. The method can use the one established for the traditional survey (targets, pillars, geodetic points). In case there is no available network, it is necessary to create one, based on singular points on the structure and referenced with traditional survey operations or laser scanning (LIDAR).
Regarding the visual inspection, each structure owner has its own requirements. It deals with defects, which have to be surveyed, and the associated classification. One of the most important parameters is the minimum opening for a crack that needs to be surveyed. It mainly impacts the focal length used during the inspection (up to 4000 millimetres) and the total number of defects stored. All those considerations help in preparing the mission, mainly the database and the inspection software.
The LIDAR, the SCANSITES® and/or the photogrammetric head are set at different locations in order to cover the structure’s entire surface. The high gain video camera and quality lenses of the SCANSITES® allow it to work with low ambient luminosity. The LIDAR, for its part, can work without light.
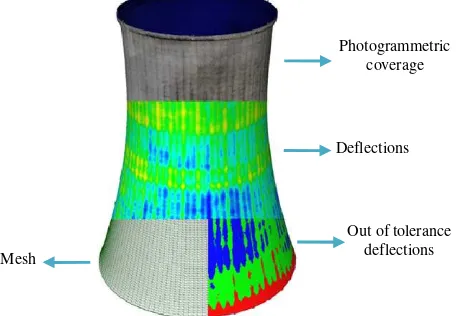
With the LIDAR, a complete scan is realized. Based on this point cloud, a triangular meshing “Figure 8” is generated and converted in a 3D shape. The first use of this 3D shape is to allow the SCANSITES® to locate the defects in 3D and/or to project the photos in order to create the very high resolution orthophotography.
Figure 8. Triangular meshing
With this incoming data, the visual inspection is processed. With the SCANSITES®, the operator inspects the entire wall by moving the inspection head with a joystick. When a defect is found, it is photographed. The 3D map is updated in real time with defects and the database is filled with its characteristics and coordinates. In parallel or in replacement of this operation, a complete high definition photogrammetric coverage is done with a high resolution camera and a robotised panoramic head. The operations done to inspect the orthophotography use the same software than the real time SCANSITES® tool but this inspection is realized at the office.
6. TREATMENTS
The treatments aim to produce, on a multilayer file, a map containing all defects captured, the geometric deflections and the photogrammetric coverage.
The first step is to compare the structure’s 3D shape to the theoretical shape or to a previous survey. The 3D deflections are extracted and a map is generated. “Figures 10, 12” Two ways of representation are possible. One is a coloured map: each colour depends on the deflection value. The other way is to carry out a contour line representation.
The second step is to overlay the defects surveyed with the SCANSITES®or orthophotography, using the same referential network.
The last step is to overlay the pictures directly on the structure’s 3D shape enabling the production of an orthophotography. With these files, many views can be generated such as composite views: defects/deflections, defects/pictures, or thematic views (based on database queries).
6.1 Case study: a concrete arch dam in France
The SCANSITES3D® method was applied to a large dam located in France. Its main figures are a height of 95 meters and a crest length of 200 meters. The average distance between the points of view and the downstream facing was about 100 meters. The aim of this job was to connect the geometric deflections to the defects surveyed. The LIDAR survey recorded 70 million points, and the defects’ total quantity was near 4000. “Figures 9, 10”
The focal lens of photogrammetric coverage has been adjusted between 100 and 500 mm in order to produce an orthophotography of 1.5 billion pixels with a pixel size of 5 mm. The detailed inspection was performed by the SCANSITES®tool with a focal length of 1000 mm.
The defects and photogrammetric coverage have been mapped using a cylindrical projection based on the mean cylinder of the downstream wall.
This monitoring was helpful to locate the parts to repair and to store the visual and geometric aspect of the wall.
Photo coverage Orientation and referencing
Figure 9. Orthophotography of the downstream wall with defects overlaid
Figure 10. Map overlaying deflection/defects and magnifying
6.2 Case study: a concrete cooling tower in France
The second case study concerns a cooling tower located in Europe. Its dimensions are a height of 90 meters and a diameter of 50 meters at the bottom.
The aim of the job was to get the tower’s geometric deflection and an accurate visual inspection with a global photogrammetric coverage “Figures 11 and 12”.
As carried out on the previous case study (dam), a LIDAR point cloud was generated representing 150 million points. In parallel, we covered the whole shell with high resolution pictures, projected it on a 3D shape, and then on a projection cone, for a total quantity exceeding 25 billion pixels.
In order to generate the orthophotography, several processors and computers were used in order to reduce the projection time. Without the parallel computing, the treatment time would be more than two weeks.
On this type of structure, mostly built in the 70’s and 80’s, we’ve observed that the real shape can be far from the theoretical shape.
Figure 11. Representation of 3D model, deflections and photogrammetric coverage
7. RESULTS
7.1 Statistics
Concerning the visual inspection, the traditional way is to produce a sketch based on a close inspection (rope access) or binocular observations. The consequent difficulties of these methods are to get a good location of the defects and their evolution. SCANSITES3D® provides some digital results: a scaled defect map and defects database. The first result is to produce an accurate report emphasizing defects evolution between two inspections, and the number of defects divided by zone “Figure 13”.
Figure 13. Number of defects by family and zone
The LIDAR coverage is a guideline for defects analysis, for instance to see if cracks are correlated, or not, with geometrical distortions.
Another interesting point is its use on parts covered by moss. Scanning one way we get structural information where visual inspection is inefficient. It is also helpful to know where a structural diagnosis has to focus on (with concrete sample or testing core for example).
7.2 Use of the data for repairing and utility of geometry
The data extracted from the visual inspection is useful to establish an accurate bill of quantities for restoration works, like total crack length to be treated, total corroded bar amount for passivation treatment…
Providing the exact length and the exact position of cracks and corrosions allows the preparation of a reparation intervention with all the necessary information: quantity of product to use, localisation (height from the floor or the crest,…) and simulations for the access (length of rope and inclination, height of positive or negative crane, …)
As the accurate 3D shape of the structure is known, data for planning sensor installation or well location can be easily computed.
1478
1076 1744
1145 1523
811 1443
1313
0 200 400 600 800 1000 1200 1400 1600 1800
A B C D E F G H
D
e
fe
c
ts
n
u
m
b
e
r
Cracks Seepage Corrosion Miscanellaneous Total by zone
Photogrammetric coverage
Mesh
Deflections
uncertainty, and we get global continuous inf improves the sensitivity of the geometric dia the details.
In addition, the geometrical surveys with L quicker to carry out than the traditional geod Another advantage is that this method work even if there is no surveying equipment such
7.4 GIS (Geographic Information System
All the data (photo, geometric survey, evolutions) is overlaid on a same file. The en way to make his diagnosis compared to fusion imposed by separate reports.
The last advantage is the storage of all c database, offering efficient tools to meas ageing
All these jobs are performed without rope dramatically the safety conditions.
8. EXTENSION TO TUNNEL AUS
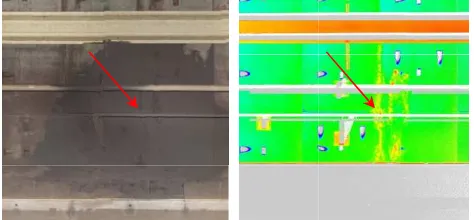
A version of the SCANSITES3D®has been auscultation. The tools are about the same scanner, digital camera with wide lens, the and odometer mounted on a trolley. The d mean cylinder representing tens of kilome enabling direct access to the visual aspect, di position in the tunnel (kilometer point – KP) The view rendered and referenced is usef concretions and parts of the concrete ready 15 and 16”.
The resulting file size can reach tens of depending on the length of the tunnel… Eac can be viewed with a computer: visual asp helps the owner for repairation and new equ as the maintenance access is very restrict during the night or weekend for high traffic t
Figure 14. Water leakage and con (left : orthophoto – Right : distort
information. It greatly diagnosis, showing all
h LIDAR were much odesic method. rks on every structure,
ch as targets.
tem) consultation
y, defects maps and engineer gets a faster to the fastidious data
ll collected data in a easure the structure’s
pe access, improving
SCULTATION
een adapted for tunnel me: short range laser thermographic camera data is mapped on a meters of tunnel wall , distortions linked and
P).
seful to detect leaks, y to fall. “Figures 14,
of billions of pixels, Each part of the tunnel spect, geometry. This equipment installation ricted to a few hours ic tunnels.
concretions ortion map)
Figure 15. Orthophotography of Tu
Figure 16. Distortions of Tunne
9. CONCLU
We’ve presented a new and m inspection and geometric survey, cooling towers, with SCANSIT particularly convenient for every resuming of its monitoring progra exhaustive inventory. It also allo existing monitoring program by c done by conventional approaches adapted to concrete structures, bu constructions, masonry-works, c correlation between defects an information used to locate the areas sensors have to focus on. Moreov the monitoring, the SCANSITE mappings which are often lacki method is widely applicable on la but also skyscrapers, chimneys, viaducts, tunnels, …
The next step, in progress, is t thermographic imagery survey. Its gain in diagnosis, mainly on cracks
Tunnel (cylindrical projection)
nnel (cylindrical projection)
LUSION
modern approach for visual y, here focused on dams and SITES3D®. This method is ery structure which needs the ogram, because it provides an allows the readjustment of an completing the partial survey hes. Not only is this method but it can also be used on old clay works… Finally, the and deflections is precious eas where geodic surveying and over, besides useful results for ITES3D® provides as-existing cking on old structures. This large structures such as dams, , cooling towers, pillars of