Efficiency and Ownership: Evidence from
Japanese Credit Cooperatives
Hirofumi Fukuyama, Ramon Guerra, and William L. Weber
Data envelopment analysis (DEA) is used to estimate the overall efficiency and produc-tivity growth of credit cooperatives in Japan during 1992–1996. Overall efficiency is decomposed into output technical efficiency and input allocative efficiency. Twenty percent of all credit cooperatives in Japan are foreign owned with more than 90% of those owned by Koreans. The history of institutional discrimination against Koreans in Japan suggests that ownership might affect efficiency. The empirical findings suggest that foreign-owned cooperatives are more efficient and experienced greater productivity growth during the period. © 1999 Elsevier Science Inc.
Keywords: Input allocative efficiency; DEA
JEL classification: G2
I. Introduction
In the 1980s, the expansionary monetary policy of Japan’s Ministry of Finance and the easy credit conditions offered by Japanese financial institutions helped fuel higher Japanese stock and real estate prices. In 1990, the bubble burst. The ensuing financial crisis revealed bad loans estimated to be as high as 16% of GDP. Although initially reluctant to act, the Ministry of Finance has recently begun promoting mergers among financial institutions to enhance efficiency and encourage the adaption of innovations in communications and computer technology, which are sweeping the global financial services industry (Lincoln, 1998). For mergers to promote efficiency, though, scale economies, greater technical efficiency, or greater allocative efficiency must be forth-coming from the combined firms.
Faculty of Commerce (H.F.), Fukuoka University, Nanakuma, Jonan-ku, Fukuoka, Japan; Department of Sociology (R.G.), University of Texas, Pan-America, Edinburg, Texas; Department of Economics (W.L.W.), Southeast Missouri State University, Cape Girardeau, Missouri.
Address correspondence to: Dr. W. Weber, Department of Economics, Southeast Missouri State University, Cape Girardeau, MO 63701.
In this paper, we investigate the overall efficiency and productivity growth of credit cooperatives (Shinyo Kumiai) in Japan. The effects of foreign ownership, primarily by Koreans, on credit cooperative efficiency are also examined. The empirical findings should add to the knowledge of Japanese financial institutions’ efficiency and help policy makers evaluate the efficiency enhancing effects of mergers. Fukuyama (1993) found, for Japanese banks, that, while scale efficiency increased with asset size, technical efficiency did not. In contrast, Fukuyama (1996) found that most Japanese credit associations (Shinyo Kinko) operated in the range of decreasing returns to scale, although larger credit associations exhibited greater pure technical efficiency. Fukuyama and Weber (1999) found that 90% of Japanese securities firms operated in the range of increasing returns to scale. They also found that firms with keiretsu links to banks exhibited greater scale efficiency, but less pure technical efficiency and less allocative efficiency than other firms. For Japanese life insurance firms there was an approximately equal split between firms operating in the range of increasing and decreasing returns to scale. (Fukuyama 1997)
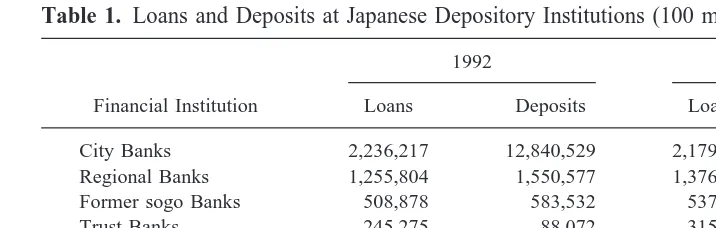
Credit cooperatives are important financial institutions for regional finance in Japan. Organized under the Law for Small Business Cooperatives, credit cooperatives are based on the mutual support of owners and workers of small and medium-sized firms. They accept deposits and installment savings from members of the cooperative, government municipalities, public firms, and non-profit organizations. They also lend and discount bills to members and certain non-members, and engage in payments associated with securities transactions. While the Ministry of Finance directly monitors banks, credit associations, securities companies, and insurance companies, the prefectural governments monitor credit cooperatives.1While more than one-third of all credit associations have branches across prefectures, all operations of credit cooperatives are conducted within the given prefecture. Table 1 provides a description of the loan and deposit structure of various depository institutions in Japan. Given the relatively small size but large number of credit cooperatives, a finding of scale economies would suggest the potential for mergers to enhance efficiency. However, because credit cooperatives engage primarily in small business lending, which entails significant monitoring costs, scale economies may be difficult to exploit.
1Tatewaki (1992) and Suzuki (1987) provide a detailed description of credit cooperatives.
Table 1. Loans and Deposits at Japanese Depository Institutions (100 million yen)
Financial Institution
1992 1996
Loans Deposits Loans Deposits
City Banks 2,236,217 12,840,529 2,179,562 2,179,302 Regional Banks 1,255,804 1,550,577 1,376,140 1,702,460
Former sogo Banks 508,878 583,532 537,622 627,750
Trust Banks 245,275 88,072 315,565 171,515
Long-term Credit Bank 472,030 53,369 474,016 94,783 Credit Associations 650,478 882,085 712,107 999,364 Credit Cooperatives 183,108 229,195 186,442 226,190
In this paper, budget constrained frontier measures of efficiency and productivity growth are constructed using the indirect output distance function. The indirect output distance function is useful for examining the efficiency of public enterprises, non-profit organizations, and cooperative-type organizations that face a budget constraint and have objectives other than profit maximization or cost minimization. For example, managers may be utility maximizers or display a preference for certain kinds of expenses. Studies of the US savings and loan industry by Verbrugge and Jahera (1981) and Mester (1989) tested for evidence of such behavior. Our method allows the overall efficiency of a credit cooperative to be decomposed into output technical efficiency, scale efficiency, and input allocative efficiency. Data envelopment analysis (DEA) is used to estimate each type of efficiency.
The DEA method allows researchers to examine the best practice technology among firms rather than an average or hypothetical technology. In contrast to econometric methods, DEA allows researchers to avoid specification of an ad hoc functional form or error structure. (Seiford 1996, Grosskopf 1986) A survey of statistical inference for non-parametric frontier models has been done by Grosskopf (1996). Recently, Simar and Wilson (1998) have shown how bootstrapping techniques can be used to construct confidence intervals of efficiency for decision-making units. Despite these attractive features, only a limited number of DEA studies have examined bank input allocative efficiency. (Aly et al., 1990; Rangan et al., 1988; Ferrier and Lovell, 1990; Grabowski et al., 1993; Zaim 1995)
The paper is organized the following way. A brief description of the history of Koreans in Japan is provided in Section II. Section III presents Shephard’s direct and indirect production methodology, derives measures of output technical efficiency and input allocative efficiency, and constructs a Malmquist productivity index. The DEA method-ology used to estimate efficiency and productivity change is also described in Section III. Sections IV and V discuss the specification of inputs and outputs and provide empirical results focusing on ownership and efficiency. The last section offers a few remarks and a summary.
II. A Brief History of Koreans in Japan
suggests that ownership might be an important determinant of credit cooperative effi-ciency. In the empirical section, we test for systematic differences in efficiency and productivity growth between Japanese-owned and Korean-owned credit cooperatives.
III. Direct and Indirect Production Framework
To measure efficiency and productivity growth we follow Shephard’s (1970, 1974) production theory and assume a convex reference technology, free disposability of outputs and inputs and no free lunch. Let y [ RM1 and x [ RN1 denote vectors of outputs produced and inputs employed by a firm. The direct output set, P( x), gives the set of y which can be produced from x. The direct output distance function is denoted as:
D(x, y)5minu{u:y/u[P(x)}. (1)
If D( x, y)51 the firm operates on the frontier of P( x), while D( x, y),1 indicates that the firm operates inside P( x). The reciprocal of D( x, y) serves as the measure of technical efficiency, TE( x, y), and gives the maximum proportional expansion of all outputs given inputs.
Let w[RN11represent the set of strictly positive input prices and let c.0 represent the budget available to hire inputs. The indirect set, IP(w/c), is the largest production possibility set allowing x to vary while still satisfying the budget constraint, (w/c)9x#1.
The indirect output distance function is:
ID(w/c, y)5minl,x{l:y/l[IP(w/c)}. (2)
If ID(w/c, y) 5 1 the firm operates on the frontier of IP(w/c), while ID(w/c, y) , 1 indicates that the firm operates inside IP(w/c). The reciprocal of ID(w/c, y) measures overall efficiency, OE(w/c, y), and gives the maximum proportional expansion of output given IP(w/c).
The set P( x) is a subset of IP(w/c) as IP(w/c) offers the input choice, x, to the firm and any other affordable input choice, x*, such that (w/c)9x* # 1. Therefore, OE(w/c, y)$ TE( x, y). Figure 1 illustrates the sets P( x), IP(w/c) and the construction of TE( x, y) and OE(w/c, y). A firm is observed to produce at point A inside P( x). Given inputs and holding
the output mix constant, efficiency is obtained at point B. Technical efficiency is TE( x,
y)5 OB/OA. If the firm operated efficiently given IP(w/c) it could produce at point C. The value of the overall efficiency measure is OE(w/c, y)5OC/OA.
Whether a firm is input allocatively efficient and output technically efficient can be found by comparing TE and OE. When TE5 1, the firm is technically efficient with respect to outputs. When TE 5 OE . 1, the firm is not technically efficient but is allocating inputs efficiently. That is, there are no further output gains to be had from reallocating inputs. Finally, when TE5 OE51, the firm is output technically efficient and input allocatively efficient. Therefore, a measure of input allocative efficiency, IAE, is:
IAE(x, w/c, y)5OE(w/c, y)/TE(x, y)$1 for (w/c)9x#1. (3)
(IAE21)3100% while maintaining the same cost through an appropriate reallocation of inputs.2
Overall efficiency is the product of output technical efficiency and input allocative efficiency:
OE5TE3IAE. (4)
Technical efficiency can be further decomposed into the product of scale efficiency, SCALE, and pure technical efficiency, PTE. Scale inefficiency occurs when the firm does not operate at constant returns to scale. Pure technical inefficiency arises from a lack of managerial oversight of the production process. To derive scale efficiency, technical efficiency is estimated relative to a constant returns to scale technology, TECRS, and relative to the variable returns to scale technology, TEVRS. Pure technical efficiency is PTE5 TEVRS, scale efficiency is SCALE5TECRS/TEVRS, and TE5PTE3SCALE.
To measure productivity growth we follow the work of Fa¨re and Grosskopf (1994) and construct a Malmquist indirect productivity index (IM) using the indirect production possibility sets in periods t and t11. Productivity change equals overall efficiency change (OEC) times technological change (TECH): IM5OEC3 TECH, where
OEC5ID
t11~~w/c!t11, yt11!
IDt~~w/c!t, yt! (5)
and
TECH5
Î
IDt~~w/c!t11, yt11!xIDt~~w/c!t, yt!
IDt11~~w/c!t11, yt11!xIDt11~~w/c!t, yt!. (6)
2Recently, Grosskopf et al. (1999) have compared the direct and indirect production sets for school districts
and derived a measure of the gain from deregulating school input choices. Their gain measure corresponds with the IAE measure provided in Equation 3.
Since IDt((w/c)t, yt)215OEt5PTEt3SCALEt3IAEt, OEC equals the product of pure technical efficiency change (PTEC), scale efficiency change (SEC), and input allocative efficiency change (IAEC), where PTEC 5 PTEt/PTEt11, SEC 5 SCALEt/SCALEt11, IAEC5IAEt/IAEt11and OEC5 PTEC3 SEC3 IAEC. The rate at which a firm is “catching up” to the frontier equals (OEC 2 1) 3 100%. The rate of technological progress or shift in the frontier equals (TECH21)3100%. Values of IM, OEC (or any of its components), or TECH greater than one indicate productivity growth, greater efficiency, and technological progress, while values less than one indicate productivity decline, less efficiency, and technological regress.
To estimate the various efficiency measures data envelopment analysis is employed. Let Y denote the M3K matrix of observed outputs and X denote the N 3K matrix of
observed inputs of K firms. Let w represent the N31 vector of observed input prices and c represent the total cost or available budget.
The estimated constant returns to scale (CRS) indirect production possibility set is denoted as:
IP(w/c)5{y:Yz$y, Xz#x, w9x#c, z$0}, (7)
where z is a K31 vector of intensity variables and the constraints Yz$y, and Xz#x,
restrict the firm to produce no more output using no less input than a convex combination of all firms’ outputs and inputs. In Equation 7, inputs can vary but must satisfy the budget constraint, w9x# c.
The estimated constant returns to scale direct output set, P( x), is:
P(x)5{y:Yz$y, Xz#x, z$0}. (8)
In Equation 8, inputs are taken as fixed. Adding the constraint,Skzk51, imposes variable returns to scale.
A sequence of linear programming (LP) problems are solved to estimate OE, TEVRS, and TECRSfor each of the k5 1, . . . , K credit cooperatives operating in t5 1, . . . , T periods given the DEA producible output sets defined in Equations 7 and 8. For example, to estimate OE, the following LP problem is solved:
OE5maxl,xl: Yz$ly, Xz#x, w9x#c, z$0. (9)
The problems for TEVRS and TECRS are solved similarly. Two other LP problems are solved for each credit cooperative to estimate productivity change from period t to period
t11: IDt11((w/c)t, yt) and IDt((w/c)t11, yt11). Fa¨re, Grosskopf, and Lovell (1994), and
Fa¨re and Grosskopf (1994) provide further details on the construction of the LP problems.
IV. Specification of Outputs and Inputs
each year.3The number of foreign credit cooperatives ranged from 75 in 1992 to 70 in 1996. Foreign-owned cooperatives operated in 38 out of the 46 prefectures in Japan. Over 90% of the foreign-owned cooperatives were owned by Koreans with the remainder owned by Chinese.
We follow the asset approach of Sealey and Lindley (1977) and view credit cooper-atives as financial intermediaries that transform labor ( x1), capital ( x2), and deposits ( x3),
into loans ( y1) and security investments ( y2). The two outputs represent major activities
of credit cooperatives. Loans are viewed as the output from traditional business activities and security investments are viewed as the output from other important business activities. Loans, securities, capital, and deposits are measured in billions of yen at the end of each fiscal year. Labor equals the number of full-time employees and capital is measured as the asset value of premises, real estate, equipment, suspense payments for unfinished con-struction, and surety deposits and intangibles. Deposits make up the major portion of credit cooperative liabilities. There is some disagreement between researchers on whether deposits are an input or an output of the financial services industry. Resti (1997) provides a discussion. Gilligan and Smirlock (1984) found that the asset approach dominates output measures that include deposits. Still, other researchers have chosen to define transaction deposit services as an output and non-transaction deposit services as an input for commercial banks. Such a decomposition is not possible for our data set. Since credit cooperatives pay interest expenses on deposits we follow Fukuyama (1996) and treat deposits as an input so that IP(w/c) can be constructed with strictly positive input prices as required. As a limited sensitivity analysis, we also estimated an alternative model with loans, securities, and deposits as outputs that are produced using labor and capital.4
The price of labor, w1, equals the sum of personnel expenses divided by the number of
employees. The price of capital, w2, equals non-personnel expenses divided by the asset
value of capital. The price of deposits, w3, equals the ratio of interest paid on deposits to
total deposits. Descriptive statistics are provided in Table 2.
Japanese firms are often thought to face input price differentials (Rebick, 1993; Hashimoto and Raisian, 1985). To avoid misleading inferences, we first tested for systematic input price differentials between large and small firms. Asset size and the number of branches were significantly and negatively correlated with the price of labor and the price of capital. Asset size and the number of branches were significantly negatively correlated with the price of labor and the price of capital. No significant correlation existed between asset size or branches and the price of deposit services. To further test for input price differentials the sample was divided into three groups based upon asset size: small, medium, and large credit cooperatives. The analysis of variance (ANOVA) F-test and the non-parametric Kruskal–Wallis test and Savage scores test indicated significant differences in input prices between the three groups. We therefore used firm-specific input prices to estimate input input allocative efficiency.
3There were 393 listed credit cooperatives in 1992, 383 in 1993, 373 in 1994, 367 in 1995, and 355 in 1996.
Incomplete data reduced these numbers by 12 in 1992, 9 in 1993, 8 in 1994, 10 in 1995, and 10 in 1996.
4The Spearman correlation coefficients between the model reported in the paper and the alternative model
V. Empirical Results
Descriptive statistics for the decomposition of overall efficiency are shown in Table 3 for the entire sample of credit cooperatives and by Japanese-owned and foreign-owned cooperatives. Following Elyasiani and Mehdian (1992) and Fukuyama (1997), we tested whether Japanese-owned and foreign-owned cooperatives share a common technology. The efficiency scores for each year were first estimated assuming that both Japanese and foreign-owned firms make up the feasible production sets, P( x), and IP(w/c), which we term the pooled technology. Then the efficiency scores for each year were estimated assuming separate technologies for Japanese-owned firms and for foreign-owned firms. Under the null hypothesis, the ranking of the pooled efficiency scores is the same as the ranking of the separate sample efficiency scores. The Kruskal–Wallis non-parametric statistic is reported in Table 4 for each year for each efficiency measure. Overall efficiency is not significantly different (a5.05) for the pooled versus the separate sample estimates in any of the sample years so we report only the pooled results in Table 3, and the pooled results for productivity change in Table 6.5Mean overall efficiency was 1.73 in 1992 and 2.268 in 1996. Output could be increased by a factor of 1.44 in 1992 and by 1.62 in 1996 if credit cooperatives were to become technically efficient and by a factor of 1.20 in 1992 and 1.40 in 1996 by reallocating inputs and realizing greater input allocative efficiency.6
5The efficiency measures and productivity growth measures for the separate samples are available from the
authors upon request.
6Although beyond the scope of this paper, the bootstrap methodology proposed by Simar and Wilson (1998)
can be used to estimate confidence intervals of efficiency for each decision-making unit. Table 2. Descriptive Statistics y15loans 4746.42 4949.63 5190.53 4748.70 4756.58
(8913.07) (9823.11) (1053.89) (8720.49) (8458.32) y25securities 435.15 479.50 516.05 540.15 564.34
(722.35) (816.14) (902.36) (1040.80) (1111.84) Inputs
x15labor 114.01 118.23 120.02 115.81 114.18
(147.37) (155.90) (159.67) (154.34) (152.78)
x25capital 131.55 141.82 147.48 124.91 126.99
(372.61) (410.04) (431.02) (269.61) (268.25) x35deposits 5972.99 6292.84 6616.46 6146.73 6152.18
(10052.82) (11135.72) (11757.22) (9942.19) (9785.76)
Assets 7202.09 7599.79 77881.95 7233.91 7166.15
(12387.49) (13470.13) (13911.97) (11806.88) (11432.32)
Branches 7.74 7.93 8.09 7.91 8.04
Table 3 also presents information on the nature of scale returns for the credit cooper-atives.7Seventy-three percent of firms operated in the range of decreasing returns to scale, while 23% operated in the range of increasing returns to scale. This finding is in sharp contrast with Fukuyama’s (1993) study which found that most Japanese banks operated in
7To determine the range of scale returns a firm operates in we calculate technical efficiency using the direct
production set, P(x), under constant returns to scale, TECRS, under variable returns to scale, TEVRS, and under
non-increasing returns to scale, TENIRS. If TECRS5TEVRSthe cooperative operates in the range of constant
returns to scale. If TECRSÞTEVRS5TENIRSthe firm operates in the range of decreasing returns to scale. Finally,
if TECRS5TENIRSÞTEVRSthe cooperative operates in the range of increasing returns to scale.
Table 3. Efficiency Measures Geometric Means
Pooled Results
OE1 1.730 1.776 1.808 1.954 2.268
TE2 1.444 1.580 1.426 1.361 1.616
PTE 1.319 1.368 1.292 1.267 1.436
SCALE 1.095 1.155 1.104 1.074 1.125
IAE 1.198 1.124 1.268 1.436 1.404
Number of firms operating in the range of:
IRS 87 82 97 68 104
CRS 17 23 30 29 22
DRS 277 269 238 260 219
Japanese Credit Cooperatives
OE 1.771 1.802 1.853 2.039 2.413
TE 1.461 1.613 1.432 1.361 1.668
PTE 1.322 1.372 1.275 1.254 1.454
SCALE 1.105 1.176 1.123 1.085 1.147
IAE 1.212 1.117 1.294 1.498 1.447
Number of firms operating in the range of:
IRS 48 45 47 26 52
CRS 15 18 23 17 15
DRS 243 240 223 242 208
Minority-Owned Credit Cooperatives
OE 1.570 1.665 1.636 1.650 1.772
TE 1.375 1.442 1.404 1.355 1.423
PTE 1.305 1.351 1.363 1.317 1.368
SCALE 1.054 1.067 1.030 1.029 1.040
IAE 1.142 1.155 1.165 1.218 1.245
Number of firms operating in the range of:
the range of increasing returns to scale, but is similar to that found for Japanese credit associations.
Several recent papers have examined the effects of ownership form on commercial bank efficiency. Grabowski et al. (1993) found that branch banks in the US tend to be more overall efficient than multi-bank holding companies. Elyasiani and Mehdian (1992) found no significant difference in the distribution of efficiency between U.S. minority and non-minority owned banks.
Given Koreans’ status in the Japanese economy, what effect does ownership have on credit cooperative efficiency? Table 3 breaks out overall efficiency for the pooled technology for Japanese owned and foreign-owned (mainly Korean-owned) credit coop-eratives. While Japanese cooperatives operate mainly in the range of decreasing returns to scale, foreign-owned cooperatives tend to operate in the range of increasing returns to scale. To determine whether foreign-owned cooperatives were significantly more or less efficient we employed the ANOVA F test and the non-parametric Wilcoxon and Savage scores tests. The null hypothesis is that the ranking of the efficiency scores does not depend on ownership. The results of the tests are presented in Table 5 and suggest that Table 4. Tests for Different Technology between Japanese and Minority Owned Credit
Cooperatives (Pooled vs. Separate Samples)
PTE 3.36 4.15 6.72 12.32 15.35
(0.07) (0.04) (0.01) (0.01) (0.01)
S 0.98 0.10 0.15 0.79 1.30
(0.32) (0.76) (0.70) (0.37) (0.25)
IAE 4.92 1.84 0.20 0.89 0.04
(0.03) (0.17) (0.65) (0.35) (0.85)
Null hypothesis: Ranking of the pooled efficiency scores is the same as the ranking of the efficiency scores for the separate samples.
Table 5. Tests for Differences in Efficiency between Japanese and Minority Credit Cooperatives
for the Pooled Results
Efficiency
Variable 1992 1993 1994 1995 1996
OE A W S A W S A W S A W S A W S
TE A W S A W S z z S z W S A W S
PTE z z z z z z A z z z z z A W S
SCALE A W z A W S A W S A W S A W S
IAE A W S z z z A W S A W S A W S
OE5overall efficiency; TE5technical efficiency; PTE5pure technical efficiency; SCALE5scale efficiency; IPE5 input allocative efficiency.
OE5TE3IAE. TE5PTE3SCALE.
foreign-owned credit cooperatives are significantly more overall efficient than their Japanese-owned counterparts. Only for pure technical efficiency in 1994 and 1996 is there evidence suggesting that Japanese-owned cooperatives are more efficient. Although Koreans have experienced widespread institutional discrimination in Japan, it appears that they have been able to operate more efficiently than Japanese cooperatives, despite their smaller size. While only speculative, any institutional discrimination that has kept foreign-owned cooperatives small may have contributed to greater scale efficiency, and helped to focus managerial efforts on efficient input allocation and better oversight of the produc-tion process.
During 1992–1996, there was a 10% decline in credit cooperatives through exit and merger. If the market process is competitive, we would expect the decline to be among the least efficient cooperatives. While the credit cooperatives that exited the market from one year to the next were less overall efficient than the ones that remained, it was not statistically significant in any of the years.
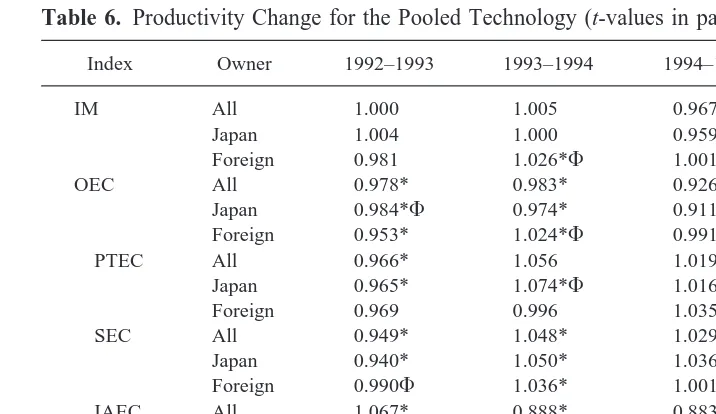
Table 6 presents the productivity index for the pooled technology. The percent change in productivity or any of its components equals (Index21)3100%. From 1992 to 1994 overall productivity grew slowly and began to decline in 1995. The average overall productivity decline was due entirely to declines in efficiency, although on average, credit cooperatives did experience technological progress. The results are not monolithic, however. For example, while average productivity growth remained constant or declined from 1992 to 1996, 168 credit cooperatives experienced productivity growth in 1992– 1993, rising to 195 in 1993–1994 before falling to 46 in 1995–1996. Throughout the Table 6. Productivity Change for the Pooled Technology (t-values in parentheses)
Index Owner 1992–1993 1993–1994 1994–1995 1995–1996
IM All 1.000 1.005 0.967* 0.937*
Japan 1.004 1.000 0.959* 0.926*
Foreign 0.981 1.026*F 1.001F 0.979F
OEC All 0.978* 0.983* 0.926* 0.850*
Japan 0.984*F 0.974* 0.911* 0.840*
Foreign 0.953* 1.024*F 0.991*F 0.938*F
PTEC All 0.966* 1.056 1.019* 0.879*
Japan 0.965* 1.074*F 1.016* 0.858*
Foreign 0.969 0.996 1.035 0.967F
SEC All 0.949* 1.048* 1.029* 0.955*
Japan 0.940* 1.050* 1.036*F 0.946*
Foreign 0.990F 1.036* 1.001 0.991F
IAEC All 1.067* 0.888* 0.883* 1.024*
Japan 1.085*F 0.864* 0.866* 1.035*F
Foreign 0.993 0.992F 0.957*F 0.979
TECH All 1.022* 1.022* 1.044* 1.090*
Japan 1.020* 1.027*F 1.053*F 1.102*F
Foreign 1.029* 1.002 1.010 1.044*
Notes:
IM5overall productivity growth, OEC5overall efficiency change, PTEC5pure technical efficiency change, SEC5 scale efficiency change, IAEC5input allocative efficiency change, TECH5technological change.
IM5OEC3TECH. OEC5PTEC3SEC3IAEC.
* Indicates the index is significantly different from one (a5.05) based on a t test.
period, the number of credit cooperatives experiencing greater overall efficiency declined while the number experiencing technological progress increased. These results reinforce those found in Table 6 and suggest that although IP(w/c) was shifting out over time, firms were simultaneously becoming more inefficient. A t test for significant differences in productivity between Japanese-owned and foreign-owned cooperatives revealed that foreign-owned cooperatives exhibited significantly greater productivity growth (or slower decline) than Japanese-owned firms. For efficiency change, the results were somewhat mixed, with Japanese firms exhibiting greater pure technical efficiency change in 1993– 1994, greater scale efficiency change in 1994 –1995, and greater input allocative effi-ciency change in 1992–1993 and 1995–1996 than foreign-owned cooperatives. From 1993–1996 Japanese firms exhibited greater technological change helping to offset their decline in overall efficiency relative to foreign-owned cooperatives.
We also calculated productivity growth using the direct distance functions. In this case,
P( x) serves as the reference technology. The direct Malmquist output productivity index
takes the same form as Equation 5 except that the direct output distance function, D( y, x), is substituted for the indirect output distance function, ID(w/c, y). In this case productivity averaged 1.5% during 1992–1993, 2.8% in 1993–1994, 2.3% in 1994 –1995, and213% in 1995–1996. Spearman’s rank correlation coefficient between the direct and indirect measures revealed a positive and significant correlation between the two productivity measures in all years.
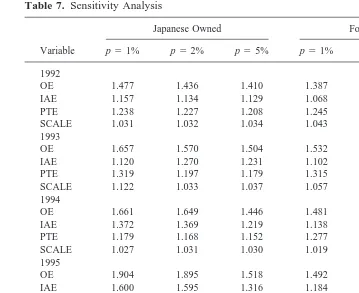
The DEA methodology compares each credit cooperative to the best practice technol-ogy among all credit cooperatives. Luck, measurement error, and omitted variables may play a role in determining the position of the best practice technology. To blunt these effects, we follow Elyasiani and Mehdian (1997), and omitted p% of the most efficient and p% of the least efficient credit cooperatives and then re-estimated the efficiency measures for each year. We chose p51%, p52%, and p55% to examine the sensitivity of the estimates of efficiency to outliers. The results are presented in Table 7 and are reported for Japanese-owned and foreign-owned credit cooperatives, assuming a common technology. The previous findings are confirmed. Foreign-owned cooperatives tend to be more overall efficient than Japanese cooperatives in each year. The Spearman and Pearson correlation coefficients revealed a positive and significant (a5.05) correlation between
the entire sample efficiency scores reported in Table 3 and each of the truncated samples for each year.
VI. Summary and Conclusions
We also found that ownership does matter. Although Koreans have experienced widespread institutional discrimination in Japan, foreign-owned credit cooperatives were more overall efficient and experienced greater productivity growth during the period than Japanese-owned credit cooperatives. While only speculative, the smaller size of foreign-owned cooperatives may have contributed to greater scale efficiency and helped focus managerial efforts toward more efficient input allocation and better oversight of the production process.
The collapse of the Japanese bubble economy in 1990 resulted in a substantial increase in non-performing loans and caused the financial services industry in Japan to undergo major restructuring. Credit cooperatives have not been immune to the subsequent restruc-turing with approximately 10% fewer cooperatives operating in Japan in 1996 than in 1992. Our panel data set showed a decline in credit cooperative productivity during period, primarily due to declines in overall efficiency, dampened somewhat by techno-logical progress. The results also suggest that there is very little to be gained through intra-industry mergers of credit cooperatives.
The authors would like to thank two anonymous referees, Professor Elyas Elyasiani and the editor for helpful comments on an earlier draft of this paper. The authors are responsible for any shortcomings.
Table 7. Sensitivity Analysis
Variable
Japanese Owned Foreign Owned
p51% p52% p55% p51% p52% p55%
1992
OE 1.477 1.436 1.410 1.387 1.365 1.260
IAE 1.157 1.134 1.129 1.068 1.067 1.034
PTE 1.238 1.227 1.208 1.245 1.230 1.187
SCALE 1.031 1.032 1.034 1.043 1.040 1.027
1993
OE 1.657 1.570 1.504 1.532 1.407 1.361
IAE 1.120 1.270 1.231 1.102 1.115 1.108
PTE 1.319 1.197 1.179 1.315 1.227 1.178
SCALE 1.122 1.033 1.037 1.057 1.028 1.043
1994
OE 1.661 1.649 1.446 1.481 1.461 1.360
IAE 1.372 1.369 1.219 1.138 1.137 1.109
PTE 1.179 1.168 1.152 1.277 1.240 1.192
SCALE 1.027 1.031 1.030 1.019 1.036 1.029
1995
OE 1.904 1.895 1.518 1.492 1.468 1.363
IAE 1.600 1.595 1.316 1.184 1.180 1.138
PTE 1.161 1.160 1.134 1.244 1.222 1.170
SCALE 1.025 1.024 1.017 1.013 1.013 1.024
1996
OE 2.400 2.079 1.875 1.723 1.633 1.550
IAE 1.850 1.607 1.608 1.337 1.283 1.263
PTE 1.231 1.225 1.140 1.261 1.239 1.200
References
Aly, H. Y., Grabowski, R., Pasurka, C., and Rangan, N. 1990. Technical, scale, and allocative efficiencies in U.S. banking: An empirical investigation. The Review of Economics and Statistics 72:211–218.
Berger, A. N., and Humphrey, D. B. 1991. The Dominance of Inefficiencies Over Scale and Product Mix Economies in Banking. Journal of Monetary Economics 28:149–159.
Elyasiani, E., and Mehdian, S. M. 1992. Productive efficiency performance of minority and nonminority—owned banks: A non-parametric approach. Journal of Banking and Finance 16:933–948.
Elyasiani, E., and Mehdian, S. 1997. A non-parametric frontier model of internationally-owned and domestically-owned bank cost structures. The International Journal of Finance, 9(1):529–548. Fa¨re, R., Grosskopf, S. 1994. Cost and Revenue Constrained Production, New York:
Springer-Verlag.
Fa¨re, R., Grosskopf, S., and Lovell, C. A. K. 1994. Production Frontiers, New York: Cambridge University Press.
Ferrier, G. D., and Lovell, C. A. K. 1990. Measuring cost efficiency in banking: Econometric and linear programming evidence. Journal of Econometrics 46:229–245.
Fried, H. O., Lovell, C. A. K., and Eeckaut., P. V. 1993. Evaluating the performance of U.S. Credit Unions, Journal of Banking and Finance 17:251–265.
Fukuoka, Y. 1996. Koreans in Japan: Past and present. Saitama University Review 31:1–14. Fukuyama, H. 1993. Technical and scale efficiency of Japanese commercial banks: A
non-parametric frontier approach. Applied Economics 25:1101–1112.
Fukuyama, H. 1996. Returns to scale and efficiency of credit associations in Japan: A non-parametric frontier approach. Japan and the World Economy 8:259–277.
Fukuyama, H. 1997. Investigating productive efficiency and productivity changes of Japanese life insurance companies. Pacific-Basin Finance Journal 5:481–509.
Fukuyama, H., and Weber, W. L. 1999. The efficiency and productivity of Japanese securities firms, 1988–1993. Japan and the World Economy 11:115–133.
Gilligan, T., and Smirlock, M. 1984. An empirical study of joint production and scale economies in commercial banking. Journal of Banking and Finance 8:67–77.
Grabowski, R., Rangan, N., and Rezvanian, R. 1993. Organizational forms in banking: An empirical investigation of cost efficiency. Journal of Banking and Finance 17:531–538.
Grosskopf, S. 1986. The role of the reference technology in measuring productive efficiency. The
Economic Journal 96:499–513.
Grosskopf, S., Hayes, K., Taylor, L., and Weber, W. 1999. Anticipating the consequences of school deregulation: A new use of DEA. Management Science. 45:608–619.
Grosskopf, S. 1996. Statistical inference and non-parametric efficiency: A selective survey, Journal
of Productivity Analysis, 7:161–176.
Hashimoto, M., and Raisian, J. 1985. Employment tenure and earnings profiles in Japan and the United States. American Economic Review 75:721–735.
Lee, C. 1981. Legal status of Koreans in Japan. In Koreans in Japan (C. Lee and G. Devos, eds.) Berkeley: University of California Press, pp. 133–158.
Lincoln, E. J. 1998. Japan’s financial mess. Foreign Affairs, May/June, 77:57–66.
Long, S. O. 1992. The society and its environment. In Japan (R. E. Dolan and R. L. Worden, eds.) Washington, D.C.: Federal Research Division, Library of Congress, pp. 72–128.
Mester, L. J. 1989. Testing for expense preference behavior: Mutual versus stock savings and loans.
The Rand Journal of Economics 20:483–498.
Min, P. G. 1992. Comparison of the Korean minorities in China and Japan. International Migration
Rangan, N., Grabowski, R., Aly, H., and Pasurka, C. 1988. The technical efficiency of U.S. banks.
Economics Letters 28:169–175.
Rebick, M. 1993. The persistence of firm-size earnings differentials and labor market segmentation in Japan. Journal of the Japanese and International Economies 7:132–156.
Resti, Andrea. 1997. Evaluating the cost-efficiency of the Italian banking system: What can be learned from the joint application of parametric and non-parametric techniques? Journal of
Banking and Finance 21:221–250.
Sealey, C. Jr., and Lindley, J. T. 1977. Inputs, outputs, and a theory of production and cost at depository financial institutions. Journal of Finance 32:1251–1266.
Seiford, L. M. 1996. Data envelopment analysis: The evolution of the state of the art (1978–1995).
Journal of Productivity Analysis. 7:99–137.
Shephard, R. W. 1970. Theory of cost and production functions. Princeton: Princeton University Press.
Shephard, R. W. 1974. Indirect Production Functions. Meisenheim Am Glad, Verlag Anton Hain. Simar, L., and Wilson, P. W. 1998. Sensitivity analysis of efficiency scores: How to bootstrap in
non-parametric frontier models. Management Science 44:49–61.
Suzuki, Y. 1987. The Japanese Financial System. New York: Oxford University Press.
Tatewaki, K. 1991. Banking and Finance in Japan: An Introduction to the Tokyo Market. London: Routledge.
Tsunoda, R. 1964. Sources of Japanese Tradition, New York: Columbia University Press. Verbrugge, J. A., and Jahera, J. S. Jr. 1981. Expense Preference in the Savings and Loan Industry.
Journal of Money, Credit and Banking 13:475–476.
Zaim, O. 1995. The effect of financial liberalization on the efficiency of Turkish Commercial Banks.