World Health House
in the South-East Asia Region
Tuberculosis
control
Annual TB report
2015
National TB control programmes in all 11 Member States of the South-East Asia Region have made a substantial progress in implementing the components of the Stop TB strategy. As a result of this concerted action by national TB control programmes and all partners, almost 22 million TB patients have been treated during the past 10 years. The treatment success rate among new smear-positive pulmonary TB (PTB) cases has remained above 85% since 2005, and was 88% in the 2012 cohort. The TB mortality rate has decreased by 50% since 1990 and the Region is on track to achieve the global target of a 50% reduction by 2015. The decline in the prevalence is observed in all Member States and in some it is over 50%.
While considerable progress continues to be made, national TB control programmes face a number of challenges that relate to uncertainties regarding sustainable financial and operational resources, limited technical and management capacity, etc. It is increasingly being recognized that attention needs to be paid to addressing the social, economic and behavioural determinants that impact TB, if national efforts to combat TB are to succeed in the longer term.
Tuberculosis control
in the South-East Asia Region
© World Health Organizaion 2015 All rights reserved.
Requests for publicaions, or for permission to reproduce or translate WHO publicaions – wheth-er for sale or for noncommwheth-ercial distribuion – can be obtained from Publishing and Sales, World Health Organizaion, Regional Oice for South- East Asia, Indraprastha Estate, Mahatma Gandhi Marg, New Delhi 110 002, India (fax: +91 11 23370197; e-mail: [email protected]).
The designaions employed and the presentaion of the material in this publicaion do not imply the expression of any opinion whatsoever on the part of the World Health Organizaion concern -ing the legal status of any country, territory, city or area or of its authoriies, or concern-ing the delimitaion of its froniers or boundaries. Doted lines on maps represent approximate border lines for which there may not yet be full agreement.
The menion of speciic companies or of certain manufacturers’ products does not imply that they are endorsed or recommended by the World Health Organizaion in preference to others of a similar nature that are not menioned. Errors and omissions excepted, the names of proprietary products are disinguished by iniial capital leters.
All reasonable precauions have been taken by the World Health Organizaion to verify the infor-maion contained in this publicaion. However, the published material is being distributed with-out warranty of any kind, either expressed or implied. The responsibility for the interpretaion and use of the material lies with the reader. In no event shall the World Health Organizaion be liable for damages arising from its use.
Maps disclaimer
The boundaries and names shown and the designaions used on the maps contained in this docu-ment do not imply the expression of any opinion whatsoever on the part of the World Health Organizaion concerning the legal status of any country, territory, city or area or of its authoriies, or concerning the delimitaion of its froniers or boundaries. Doted and dashed lines on maps represent approximate border lines for which there may not yet be full agreement.
Printed in India WHO Library Cataloguing-in-Publicaion data
World Health Organizaion, Regional Oice for South-East Asia.
Tuberculosis control in the South-East Asia Region: annual report 2015.
1. Tuberculosis – prevenion and control 2. HIV 3. Health Resources
4. Data Collecion.
© World Health Organizaion 2015 All rights reserved.
Requests for publicaions, or for permission to reproduce or translate WHO publicaions – wheth-er for sale or for noncommwheth-ercial distribuion – can be obtained from Publishing and Sales, World Health Organizaion, Regional Oice for South- East Asia, Indraprastha Estate, Mahatma Gandhi Marg, New Delhi 110 002, India (fax: +91 11 23370197; e-mail: [email protected]).
The designaions employed and the presentaion of the material in this publicaion do not imply the expression of any opinion whatsoever on the part of the World Health Organizaion concern -ing the legal status of any country, territory, city or area or of its authoriies, or concern-ing the delimitaion of its froniers or boundaries. Doted lines on maps represent approximate border lines for which there may not yet be full agreement.
The menion of speciic companies or of certain manufacturers’ products does not imply that they are endorsed or recommended by the World Health Organizaion in preference to others of a similar nature that are not menioned. Errors and omissions excepted, the names of proprietary products are disinguished by iniial capital leters.
All reasonable precauions have been taken by the World Health Organizaion to verify the infor-maion contained in this publicaion. However, the published material is being distributed with-out warranty of any kind, either expressed or implied. The responsibility for the interpretaion and use of the material lies with the reader. In no event shall the World Health Organizaion be liable for damages arising from its use.
Maps disclaimer
The boundaries and names shown and the designaions used on the maps contained in this docu-ment do not imply the expression of any opinion whatsoever on the part of the World Health Organizaion concerning the legal status of any country, territory, city or area or of its authoriies, WHO Library Cataloguing-in-Publicaion data
World Health Organizaion, Regional Oice for South-East Asia.
Tuberculosis control in the South-East Asia Region: annual report 2015.
1. Tuberculosis – prevenion and control 2. HIV 3. Health Resources
4. Data Collecion.
Tuberculosis control in the South-East Asia Region 2015
Contents
Acronyms ... v
Preface ...ix
1. Introducion ...1
2. The burden of disease caused by TB ... 4
2.1 Esimated TB incidence, prevalence and mortality ...5
2.2 Reporing progress towards global targets ...15
2.3 TB case noiicaion and treatment outcomes ...18
2.4 Community-based surveys to esimate prevalence of pulmonary tuberculosis, annual risk of tuberculosis infecion (ARTI) and mortality due to TB ...33
3. Drug-resistant TB ...36
3.1 Burden of DR-TB ...36
3.2 Response to DR-TB in the Region ...38
4. Addressing the co-epidemics of TB and HIV ...42
4.1 Impact of HIV on TB in the Region ...42
4.2 TB/HIV control aciviies in the Region ...45
5. Laboratory strengthening and other programme areas for TB control ...48
5.1 Strengthening naional laboratory networks ...48
5.2 Paediatric TB ...51
5.3 Public and private partnerships ...52
5.4 Resources for TB control ...54
5.5 Operaional research ...55
5.6 Naional strategic plans ...57
6. WHO support in the Region in 2014 ...58
6.1 Technical assistance in implementaion of STOP TB strategy ...58
6.2 Regional Green Light Commitee (rGLC) ...60
6.3 Strengthening naional laboratory networks ...61
6.4 Capacity-building, informaion exchange ...62
Tuberculosis control in the South-East Asia Region 2015
6.6 Ensuring regular supplies of drugs and improving procurement
and supply management ...63
6.7 Operaional research ...64
6.8 Coordinaion, collaboraion and partnerships ...64
6.9 Monitoring and evaluaion, and TB burden esimates ...64
Country proiles ...67
Bangladesh ...69
Bhutan ...82
Democraic People’s Republic of Korea ...91
India ...99
Indonesia ...112
Maldives ...129
Myanmar ...137
Nepal ...145
Sri Lanka ...155
Thailand ...164
Timor-Leste ...175
Millennium Development Goal country proiles ...183
Situaion analysis of achievement of MDG goal 6 for tuberculosis ...185
Bangladesh ...189
Bhutan ...191
Democraic People’s Republic of Korea ...193
India ...195
Indonesia ...197
Maldives ...199
Myanmar ...201
Nepal ...203
Sri Lanka ...205
Thailand ...207
Tuberculosis control in the South-East Asia Region 2015
Acronyms
ACSM advocacy, communicaion and social mobilizaion AIIMS All India Insitute of Medical Sciences, New Delhi, India ART aniretroviral treatment
ARTI annual risk of tuberculosis infecion ASHA accredited social and health acivist BMU basic management unit
BRAC Bangladesh Rural Advancement Commitee CBCI Catholic Bishops’ Conference of India
CDC US Centers for Disease Control and Prevenion, Atlanta, United
States
CFR case-fatality rate CDH chest disease hospital
CN concept note
COD causes of death
CPMDT community-based programmaic management of drug-resistant TB CPT cotrimoxazole prevenive therapy
CTB child TB
DFID United Kingdom Department for Internaional Development DHS demographic health survey
DOTS directly observed treatment, short course DRS drug resistance survey/surveillance DR-TB drug-resistant tuberculosis
DST drug suscepibility tesing
EQA external quality assessment/assurance
EXPAND-TB expanding access to new diagnosics for tuberculosis
FDC ixed-dose combinaion
Tuberculosis control in the South-East Asia Region 2015
FLD irst-line ani-TB drugs
FIND Foundaion for Innovaive New Diagnosics GDF Global Drug Facility
GENETUP German–Nepal Tuberculosis Project
GF Global Fund to Fight AIDS, Tuberculosis and Malaria GFC global focus countries
GF-TFM Global Fund Transiional Funding Mechanism GLC Green Light Commitee
GLI Global Laboratory Iniiaive HCW health-care worker
HNPSDP Health, Nutriion and Populaion Sector Development Programme HPA Health Protecion Agency, Malé, Maldives
HQ headquarters
HRD human resources development ICRC Internaional Commitee of Red Cross ICTC integrated counselling and tesing centre IDSP integrated disease surveillance project IDU intravenous drug use/r(s)
IEC informaion, educaion and communicaion
IEDCR Insitute of Epidemiology, Disease Control and Research, Dhaka, Bangladesh
IMA Indian Medical Associaion IPT isoniazid prevenive treatment
IPAQT Iniiaive for Promoing Afordable, Quality TB Tests ISTC internaional standards for tuberculosis care
Tuberculosis control in the South-East Asia Region 2015
KAP knowledge, aitude and pracice KNCV Royal Dutch Tuberculosis Associaion LPA line probe assay
MDG(s) Millennium Development Goal(s) MDR-TB mulidrug-resistant tuberculosis MIFA managing informaion for acion MIS management informaion system MSH Management Sciences for Health MoU memorandum of understanding NCDC Naional Centre for Disease Control
NFM New Funding Model
NGO nongovernmental organizaion
NIDCH Naional Insitute of Disease and Chest Hospital NHSO Naional Health Security Oice
NIRT Naional Insitute of Research for Tuberculosis, Chennai, India NITRD Naional Insitute of TB and Respiratory Diseases, New Delhi, India NRL naional reference laboratory(ies)
NSA naional strategy applicaion NSP naional strategic plans
NTI Naional Tuberculosis Insitute, Bangalore, India NTP naional tuberculosis programme
PAL pracical approach to lung health PHC primary health care
PHL Public Health Laboratory, Thimpu, Bhutan PITC provider-iniiated HIV tesing and counselling PLHIV people living with HIV
Tuberculosis control in the South-East Asia Region 2015
PTB pulmonary TB
QA quality assurance
r-GLC regional green light commitee on MDR-TB
RNTCP Revised Naional Tuberculosis Control Programme (India) R&R recording and reporing
RR/MDR-TB Rifampicin resistant/mulidrug-resistant TB RTRL regional TB reference laboratory
SEAR (WHO) South-East Asia Region
SITT integrated tuberculosis informaion system SLD second-line drugs (for MDR-TB)
SNRL supranaional reference laboratory SOP standard operaing procedures STD sexually transmited disease(s) STI sexually transmited infecion(s)
TB tuberculosis
TBCM tuberculosis clinical management
TB/HIV tuberculosis and human immunodeiciency virus TBTEAM TB technical assistance mechanism
TFM transiional funding model
ToT training of trainers
The Union Internaional Union Against Tuberculosis and Lung Disease UNITAID
USAID United States Agency for Internaional Development VCCT voluntary conidenial counselling and tesing VCTC voluntary counselling and tesing centre VR vital registraion
Tuberculosis control in the South-East Asia Region 2015
Preface
The WHO South-East Asia Region coninues to bear a signiicant burden of tuberculosis despite making signiicant progress in the global eforts to eliminate TB. Although noiied TB cases have been steadily increasing, a decline in the prevalence is seen in all Member States, some reporing more than 50% decline since 1990. With good implementaion of DOTS by Member States, the level of “muli-drug-resistant” (MDR) TB among newly-detected cases is low. The Region has achieved the target of halving the TB mortality rate, but we cannot be complacent at this stage, as we need to accelerate our eforts to strengthen the TB control programmes in all Member States to achieve further reducion in mortality due to TB. This report is an excellent review of the current status and future plans for the control of TB in the SEA Region.
While the advancements in tuberculosis control over the past two decades are substanial, they are far from enough to ensure progress towards eliminaion of TB. Challenges of inadequate coverage and weak performance of health services limit access to high-quality tuberculosis care in some of the countries. Further, many public and private health-care providers remain delinked from naional tuberculosis control eforts. In addiion, tuberculosis is a disease of the poor and the absence of universal health coverage aggravates the economic burden of TB on the poor. This hardship is compounded by a lack of social protecion mechanisms to address associated income loss and non-medical costs. The weaknesses in health systems have limited the linkages that are required across social sectors in order to address poverty, undernutriion and the risk factors that adversely inluence the health outcomes of people alicted by tuberculosis and their vulnerability to it. Childhood TB coninues to be a neglected health concern in countries due to the non-availability of an explicit diagnosic tool to detect TB among children.
Tuberculosis control in the South-East Asia Region 2015
WHO has released its post-2015 Global TB Strategy called “End TB Strategy” through resoluion WHA67.1 endorsed by the Sixty-seventh World Health
Assembly in May 2014. The new strategy aims to eliminate TB by 2035. To achieve this ambiious target, countries require stronger commitment, more concerted eforts and speciic strategies and support to accelerate progress in prevening disease and deaths, and expand access to needed intervenions and new tools.
This annual report is a compilaion of regional and country-speciic achievements, challenges and plans. WHO will coninue to provide technical support to catalyse and accelerate the implementaion of TB care and control in Member States through a range of aciviies as detailed in this report. I am sure that with the commitment of ministries of health and support from all partners and stakeholders, the Region will achieve the desired targets and lead the global ight against TB.
Introduction
1
Tuberculosis remains one of the major public health concerns in the South-East Asia Region of WHO. The Region accounts for 38% of the global burden of tuberculosis (TB) in terms of incidence. It is esimated that about 3.4 million new cases of TB occur each year and about 440 000 people died of this disease in 2013, most of these in ive countries, namely, Bangladesh, India, Indonesia, Myanmar and Thailand, which are among the 22 high-TB-burden countries in the world. Levels of mulidrug-resistance are lower than 2.2% among new cases and 16% among retreatment cases; however, this translates into nearly 89 000 esimated muli-drug-resistant TB (MDR-TB) cases among all TB cases noiied in 2013. In 2013, 43% of TB paients knew their HIV status and HIV-posiive TB paients were 6.1%. While 88% of HIV-posiive TB paients were on cotrimoxazole prevenive therapy, 81% were on aniretroviral therapy.
In terms of progress in TB control, all 11 Member States have sustained country-wide access to directly observed treatment, short-course (DOTS). Each year, more than 2 million TB cases are being registered for treatment and the treatment success rate among new smear-posiive (NSP) pulmonary TB (PTB) cases has remained above 85% since 2005, and was 88% in the 2012 cohort. The TB mortality rate has decreased more than 50% since 1990 and the Region already achieved the global target of a 50% reducion by 2015. The decline in the prevalence is observed in all Member States with some reporing as over 50%
decline.
Tuberculosis control in the South-East Asia Region 2015
MDR-TB cases in the Region. A regional green light commitee on MDR-TB (r-GLC)
has been established to provide technical guidance to countries of the Region
Tuberculosis control in the South-East Asia Region 2015
notes to the New Funding Model of the Global Fund based on revised naional strategic plans and as per the need ideniied through in-depth analysis of country epidemiology. Addiional support is received through several bilateral agreements with donor governments and agencies including USAID TBCARE I and II in Indonesia and Bangladesh respecively, through 3 MDG and USAID funds in Myanmar and USAID in India. Other global iniiaives such as (UNITAID), the Global Drug Facility, the Global Laboratory Iniiaive, the EXPAND TB PROJECT, TB REACH and the Stop TB partnership are helping to mobilize resources for the diagnosis and treatment of all forms of TB towards achieving universal case detecion and treatment.
While considerable progress coninues to be made, naional TB control programmes face a number of challenges that relate to uncertainies regarding sustainable inancial and operaional resources, limited technical and
management capacity, weak procurement and supply management mechanisms, and naional laboratory networks which, in turn, are slowing the planned
expansion of early and enhanced case detecion and intervenions for TB/HIV and DR-TB. Though collaboraion with other sectors is steadily increasing, the provision of care by all health-care providers is not suiciently linked to naional programmes to make an impact at the naional level. Low community awareness and uilizaion of services hamper the uptake of services and it is increasingly being recognized that atenion needs to be paid to addressing the social, economic and behavioural determinants that impact TB, if naional eforts to combat TB are to succeed in the longer term.
The burden of disease
caused by TB
2
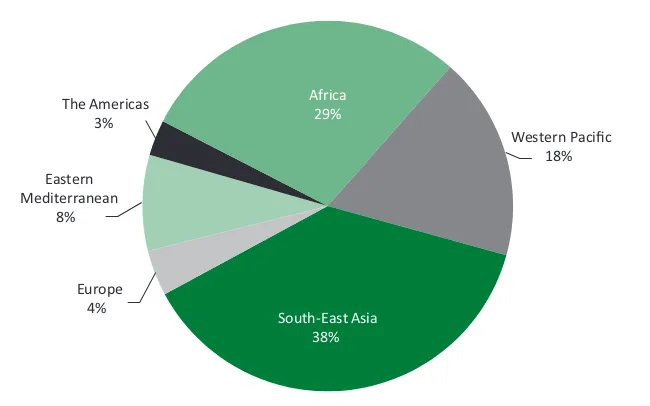
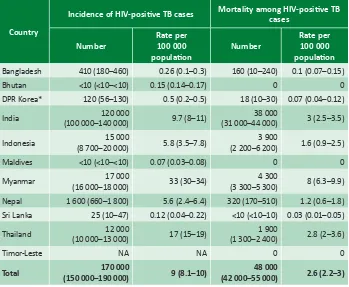
The WHO South-East Asia Region (SEAR) with nearly one fourth of the world populaion accounts for 38% morbidity and 39% mortality of the global burden of tuberculosis, with an esimated 4.5 million prevalent and 3.4 million incident cases and 440 000 deaths in 2013 (Figures 1a and 1b). Five of the 11 Member countries in the Region are among the 22 high-burden countries, with India alone accouning for 23% of the world’s incident cases and 21% of world deaths for TB. Among all new TB cases detected in 2013 in the Region, most cases occured among young adults, paricularly in the most producive age group of 25–34 years; males are more afected with a male-to-female raio of 1:5.
Figure 1a: Estimated incidence of all forms of TB, classified by WHO Region, 2013
Eastern Mediterranean
8% The Americas
3%
Africa 29%
Western Pacific 18%
South-East Asia 38% Europe
Tuberculosis control in the South-East Asia Region 2015
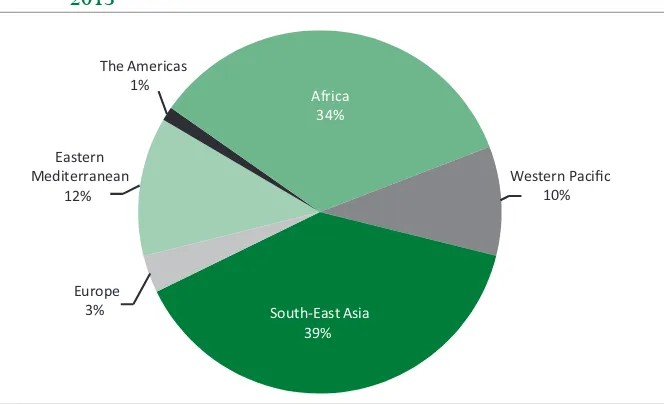
Figure 1b: Estimated mortality of all forms of TB, classified by WHO Region, 2013
Eastern Mediterranean
12%
The Americas 1%
Africa 34%
Western Pacific 10%
South-East Asia 39% Europe
3%
Esimated global TB mortality = 1 100 000 (980 000 – 1 300 000) cases (all forms of TB)
Source: Global Tuberculosis Control: WHO report 2014, World Health Organizaion, Geneva 2014. WHO/HTM/TB/2014.08
2.1 Estimated TB incidence, prevalence and mortality
2.1.1 Enhancement of TB burden estimates in
South-East Asia Region (SEAR)
TB burden esimates for SEAR are calculated according to WHO methods1 and are published as best esimates with uncertainty intervals that provide a range of plausible values. Their width is inversely proporional to the accuracy of the esimate, depending on quality and coverage of data source from countries in the
Region.
Some of the country esimates are not oicially endorsed by Member States, as revision of esimates is an ongoing process or esimates are considered to be based on poor assumpions. All countries are strongly encouraged to improve their TB burden esimates though available methods: in-depth analysis of available data, systemaic assessment of the quality and coverage of surveillance
The burden of disease caused by TB
data, operaional research, prevalence and mortality surveys. Besides short-term means to improve esimates, countries should strengthen TB surveillance and vital registraion (VR) systems in order to achieve the ulimate goal of direct measurement of incidence and mortality using noiicaion and vital registraion data respecively.
Esimates of TB burden between 2009 and 2014 in all countries in the South- East Asia Region were discussed, during a regional workshop held in 2009 and addiionally, during in-country workshops in some countries (in India two naional consultaions were organized in 2011 and 2012). These interacions were useful to collect informaion to esimate TB incidence through the indirect method based on esimated case-detecion rate combined with noiicaion data; this method was applied to most countries in the Region. Case-detecion rate of all forms of TB was esimated through in-depth analysis of available surveillance data, of access to health and programmaic management of TB, and expert opinion on proporion of cases not detected or not captured by TB surveillance. Trends over ime were calculated considering changes of case-detecion rate in diferent years, except for Bhutan and India where results from repeat annual risk for tuberculosis infecion (ARTI) surveys were used as well. For Thailand, incidence trends were esimated using mortality tends that are based on VR data; this approach was considered more accurate than derivaion of trends using other parameters. For Myanmar and Thailand, models to calculate incidence based on results of prevalence survey (using esimated duraion of disease) were elaborated; however, due to considerable uncertainly around esimates obtained with this method, incidence esimates rely on general method based on noiicaion and case-detecion rates. Informaion was inadequate for ime series analysis for Bangladesh, Sri Lanka and Timor-Leste and the incidence trend was considered lat, “frozen” at the value of most recent point esimate.
Tuberculosis control in the South-East Asia Region 2015
based on data from two naional tuberculin surveys (conducted in 2000 and 2010) and annual noiicaion data, the annual rate of decline in TB incidence was assessed to be progressively increasing from 0.5% in early 2000 to around 2.5% from 2007 onwards.
For most countries In the Region, prevalence was esimated using the indirect method, muliplying incidence by esimated duraion of TB disease. This type of esimate is the most uncertain of the three TB burden indicators, because it is the product of two uncertain quaniies, incidence and disease duraion that cannot be measured directly, and leads to large uncertainty intervals in most of the countries. Prevalence was esimated based on results of prevalence survey (direct method) only for Myanmar and India. In Myanmar, the 2009 prevalence rate is based on the results of the prevalence survey, and esimates for 1990–2008 and 2010–2013 are based on survey-imputed data. In India, no naionwide prevalence survey was conducted, given the size of the country and logisics and cost implicaions; however, the India 2010 prevalence rate was calculated using results from pooled subnaional surveys; similarly to Myanmar, 1990–2009 and 2011–2013 esimates are based on survey-imputed data. In the South-East Asia Region, other countries conducted prevalence surveys. Bangladesh conducted a survey in 2010, but the methodology used is not recommended by WHO and results were not considered accurate enough to directly measure prevalence rate. Thailand and Indonesia completed a prevalence survey in 2012 and 2013 respecively. However, at the ime of wriing this report, revised esimates based on survey results were not yet available and approved by respecive governments. Esimates for Democraic People’s Republic of Korea are based on data provided by the naional TB programme.
The burden of disease caused by TB
For India, data from six large community-based subnaional mortality surveys conducted between 2003 and 2008, using verbal autopsy and methodology endorsed by the Registrar General of India, were also used. Addiional informaion on TB mortality has emerged from a community-based prospecive mortality survey covering the period 2002–2007. All data were pooled to obtain a naional esimate and to derive a complete ime-series for 1990–2012 (esimates for 2013 were imputed based on this ime series); current esimates are higher than previous indirect esimates. Further informaion will be available from a large naionally-representaive community-based prospecive all-causes mortality survey (the One Million Deaths study), accouning for deaths from 1998–2014, conducted by the Registrar General of India with the support of other partners.
In the Region, progress towards enhancement of burden esimates as well as strengthening TB surveillance is being made.
Nepal is planning to upgrade the OpenMRS plaform used for drug-resistant cases for drug-suscepible TB in 2015. India successfully transiioned its electronic recording and reporing system (EPI Centre sotware) to a Windows- based plaform and developed a case-based, web-based noiicaion system (Nikshay), available also as a mobile applicaion, that is being used widely also within the private sector; TB was made a mandatorily noiiable disease impacing completeness of TB case noiicaion. Thailand rolled out a naionwide electronic database (TB Clinical Management - TBCM), developed to improve real ime reporing and case management; the country is now focusing on its integraion into the naional HMIS system. Indonesia is transiioning to SITT (Integrated TB Informaion System), a naional web- and case-based electronic recording and reporing system that was in place in 87% of districts by 2014; in the next implementaion phase, health faciliies are expected to upload their data directly into SITT. Indonesia is also scaling up its sample VR system. Bangladesh is replacing the paper-based informaion system with the eTB manager in a phased manner; the eTB manager has already been implemented in 210 districts and further expansion is ongoing.
Tuberculosis control in the South-East Asia Region 2015
In 2014, Thailand and Indonesia developed protocols for inventory studies, based on WHO guidelines2, to improve their burden esimate by measuring the under-noiicaion enity; these studies also provide valuable informaion about where eforts to collaborate with public and private sector providers are needed.
Sri Lanka conducted an in-depth analysis of data in 2010. In 2013, Timor-Leste conducted a comprehensive TB epidemiological assessment with the primary objecive of evaluaing the eiciency and reliability of case-inding under NTP and accuracy of noiicaion data and to revise current burden esimates.
In the last few years, several countries in the Region were conducing or are planning populaion-based TB prevalence surveys to provide direct measurement of prevalence as well as useful informaion about why and to what extent people with TB are missed out. Among global focus countries (GFC), Thailand concluded ield operaions of its second naional TB prevalence survey in 2012–2013 (the irst was conducted in 2006); preliminary results from non-Bangkok clusters are available, but data are being further analysed and adjusted prior to publicaion of the inal result. Indonesia concluded ield operaions in 2013 and inal results are under discussion for oicial approval; new burden esimates are expected to have an impact on overall regional esimates as well as global esimates. Myanmar is planning to repeat the prevalence survey in 2017 (the irst was conducted in 2009) to provide direct measurement of point prevalence and trend over ime. Bangladesh is planning to start ield implementaion of the prevalence survey done according to WHO recommended methodology in 2015; study protocol, implementaion plan, procurement and standard operaion procedures were inalized by 2014. Among non-GFC, Nepal and Democraic People’s Republic of Korea have both developed the protocol and implementaion plan and ield operaions should start by 2015.
2.1.2 Estimated TB incidence, prevalence and
mortality in South-East Asia Region
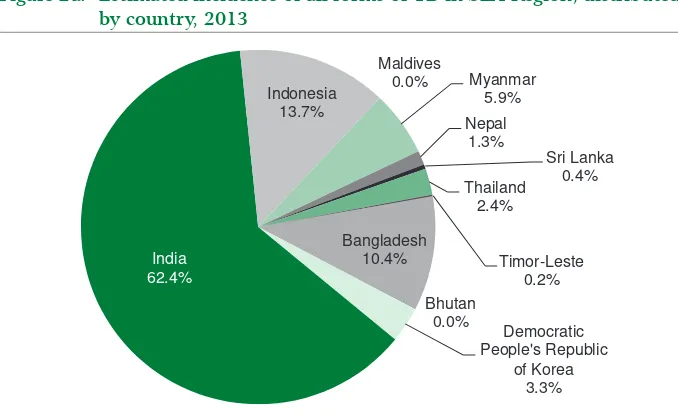
As indicated earlier, South-East Asia Region has a high burden of TB. Contribuion of each country to the overall regional burden is uneven and India carries most of the incident and prevalent cases as well as deaths in the Region (Figures 2a, 2b and 2c)3; Bangladesh and Indonesia also contribute a high proporion of cases and the former contributes an important proporion of TB deaths.
2 “Assessing tuberculosis underreporing through inventory studies”. Geneva, World Health Organizaion, 2013 (WHO/HTM/TB/2012.12)
The burden of disease caused by TB
Figure 2a: Estimated incidence of all forms of TB in SEA Region, distributed by country, 2013
Esimated regional TB incidence = 3 264 000 (3 129 000 – 3 713 000) cases (all forms of TB) Source: Global Tuberculosis Control: WHO report 2014, World Health Organizaion, Geneva 2014. WHO/HTM/TB/2014.08
Tuberculosis control in the South-East Asia Region 2015
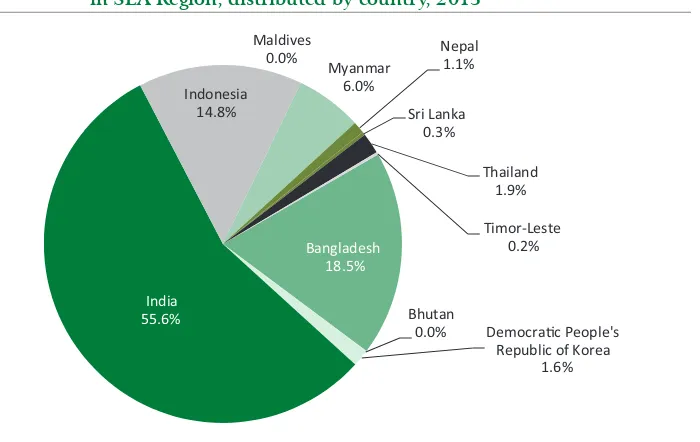
Figure 2c: Estimated mortality for TB (excluded among HIV-positive patients) in SEA Region, distributed by country, 2013
Bangladesh 18.5%
Bhutan
0.0% Democrac People's
Republic of Korea
Esimated regional TB mortality = 432 000 (265 000 – 625 000) deaths for TB excluding deaths among HIV posiive paients
Source: Global Tuberculosis Control: WHO report 2014, World Health Organizaion, Geneva 2014. WHO/HTM/TB/2014.08
Although India certainly carries a high burden in terms of absolute numbers of TB cases and deaths, in terms of rates, other countries in the Region, such as Bangladesh, Democraic People’s Republic of Korea, Myanmar and Timor-Leste carry a higher burden. The TB incidence, prevalence and mortality rates in Member States of the Region, esimated as discussed in paragraph 2.1.1., are presented in Table 1. New esimates for Indonesia, although not yet inalized and approved, suggest a greater burden than previously esimated, and consequently, are expected to have a signiicant impact on overall esimates for the Region.
The burden of disease caused by TB
Table 1: Estimates of TB disease incidence, prevalence and mortality in Member States of the South-East Asia Region (rates per 100 000 population), 2013
Bangladesh** 156 596 224 (199–253) 402 (210–656) 51 (33–69)
Bhutan 754 169 (156–190) 196 (67–393) 12 (6.9–23)
Democraic People’s Republic of Korea ****
24 895 429 (401–456) 536 (146–1175) 27 (12–46)
India 1 252 140 171 (162–184) 211 (143–294) 19 (12–28)
Indonesia*** 249 866 183 (164–207) 272 (138–450) 25 (14–37)
Maldives 345 40 (34–44) 57 (27–97) 2.2 (1.8–2.6)
Myanmar 53 259 373 (340–413) 473 (364–595) 49 (29–71)
Nepal 27 797 156 (139–178) 211 (99–365) 17 (7.4–27)
Sri Lanka 21 273 66 (59–75) 103 (53–170) 5.9 (4.7–7.3)
Thailand 67 011 119 (106–134) 149 (72–252) 12 (7.3–18)
Timor-Leste 1 133 498 (409–596) 802 (382–1375) 87 (48–141)
SEAR 1 855 068 183 (175–192) 244 (188–307) 23 (18–30)
* United Naions, Department of Economic and Social Afairs, Populaion Division (2013). World Populaion Prospects: The 2012 Revision, DVD Ediion.
** The esimated incidence, prevalence and mortality rates should be considered provisional as they have not yet been oicially approved by the Naional TB Programme of Bangladesh
*** Burden esimates for Indonesia are being revised based on prevalence survey results; at the ime of wriing this report new esimates have not yet been oicially released
**** Democraic People’s Republic of Korea
Tuberculosis control in the South-East Asia Region 2015
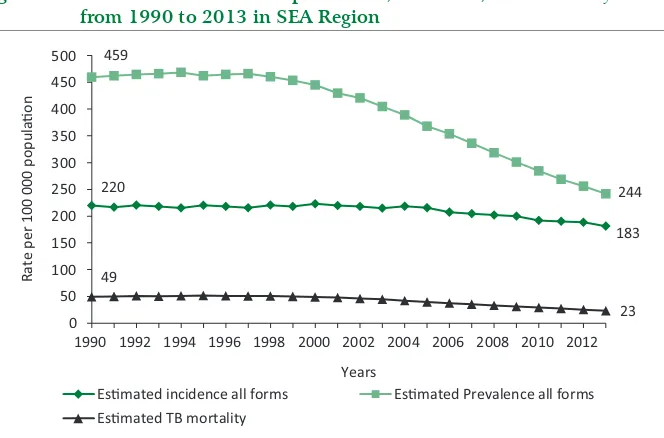
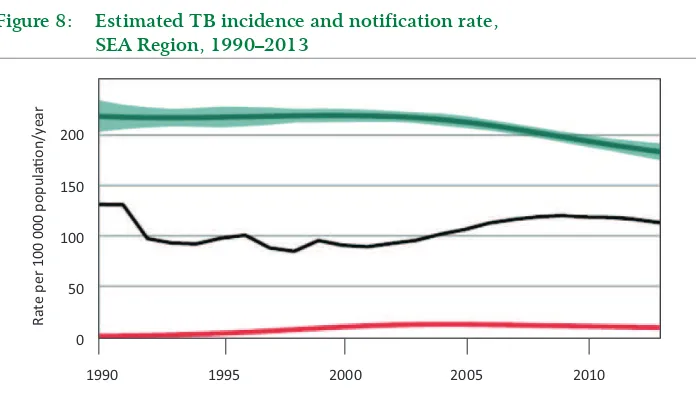
The trends of esimated prevalence, incidence and mortality rates in the Region as a whole are presented in Figure 3. Since 1990, the TB prevalence rate has decreased by 47% and the mortality rate by 53%. The decline in incidence is less percepible (overall decrease by 17%), but the tendency began to revert. In the last ive years, annual reducion is about 2%, 5% and 6.5% for incidence, prevalence and mortality respecively. However, the interpretaion of trends should take into account the uncertainty bounds around each value (see Figures 6, 7 and 8). Uncertainty bounds are narrower around incidence (from early 2000s are around 5% deviaion from best esimates, with slightly larger deviaion in 2012–2013 especially for the upper bound) than prevalence and mortality (for both the deviaion from best esimates is around 25%, slightly narrower ater 2010).
Figure 3: Trends in estimated TB prevalence, incidence, and mortality rates from 1990 to 2013 in SEA Region
220
1990 1992 1994 1996 1998 2000 2002 2004 2006 2008 2010 2012
Rate
Esmated incidence all forms Esmated Prevalence all forms Esmated TB mortality
183
23
Source: Global Tuberculosis Control: WHO report 2014, World Health Organizaion, Geneva 2014. TB_burden_countries_2015-01-18.cvs - htps://extranet.who.int/tme/generateCSV. asp?ds=esimates
The burden of disease caused by TB
respecively per 100 000 populaion between 1990 and 2013 in each of the 11 Member States of the Region. For Timor-Leste, the baseline is set at 2002, due to non-availability of naional data in 1990. As in Figure 3, this comparison takes into consideraion only the best esimates of prevalence and mortality rates. Taking into account this limitaion, a decline in the prevalence rates is observed in all Member States, except Democraic People’s Republic of Korea, and in three countries it is very signiicant, beyond 50%, that is one of the Stop TB Partnership targets for 2015. A signiicant decline in the mortality rates is observed in all Member States and in seven countries, the decrease is already beyond 50% of the 1990 baseline. Further analysis of trend of burden esimates per country is available in the chapter “Millennium Development Goal Country Proiles”.
Figure 4: Estimated prevalence rate (all forms of TB) in 1990* and 2013, by Member States of SEA Region
0
Rate per 100 000 popula on
1990 2013
* For Timor-Leste, the baseline is 2002. ** Democraic People’s Republic of Korea
Tuberculosis control in the South-East Asia Region 2015
Figure 5: Estimated mortality rate (excluding HIV) in 1990* and 2013, by Member States of SEA Region
0
Rate per 100 000 populaon
1990 2013
*For Timor-Leste, the baseline is 2002. ** Democraic People’s Republic of Korea
Source: Global Tuberculosis Control: WHO report 2014, World Health Organizaion, Geneva 2014. WHO/HTM/TB/2014.08
2.2 Reporting progress towards global targets
As showed in the previous secion, SEAR is performing well in terms of reducion of TB burden. Analysis of progress towards the achievement of Millennium Development Goal (MDG) 6, to combat HIV/AIDS, malaria and other diseases, with regard to tuberculosis control, shows that the Region has achieved or is well on track to halt and begin to reverse the incidence of tuberculosis by 2015, and halve the TB death and prevalence rates by 2015, compared with 1990 levels.
The burden of disease caused by TB
Figure 6: Trends in estimated TB prevalence rate 1990–2013 and forecast TB prevalence rate 2014–2015, SEA Region
Ra
te
per 100 000 populaon/y
ear
400
200
0
1990 1995 2000 2005 2010 2015
Note: shaded areas represent uncertainty bands. The horizontal dashed lines represent the Stop TB Partnership target of a 50% reducion in the prevalence rate by 2015 compared with 1990 Source: Global Tuberculosis Control: WHO report 2014, World Health Organizaion, Geneva 2014. WHO/HTM/TB/2014.08
Tuberculosis control in the South-East Asia Region 2015
Figure 7: Trends in estimated TB mortality rate 1990–2013 and forecast TB prevalence rate 2014–2015, SEA Region
Ra
te
per 100 000 populaon/y
ear
60
40
20
0
1990 1995 2000 2005 2010 2015
Note: shaded areas represent uncertainty bands. The horizontal dashed lines represent the Stop TB Partnership target of a 50% reducion in the prevalence rate by 2015 compared with 1990 Source: Global Tuberculosis Control: WHO report 2014, World Health Organizaion, Geneva 2014. WHO/HTM/TB/2014.08
The burden of disease caused by TB
Figure 8: Estimated TB incidence and notification rate, SEA Region, 1990–2013
Ra
te
per 100 000 populaon/y
ear
200
150
100
50
0
1990 1995 2000 2005 2010
Source: Global Tuberculosis Control: WHO report 2014, World Health Organizaion, Geneva 2014. WHO/HTM/TB/2014.08
Besides the MDG goal, Table 2 includes informaion regarding the status of the Region toward the achievement of addiional targets of the Global Plan to STOP TB 2011–2015. Further details are provided in the following secions.
Tuberculosis control in the South-East Asia Region 2015
Table 2: Summary of situation towards MDG targets and Stop TB strategy targets for South-East Asia Region in 2013
Category Indicator Target SEA Region
TB burden
Incidence rate (per 100 000 populaion) 1990 level falling
Target: <220 Result: 183 Prevalence rate (per 100 000
populaion) 50% of 1990 level
Target: ≤230 Result: 244 Mortality rate (per 100 000 populaion) 50% of 1990
level
Target: ≤25 Result: 23
Treatment Treatment success rate (annual cohort) ≥85% 88%
Tb case detecion
Number of cases noiied and treated
(all new and relapse) N/A 2 098 170
Case detecion rate (all types) ≥70% 62%
TB/HIV
% of TB paients tested for HIV 100% 43%
% of HIV-posiive TB paients treated
with ART 100% 81%
MDR-TB
% of esimated MDR-TB cases noiied ≥50% 30%
% of previously treated TB paients
tested for MDR-TB 100% 6%
% of new TB paients tested for MDR-TB 20% 1%
Treatment success rate (annual cohort
- 2011) ≥75% 54%
Laboratory
Number of laboratories with sputum
smear microscopy per 100 000 pop. ≥1 0.8
Number of laboratories with culture
and DST per 5 million pop. ≥1 0.2
(N.B. for indicators that have conidence intervals, only the best esimate is shown) Source: Global Tuberculosis Control: WHO report 2014, World Health Organizaion, Geneva 2014. WHO/HTM/TB/2014.08
In 2013, WHO issued an updated recording and reporing (R&R) framework4
including new deiniions of TB cases that were necessary to improve aspects of the previous framework (i.e. more comprehensive reporing of TB cases among children) and accommodate diagnosis using Xpert MTB/RIF and other WHO-endorsed molecular tests. In this report, for the irst ime, data on noiicaions and outcomes are reported according to the new R&R framework. Most of the countries are sill transiioning to the new R&R framework, but were able to report the majority of the requested informaion.
The burden of disease caused by TB
2.3.1 Case notifications in 2013
Table 3 shows the absolute numbers of cases noiied by type of TB, in each Member country for the year 2013. The 11 Member countries of SEAR altogether noiied 2 297 033 cases of tuberculosis; of these 2 098 170 cases had a new episode of tuberculosis (new and relapses, all forms) which represents a case-noiicaion rate of 113 per 100 000 populaion and 198 863 (9% of the total) were previously treated cases (already been diagnosed with TB but treatment was changed to a retreatment regimen). Of the new episodes of TB, 1 968 356 (94%) had TB for the irst ime (all new cases) and 129 814 (6%) experienced a recurrent episode of TB ater being previously cured of the disease (relapse); of all new pulmonary cases and relapse, 50% were new bacteriologically conirmed PTB cases, 28% were new clinically diagnosed pulmonary TB cases and 16% were new extra-pulmonary TB cases. Five countries in the Region (Bangladesh, India, Indonesia, Myanmar and Thailand), which belong to the global list of 22 countries with the highest burden of TB (HBCs), noiied a total of 2 142 188 cases, or 93% of all cases noiied in the Region.
There was a decrease of 1.5% in the numbers of cases (all forms) noiied in 2013 as compared to 2012 (Table 3); this small decrease is mainly driven by new pulmonary TB, clinically diagnosed.
About half of all noiied new cases in the Region (54%) were new bacteriologically conirmed pulmonary TB cases (Figure 9). Bhutan (42%), Democraic People’s Republic of Korea (37%), this proporion was considerably lower in Myanmar (33%); on the other hand, the proporion was substanially higher in Indonesia (62%) and Maldives (71%).
Amongst all new cases of pulmonary TB, 64% were bacteriologically conirmed in the Region as a whole, ranging from 38% in Myanmar to 78% in Bhutan.
Tuberculosis control in the South-East Asia Region 2015
Table 3: Estimated incidence (number in thousands) and cases notified (by type of TB patients) in Member States, SEA Region, 2013
Country
Bangladesh (310–400)350 105 539 42 394 33 704 2 869 6 385 190 891
Bhutan (1.2–1.4)1.3 425 120 471 64 35 1 115 Indonesia (410–520)460 196 310 103 888 17 420 7 964 1 521 327 103
Maldives (0.12–0.15)0.14 80 0 33 1 0 114
Myanmar (180–220)200 42 595 70 519 16 887 4 854 7 307 142 162
Nepal (39–49)43 15 099 8 367 8 140 2 228 1 604 35 438
3700) 1 065 852 594 720 338 303 131 245 201 335 2331455 Percentage change
2013 vs. 2012 -1.1% -2.5% -1.4% -1.1% -1.2% -1.5%
*According to the new R&R framework, relapse cases should be reported as bacteriologically-conirmed or clinically diagnosed; all SEAR countries reported only bacteriologically-conirmed relapses, except Indonesia that reported 6406 bacteriologically-conirmed relapses and 1558 clinically-diagnosed relapses.
**** Democraic People’s Republic of Korea
The burden of disease caused by TB
Consistent with development in TB diagnosic capacity and laboratory network in SEAR, the distribuion of new cases by type has changed considerably since 1995, with an increase in the proporion of bacteriologically conirmed PTB cases (basically corresponding to smear-posiive cases) and extra-pulmonary cases, and a decrease in clinically diagnosed pulmonary TB cases (Figure 10). The described trend was very marked unil 2006, but coninued at a lower pace unil 2013.
Figure 9: Proportion of bacteriologically confirmed pulmonary TB (PTB), clinically diagnosed PTB and extra-pulmonary TB cases out of all new notified cases, Member States, SEA Region, 2013
0
Indonesia Maldives Myanmar
Nepal
Sri Lanka Thailand
Ti
Tuberculosis control in the South-East Asia Region 2015
Figure 10: Distribution of annually notified new TB cases by type, SEA Region, 1995–2013
0 10 20 30 40 50 60 70 80 90 100
1995 1996 1997 1998 1999 2000 2001 2002 2003 2004 2005 2006 2007 2008 2009 2010 20
11
2012 2013
New TB cases nofied by type (%)
Year New extrapulmonary
New pulmonary TB, clinically diagnosed New pulmonary TB, bacteriologically confirmed
Sources: Annual Reports, Naional TB programmes, SEAR Member States, 2014.
The burden of disease caused by TB
Figure 11: Proportions of different types of TB according to previous
treatment history among all cases reported, Member States of SEA Region, 2013
Indonesia Maldives Myanmar
Nepal
Sri Lanka Thailand
Ti
Previously treated Relapse All new
* Democraic People’s Republic of Korea
Sources: Annual Reports, Naional TB programmes, SEAR Member States, 2014
The proporion of relapse cases out of all newly noiied (new and relapse) cases was ranging between 1% in Maldives and 8% in Democraic People’s Republic of Korea and with a regional average of 6%. This proporion was rather stable during the last decade for most of the countries in the Region. An increasing trend in the proporion of relapse cases was observed in the Democraic People’s Republic of Korea (from 1% in 200 to 7% in 2013) and India (from 3% in the early 2000s to around 8% in the last ive years); Myanmar showed a consistent decrease in the proporion of relapses since 1995, although since 2007, the proporion has stabilized at around 3.5%.
Tuberculosis control in the South-East Asia Region 2015
cases are included in the age and sex distribuion for Bhutan, Indonesia, Maldives and Sri Lanka only. India and Timor-Leste reported breakdown only by two age groups (0–14 and 15 and above years); addiionally, Timor-Leste disaggregated by sex. Figures 12a and 12b show the distribuion of all new cases by age and sex in 2013, in the Region as a whole (using data available only); 53% of the cases belonged to the most producive age groups between 15–44 years; 50% among males and 59% among females. In terms of rate, the most afected age group is 45 years and above, with the highest rate among men aged 55–64 years (376 per 100 000 populaion) and more than 65 years (338 per 100 000 populaion). This progressive increase of noiicaion rates from younger to older age groups and the shit of disease burden to older age groups suggests that in the South-East Asia Region, the transmission of TB may be declining and levels of infecion in younger age groups may be falling; however, this patern is less visible among women and variability among countries is sill high.
Figure 12a: Age and sex distribution of all notified new TB cases in SEA Region* (in numbers), 2013
0 10 000 20 000 30 000 40 000 50 000 60 000 70 000 80 000
0–14 15–24 25–34 35–44 45–54 55–64 65+
Number of new
T
B cases nofied
Age group Male Female
* Includes only data from Bangladesh, Bhutan, Democraic People’s Republic of Korea , Indonesia, Maldives, Nepal and Sri Lanka
The burden of disease caused by TB
Figure 12b: Age and sex distribution of all notified new TB cases in SEA Region* (rate per 100 000), 2013
0 50 100 150 200 250 300 350 400
0–14 15–24 25–34 35–44 45–54 55–64 65+
New TB cases nofied per 100 000 populaon
Age group Male Female
* Includes only data from Bangladesh, Bhutan, Democraic People’s Republic of Korea, Indonesia, Maldives, Nepal and Sri Lanka
Sources: Annual Reports, Naional TB programmes, SEAR Member states, 2014
In 2013, among all new TB cases, the percentage of paediatric cases was 5.5 for the whole Region (including data from all countries except Myanmar and Thailand) with almost no diference among males and females. There is variability among countries, with Nepal and Bangladesh reporing the lowest proporion of paediatric cases among all new TB cases (2.7% and 2.8% respecively) and Maldives, India and Indonesia reporing the highest (9% Maldives and 8% India and Indonesia). In 2013, breakdown by 0–4 and 5–14 years was reported by Bangladesh, Bhutan, Democraic People’s Republic of Korea, Indonesia, Maldives, Nepal and Sri Lanka: globally in these countries the proporion of new TB cases aged 0–4 years was 36% among all paediatric cases and 2% among all cases; Indonesia had the highest proporion of 0-4 year old paients being 45% among all paediatric cases and 3.6% among all cases.
Tuberculosis control in the South-East Asia Region 2015
increased from 1.0 to 2.7 in the age groups from 0–14 years to 65+ years; in cases younger than 24 years, there is no diference between males and females. The same patern in sex distribuion is observed when data are expressed in numbers or rates (Figure 12). Several studies showed that this inding could be explained by higher suscepibility to TB in males ater adolescence due to biological factors, as well as by socioeconomic determinants that create higher exposure to risk factors (such as smoking and alcohol) in men and under noiicaion in women due to gender-based unequal access to care and greater sigma.
2.3.2 Trends in case notification (1995–2013)
Figure 13 shows the trends in the numbers of cases noiied in the Region since 1993, for all forms of TB (including all new cases and relapses) and new bacteriologically conirmed cases (mainly corresponding to smear-posiive cases, since R&R systems at country level were not capturing them; yet cases were conirmed through Xpert MTB/RIF or other tests). Noiicaions coninued to increase over the last decade, relecing case-inding eforts in Member States over ime, with a sharper increase in noiicaions of all forms of TB, especially from 2000 to 2009, possibly due to increasing registraion of smear-negaive and extra-pulmonary cases following the involvement of the private sector and medical teaching insituions. From 2009, the number of annually noiied cases was stagnaing and in the last three years, it was slightly decreasing, despite ongoing eforts to strengthen TB control in most countries. This is likely the result of decreasing incidence and prevalence of TB in some countries in the Region, paricularly India. Some countries (i.e. Myanmar, Nepal, etc.) reported that the introducion of Xpert MTB/RIF contributed to reduce the overdiagnosis of clinically conirmed TB cases, thus parially explaining reducion of all TB cases in recent years.The trends in noiicaion rates of all TB cases (all new and relapses) for the ive high-burden countries and other (intermediate and low-burden) countries in the Region are presented in Figures 14a and 14b respecively.
In Bangladesh, an increasing trend was observed unil 2006 following which noiicaion rates have remained fairly stable, although a further overall increase occurred unil 2013 despite annual oscillaions. In India, noiicaion rates
The burden of disease caused by TB
Figure 13: Trends in TB cases notified by type of case, SEA Region, 1993–2013
0
All cases (new and relapse all types)
New bacteriologically confirmed pulmonary TB
Sources: Tuberculosis control in the South-East Asia Region, Annual Reports 1996-2014, WHO/SEARO; Annual Reports, Naional TB programmes, SEAR Member states, 2014
Figure 14a: Trends in annual TB case-notification rates (all forms) for high-burden countries in the SEA Region, 1995–2013
Tuberculosis control in the South-East Asia Region 2015
Figure 14b: Trends in annual TB case-notification rates (all forms) for intermediate and low-burden countries in the SEA Region, 1995–2013
Sources: Tuberculosis control in the South-East Asia Region, Annual Reports 1996-2014, WHO/ SEARO; Annual Reports, Naional TB programmes, SEAR Member States, 2014
The burden of disease caused by TB
by an overall increase in the following years, paricularly in 2009–2011 that relect eforts in case detecion and public–private collaboraive aciviies; however, some luctuaions in noiicaion rate are linked to problems with completeness of R&R, especially in large urban areas and due to extensive network of private
providers.
In the Democraic People’s Republic of Korea, a sharp increase in the noiicaion rates has been observed since 2006, primarily due to introducion of acive case-inding that was adopted as a supplementary strategy, since a big gap was observed between case-noiicaion rates and the revised esimates of the incidence of TB in the country, following a naional tuberculin survey in 2007, which revealed a high ARTI. In Sri Lanka, that together with Maldives is the country with the lowest noiicaion rates in the Region, a small increase in noiicaions was recorded unil 2000, followed by a fairly stable trend unil 2013. In Nepal, some increase in the noiicaion rate was observed in the 1990s but the trend latened without signiicant deviaions unil 2012, despite case-inding eforts and increased coverage of TB services. In 2013, there was a considerable decrease in reported clinically diagnosed pulmonary TB cases, mainly explained by reducion of misdiagnosed cases also due to introducion of Xpert MTB/RIF as iniial diagnosic test among sputum smear-negaive paients. In Bhutan, ater a declining slope unil 2008, strengthening of TB diagnosic capacity and overall TB management as well as potenial overdiagnosis of extrapulmonary TB (over 40% of all annually noiied cases) led to an increase in the noiicaion rate unil 2010, followed by a decreasing trend that is likely to relect the real reducion of TB burden in the country. A consistently declining trend has been observed in Maldives in the last 15 years. The trends in Timor-Leste relect periods of civil strife when services were seriously disrupted for considerable periods of ime; a luctuaing trend relects on one hand the eforts towards case detecion and, on the other, improvement of TB diagnosis with reducion of misdiagnosis of cases.
2.3.3 Treatment outcomes
The treatment success rate among new and relapse TB cases enrolled for
Tuberculosis control in the South-East Asia Region 2015
The overall case-fatality rate (CFR), default and failure rates were 4%, 5% and 1% respecively among new and relapse TB cases registered for treatment in 2012.
In Maldives, the treatment success among new and relapse cases was lower than the target. A relaively high proporion of “not evaluated” is the main reason for not achieving the target. This inding was common also in previous years when assessing treatment outcomes among new smear-posiive cases only. Small numbers in Maldives create high annual luctuaion of igures for other unsuccessful treatment outcomes.
Also, Thailand did not reach the treatment success rate target due to relaively high CFR (7%) and non-evaluated cases (6%), the later probably due to recording and reporing issues that afect overall TB control aciviies. Case-fatality rate may be parially explained by high case fatality among HIV-posiive TB cases (16%) and parially by a high proporion of cases in old age groups that are more prone to die of any cause.
Ater Thailand, the second highest CFR were registered in Sri Lanka (5.5%). In the Region, the highest “lost to follow-up” rates among new and relapse cases were observed in India and Indonesia (6% and 5% respecively); Indonesia also has a high proporion of non-evaluated cases.
32
The bur
den of disease c
aused b
y TB
Table 4: Treatment outcomes expressed as percentage among cases notified in 2012 by type of cases in Member States of the SEA Region
Countries
New and relapse cases* Previously treated cases*
Cases
Tuberculosis control in the South-East Asia Region 2015
2.4 Community-based surveys to estimate prevalence
of pulmonary tuberculosis, annual risk of
tuberculosis infection (ARTI) and mortality due
to TB
A number of community-based surveys have been carried out in the Region at diferent imes to esimate the prevalence of PTB. Most of the surveys conducted were at sub-naional level and the screening methodology varies across the surveys, reducing the comparability of outcomes. The currently recommended methodology (symptom screening and chest X-ray) was applied during naionwide surveys only in Myanmar (2006 and 2010), Thailand (2012) and Indonesia (2013). Screening based on symptoms and X-ray was used also in some subnaional surveys in India (the repeated surveys in Thiruvallur district of Tamil Nadu, Bangalore, Wardha and most recently Gujarat). However, miniature mass radiographs were used which produce a low quality image with less sensiivity than chest radiography with auto-processor or digital technology.
Results of surveys undertaken between 1990 and 2010, already published in the “TB control in South-East Asia, 2013” annual report show large in-country and between-country variability. For surveys conducted between 2011 and 2014, inal results are not yet available and cannot be reported.
Informaion from prevalence surveys have been largely used in the Region to revise burden esimates as well as trends over ime when data from repeated surveys were available.
In India, results from the four rounds of prevalence surveys in Thiruvallur district in Tamil Nadu, between 1999 and 2006, and those conducted in pre-DOTS period (between 1968 and 1986) in the same area were used to esimate an overall decline in the prevalence of smear-posiive as well as culture-posiive PTB, compared with no decline in the pre-DOTS era. Point esimates from the most recent six district/sub-district level surveys show a variable level of TB prevalence in diferent geographical areas and provide important informaion for the revision of naional burden esimates. A state-level prevalence survey in Gujarat was completed in 2012, and preliminary results indicate prevalence levels of TB within the range, although towards the upper limit, of prevalence rates measured during surveys conducted between 2007 and 2009; however, inal results are not yet
The burden of disease caused by TB
In Indonesia, the naional-level prevalence survey conducted during 2004 supported the esimaion of declining trend because it demonstrated a three-fold decline in prevalence rates when compared to results of district-level surveys carried out during the 1980s. Results of 2013 surveys are not yet available, but preliminary data suggest that the prevalence level should be signiicantly revised upward, although a declining trend seems conirmed.
In Bangladesh, the comparability of results from sub-naional prevalence surveys carried out in the early 2000s and the naionwide survey conducted in 2009 was limited by the diferent methodologies adopted. Informaion on point esimates and possibly on trend over ime will be provided by the prevalence survey planned for 2015.
In Myanmar, prevalence esimates were signiicantly revised upward based on the results of the TB prevalence survey in Yangon district in 2006 and the naionwide survey in 2010. Direct measurement of trend will be provided by a repeated survey planned for 2017.
In Thailand, preliminary results from the 2012–2013 prevalence survey are available only for non-Bangkok clusters. Comparison between the 2012–2013 survey and 1991 survey indicates that prevalence of smear-posiive PTB almost halved and bacteriologically posiive PTB also declined, although more slowly. Current esimates are likely to be slightly revised only. However, inal results should account for Bangkok clusters that seem to have considerably higher prevalence than the rest of the country.
Tuberculosis control in the South-East Asia Region 2015
A limited number of TB mortality studies based on vital registraion and veriicaion of the cause of death (COD) through verbal autopsies, have been carried out in the Region. In India, in 2003–2008, a series of large community-based mortality sub-naional surveys were conducted using verbal autopsy and methodology endorsed by the Registrar General in Andhra Pradesh, Orissa, Thiruvallur, Tamil Nadu in one Kolkata slum and in rural Andhra Pradesh. These surveys showed an average TB mortality rate of 36 per 100 000 populaion (range 28–76). Addiional informaion has emerged from the 2002–2007 AIIMS Ballabgarh community-based prospecive mortality survey, which reported TB mortality of 40 per 100 000 person/years. The naionally-representaive One Million Deaths study, accouning for deaths from 2001–2003, has informally reported TB deaths of 77 and 40 per 100 000 person years for men and women respecively; the One Million Death study is sill ongoing to collect informaion about avoidable deaths between 1998 and 2014.
Drug-resistant TB
(DR-TB)
3
3.1 Burden of DR-TB
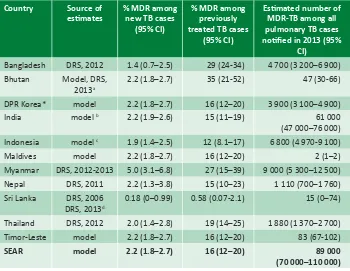
Well-funcioning naional TB control programmes in the Region achieving high treatment success rates have resulted in maintaining the slow but steady decline in TB incidence rates during the past decade. This has also led to low levels (2.2, range: 1.6–2.8%) of MDR among newly-detected cases; the South-East Asia Region and the Americas have the lowest proporion of MDR-TB among new cases. Among previously treated cases in the Region, MDR-TB rate is esimated to be higher, around 16% (range: 11–21%) and the Region has the second lowest proporion of MDR-TB among retreatment TB paients. However, given the large number of TB cases in the SEA Region, this translates to a total of 89 000 (range: 75 000–100 000) esimated MDR-TB cases among noiied PTB cases, accouning for 30% of the world’s MDR-TB cases in 2013. Four of the 27 high MDR-TB-burden countries are in the SEA Region: Bangladesh, India, Indonesia and Myanmar.
The country-wise esimated burden of MDR-TB is based on naionwide drug resistance survey (DRS) or models based on sub-naional DRS or generic model applied to the whole Region; esimates and sources of esimate are presented in Table 5.
Tuberculosis control in the South-East Asia Region 2015
Table 5: Estimated MDR-TB cases and rates in Member States of SEA Region, 2013
Bangladesh DRS, 2012 1.4 (0.7–2.5) 29 (24-34) 4 700 (3 200–6 900) Bhutan Model, DRS,
2013a
2.2 (1.8–2.7) 35 (21-52) 47 (30-66)
DPR Korea* model 2.2 (1.8–2.7) 16 (12–20) 3 900 (3 100–4 900)
India model b 2.2 (1.9–2.6) 15 (11–19) 61 000
(47 000–76 000) Indonesia model c 1.9 (1.4–2.5) 12 (8.1–17) 6 800 (4 970-9 100)
Maldives model 2.2 (1.8–2.7) 16 (12–20) 2 (1–2)
Myanmar DRS, 2012-2013 5.0 (3.1–6.8) 27 (15–39) 9 000 (5 300–12 500) Nepal DRS, 2011 2.2 (1.3–3.8) 15 (10–23) 1 110 (700–1 760) Sri Lanka DRS, 2006
DRS, 2013d
0.18 (0–0.99) 0.58 (0.07-2.1) 15 (0–74)
Thailand DRS, 2012 2.0 (1.4–2.8) 19 (14–25) 1 880 (1 370–2 700)
Timor-Leste model 2.2 (1.8–2.7) 16 (12–20) 83 (67-102)
SEAR model 2.2 (1.8–2.7) 16 (12–20) 89 000
(70 000–110 000)
a Esimates for previously treated TB paients are based on DRS results; sample size for new TB cases was too small to esimate MDR-TB prevalence in this subgroup and esimates are based on regional model b Esimates based on sub-naional DRS conducted in three states between 2006 and 2009
c Model based on three sub-naional surveys: DRS in Mimika District in 2004, Central Java province in 2006 and East Java province in 2010
d Esimates for previously treated TB paients are based on results from DRS that had 99% coverage among retreatment cases in 2013; esimate for MDR-TB prevalence among new cases is based on results from previous DRS conducted in 2006
*Democraic People’s Republic of Korea
DRS = drug resistance surveillance or survey data; CI = conidence interval; MDR-TB = mulidrug-resistant TB
Drug-resistant TB
3.2 Response to DR-TB in the Region
In 2011, the WHO Regional oice for South-East Asia published the “South-East-Asia Regional Response Plan for Drug-resistant TB Care and Control” in collaboraion with WHO Country Oices. In 2012, the Regional Green Light Commitee (rGLC) was established in the WHO Regional Oice for South-East Asia. A Regional Advisory Commitee on MDR-TB was established to provide clear guidance on new policies and strategies for PMDT in countries of the Region. During recent years, steady progress has been made in the Region in detecing MDR-TB cases and iniiaing them on treatment. The r-GLC had approved the case management of paients with MDR-TB under naional programmes in 10 Member States and almost all countries moved to PMDT and are in the process of expanding case inding capacity and treatment and care services.
Bangladesh, Democraic People’s Republic of Korea, India, Indonesia, Myanmar, Nepal, and Thailand developed clear PMDT expansion plans and other countries included PMDT as a component of the overall naional strategic plans for TB control. In India, since September 2012, all 35 states have being providing MDR-TB diagnosic and treatment services and by March 2013, all districts were covered by PMDT services. In 2012 Bangladesh iniiated Community-based Programmaic Management of MDR-TB (CPMDT) and in 2014, 316 outpaient DR-TB teams were formed and 2524 health-care workers were trained to coninue MDR-TB care ater iniiaion of the treatment (4–8 weeks) in the ive chest
Tuberculosis control in the South-East Asia Region 2015
Maldives coninues to treat the few cases detected through the Naional Tuberculosis Insitute, Bangalore (India) on a case-by-case basis (no case was detected in 2013). Bhutan started enrolling cases in 2010 and provides treatment through three referral hospitals. Since 2011, Sri Lanka is enrolling paients that are treated iniially at the Naional Hospital of Respiratory Diseases and then referred for coninuaion of treatment at the chest clinics in their respecive districts. In Timor-Leste, there is a GLC project in place since 2011: the treatment is iniiated by one NGO inpaient MDR-TB ward in the district of Liquiça and six NGO faciliies are providing ambulatory care ater the intensive phase. There are ive NGOs which support the NTP in idenifying TB suspects and referring them to DOTS faciliies for diagnosis and treatment. In the Democraic People’s Republic of Korea, the growing number of MDR-TB cases noiied and iniiated on treatment is showing a rapid increase of MDR-TB diagnosic and management capacity. In Thailand, most paients with DR-TB are diagnosed and managed by university, regional/provincial and some private hospitals (about 100 treatment units throughout the country), which procure second-line ani-TB drugs (SLD) using local resources such as the Government Pharmaceuical Organizaion.
In 2013, according to country reports, about 280 000 TB paients in the Region were tested for suscepibility to rifampicin using phenotypic DST or WHO-recommended rapid molecular diagnosics; 26 000 laboratory conirmed MDR-TB or rifampicin-resistant cases who are not laboratory-conirmed MDR cases (RR/ MDR-TB) were noiied, being 30% of esimated MDR-TB cases among all noiied TB cases. Almost 24 000 paients had been registered for MDR-TB treatment in the Region, corresponding to 91% of noiied RR/MDR-TB cases, and being over 30% of the reported MDR-TB cases put on treatment compared to the previous year (Table 6). Data available from the irst two or three quarters of 2014 (from the four MDR-TB high-burden countries in the Region) conirm the increasing uptake of PMDT aciviies, since more than 22 000 MDR-TB cases were reported and 92% of them were reported on treatment.
Drug-resistant TB
Disaggregaion by laboratory conirmed and non-laboratory conirmed paients iniiated on MDR-TB treatment is oten lacking, limiing the assessment of the gap between diagnosis and enrolment on treatment.
There is also oten inconsistency between data from DRS and number of RR/ MDR-TB cases reported and poor disaggregated by history of treatment (new or previously treated cases). According to data reported, only 1% and 6% of new and retreatment cases respecively were tested for resistance to rifampicin. However, for India, data on DST tesing are reported as cumulaive of all cases, limiing the assessment of the South-East Asia Region in terms of achievement of targets set for tesing among new and previously treated paients. Considering the overall reported number of paients tested for DST, 12% of all reported paients were
tested.
R&R system for DR-TB has been revised in all countries of the Region to be consistent with the internaional recommendaions and to capture data about detecion and enrolment on treatment. However, in several countries, there is need to strengthen the system and quality of data.
Treatment success rates for MDR-TB paients enrolled on SLD in 2011 were available for all countries except Thailand that implemented the R&R system for DR-TB in 2012 and Democraic People’s Republic of Koreaand Timor-Leste that started enrolment of paients in 2012. Average regional treatment success rate was 54% for 2011 cohort, higher than for 2010 cohort; at country level, treatment success rates ranged between 25% in Maldives and 50% in India to 85% in Bhutan and 83% in Sri Lanka. Among unfavourable treatment outcomes, death rate was 21%, the highest among all WHO Regions.
Extensively drug resistant TB (XDR-TB) has also been reported from six countries (Bangladesh, India, Indonesia, Myanmar, Nepal and Thailand) in the Region. In total, 979 XDR-TB cases were reported in 2013 and 43% of them were started on XDR-TB treatment.