Seminar Nasional Teknik Industri [SNTI] 2013 Lhokseumawe-Aceh, 28-29 Agustus 2013 ISSN 2338-7122
194
MEMBRANE ULTRAFILTRATION FOR AMMONIUM NITROGEN
REMOVAL: USE OF RESPONSE SURFACE METHODOLOGY TO
IMPROVE UNDERSTANDING OF PROCESS PERFORMANCE AND
OPTIMIZATION
Erna Yuliwati1* dan Amrifan Saladin Mohruni2
1
Department of Industrial Engineering,Faculty of Engineering University of Bina Darma, 30251 Palembang, Indonesia,
Tel. +62 (711) 515-679; Fax: +62 (711) 518-000
2
Departmentof Mechanical Engineering, Faculty of Engineering University of Sriwijaya, Sumatera Selatan, Indonesia,
Tel. +62 (711) 580272
*Email:[email protected]
Abstrak
The aim of this study was to remove of ammonium nitrogen (NH3-N) from
refinery wastewater that was conducted by submerged membrane ultrafiltration.The experimental set-up comprised mainly of submerged membrane ultrafiltration reservoir, circulation pump, and aerator was used throughout investigation, which operated at vacuum pressure. Deposition and accumulation of suspended solids on membrane surface were prohibited with continuously air bubble flow rate that plays the main role in this filtration process. Responsesurface methodology (RSM) wasused for modelling and optimizing the process, and to gain a better understanding of the process performance. Quartic model was used as the experimental design. The factors studied were mixed liquor suspended solid (MLSS), air bubble flow rate (ABFR), and hydraulic retention time (HRT). Using RSM the retention of NH3-N
was maximized while optimizing the air bubble flow rate. Response surface plots improved also the understanding of the factors effect on permeate flux. The optimized conditions obtained for fluks of 148 L/m3h and NH3-N removal
of 92.89 % with an experimental design were MLSS concentration 4.50mg/L, aerator flow rate 2.25 ml/min, and HRT 276.93 min.
Keywords: Membrane ultrafiltration, Response Surface Methodology, Ammonium Nitrogen, Air Bubble Flow Rate
Introduction
Seminar Nasional Teknik Industri [SNTI] 2013 Lhokseumawe-Aceh, 28-29 Agustus 2013 ISSN 2338-7122
195
Table 1.Composition of refinery wastewater and the national discharge standards for refinery wastewater [1].
Constituent, unit Influent National primary discharged standard (P.U. (A) 434,
Standard B, December 10, 2011)
pH 6.7 5.5 – 9.0
Oil and grease, mg/L 17.0 10.0
COD, mg/L 555.0 400.0
NH3-N, mg/L 29.1 20.0
Suspended Solid, mg/L 213.0 100.0
Chlorine free, mg/L 4.6 2.0
Sulfide, mg/L 2.5 0.5
Submerged membrane is now widely used in water and wastewater treatment due to its high packing density and ease of module manufacture and operation [2]. The removal of organic wastes from wastewater is, therefore, becoming increasingly important, and submerged ultrafiltration finds its application in this area. The direct immersion of hollow fiber membranes was assembled in the feed reservoir with withdrawal of liquid through the fibers by the application of a vacuum on the outlet of the fiber lumen. There has been increasing attention to the application of refinery effluent in petroleum industry since a few years ago because refinery wastewaters were characterized by presence of several aromatic hydrocarbons and inorganic substances such as, COD, TOC, sulfide, ammonia nitrogen, and total suspended solid (TSS) [3].
Traditionally, the study membrane ultrafiltration has been conducted using the one variable at a time approach, where the effect of each factor is investigated separately. However, this approach implies a large amount of experiments and may often important conclusions about the effect of one experimental variable when the level of another variable is changed (i.e. interactions effects). Further, the use of statistical methods such as response surface methodology (RSM) overcomes the limitations of the one-variable at a time approach. RSM is an efficient statistical tool, which is used for modelling and optimization of several process variables [4].
In this study, RSM was used for the optimization of NH3-N removal from separation of
refinery wastewater synthetic which carried out using modified PVDF membrane. The
effect of aeration, HRT, pH and MLSSof feed solution on NH3-Nremoval was studied
with several apparatus.
Experimental
Materials. Commercial PVDF polymer pellets (Kynar®740) were supplied by Arkema
Inc. Philadelphia, USA. N,N-dimethylacetamide (DMAc, Aldrich Chemical) (synthesis grade, Merck, >99%) was used as solvent without further purification. Lithium chloride
monohydrate (LiOH. H2O) (Sigma Aldrich) and titanium dioxide (TiO2) (Sigma Aldrich)
were used as inorganic additives.The used membrane properties was tabulated in Table 2[5].
Table 2. Membrane Properties
Parameter Membrane
Outer diameter (mm) 1.1
Inner diameter (mm) 0.55
Pore size (nm) 34.05
Contact angle (o) 54
Seminar Nasional Teknik Industri [SNTI] 2013 Lhokseumawe-Aceh, 28-29 Agustus 2013 ISSN 2338-7122
196
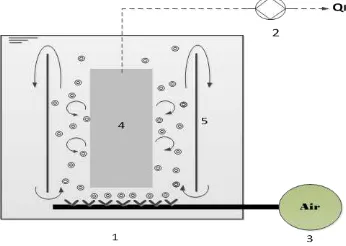
Experimental set-up and operational conditions. Figure 1 illustrates the flow pattern
of air bubble within the submerged UF system. Two bundles of modified PVDF hollow
fibers with total effective area of approximately 184 cm2were immersed in the
membrane reservoir and a constant TMP was maintained to pressurize wastewater from outside to inside of hollow fibers. All filtrations were conducted at room temperature and vacuum condition created using a peristaltic pump (Master flex model 7553-79, Cole Palmer). The permeate flow rate was continually recorded using flowmeter. The volume of the water permeation collected was determined using a graduated cylinder. After completing filtration, the membrane surface was cleaned with a soft sponge to remove the particle-packed layer which might form during filtration.
Fig.1. Schematic representation of the air bubble upflow stream in submerged ultrafiltration system: membrane reservoir (1); peristaltic pump (2); aerator (3); membrane bundles (4) and
partitioned glass (5).
Analytical method. Field emission scanning electron microscope (JEOL JSM-6700F)
was used to examine the morphology of the PVDF hollow fiber membrane prepared. The FESEM micrographs of cross-section of fiber membranes were taken at various magnifications.
Membrane was tested with a self-made U-shape membrane bundle. Pure water permeation rate was measured after the steady state was reached, using the following equation
F = (1)
whereF is the pure water flux (l/m2 h), V is the permeate volume (l), A is the membrane
surface area (m2), and t is the time (h).
NH3-N concentrations were measured using a spectrophotometer (DR5000, HACH) in
accordance to the standard procedures. During the operation with high organic loading rates, the parameters were evaluated daily and sampling was carried out three times a
week again. The NH3-N removal efficiencies are calculated with Eq.(2):
NH
3-N removal (%) =
��3−���3−�0− ��3−�0
× 100
(2)
where NH3-Noand NH3-N are the initial concentration of synthetic refinery wastewater
and the concentration of permeate produced.
Response Surface Methodology (RSM). RSM is derived from mathematical and
Seminar Nasional Teknik Industri [SNTI] 2013 Lhokseumawe-Aceh, 28-29 Agustus 2013 ISSN 2338-7122
197
experiments and data analysis in duplicate. The four factors were made of air bubble
flow rate(ABFR) (x1), hydraulic retention time (HRT) (x2), mixed liquor suspended solid
concentration (MLSS) (x3), and pH (x4), were used to optimizes NH3-N removal in
submerged membrane process. Model fitting to equation of up to the fourth-order polynomial was performed to determine the goodness-of-fit. The responses were fitted to the variables by multiple regression. The minimum and maximum range of variables were investigated and the full experimental plan with respect to their values in actual and coded form was listed in Table 3.
Table 3. Independent variables and limit level for response surface study
Variables Unit Symbols Levels
uncoded coded -2 -1 0 +1 +2
air bubble flow rate min/L x1 X1 0.3 1.2 2.1 3.0 3.9
HRT min x2 X2 120 180 240 300 360
MLSS mg/L x3 X3 1.5 3.0 4.5 6.0 7.5
pH pH x4 X4 3.5 5.0 6.5 8.0 9.5
In RSM, a model with the form of Eq. (3) is fitted to experimental data and, by optimization methods, the coefficients for the model are calculated. To identify the right model that can fit the data, it can be started with the simplest model forms like first- and second-degree Scheffe’s polynomial [8]. After testing these models for adequacy of fit, they were augmented to simplex centroid and special quartic models by adding the appropriate terms. In this study, the quartic model used for predicting the optimal point is as follows
�(�) =∑ ���=1 ���4+ +∑���(�<�)�����3��+∑���(�<�)����2��2+∑���� (�<�<�)������2����+∑�����(�<�<�<�)������������� (3)
where y is the response variable, e
i, e
ij, e
ijk, and e
ijklare the polynomial coefficients of
the model, x
i,x
j,x
kand x
lare the coded levels of the independent variables [6].
All these coefficient variables are analysed by multiple regression analysis and response contour plot are generated using the software Design-Expert. Validity of the selected model used for optimizing the process parameters has to be tested using analysis of variance (ANOVA) that is determined by performing Fisher’s statistical test. In particular, the proportion of variance exhibited by the multiple coefficient of
determination R2 should be close to 1 as this would demonstrate better correlation
between the experiment and the predicted values [7,8]. Moreover, a good model must be significant based on F-value and P-value as opposed to the lack of fit (insignificant).
Results and discussion
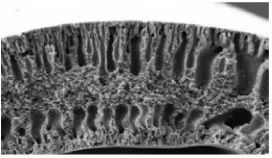
Morphology observation. Figure 2 shows the cross-section of the PVDF hollow fiber
membrane with additives (TiO2 and LiCl). The cross-sectionalimage of the hollow fiber
indicates that the finger-like macrovoids extendes from both inside and outside of the hollow fiber to a sponge-like intermediate layer. This result is possibly attributed to the
porous structure and higher hydrophilicity of TiO2 nanoparticles than PVDF polymer.
Seminar Nasional Teknik Industri [SNTI] 2013 Lhokseumawe-Aceh, 28-29 Agustus 2013 ISSN 2338-7122
198
Fig. 2. Cross sectional (Mag. 500x )images of the PVDF hollow fiber membranes.
Statistical analysis. In the present work, the relationship between four factors (ABFR,
HRT, MLSS concentration, and pH) and two responses (TSS and NH3-N removal
efficiencies) for submerged hollow fiber membrane is analyzed using RSM. The adequacy of the RSM is justified through analysis of variant (ANOVA). ANOVA is a statistical technique that subdivides the total variation in a set of data into component parts associated with the spesific sources of variances for the purpose of testing hypotheses on the parameters of the models[8]. ANOVA of these models have demonstrated that the model is highly significant effects and interactions of ABFR,
HRT, MLSS, and pH on NH3-N removal of filtered refinery wastewater. The backward
elimination procedure was employed to eradicate the insignificant terms and ANOVA results of this backward quadratic model. The values determine the rank of
significance’s degree. The confidence level of ANOVA analysis of NH3-N removal
response, as shown in Table 4, which was greater than 80% (P<0.05) for NH3-N
response while F-value and P-value of the model were 1975.47 and 0.0001 respectively. This indicatess also that the estimated model fits the experimental data
adequately. It was further shown that the main effect of ABFR (x1), HRT (x2), MLSS
(x3), and pH (x4) and more level interactions of x1, x2, x3, x4, x1x2, x1x3, x1x4, x2x3, x2x4,
x3x4, x12, x22, x32, x42, x1x2x3, x1x2x4, x1x3x4, x2x3x4, x12x2, x12x3, x12x4 x1x22 and x1x2x3x4
were significant model terms (factors).
Effects of ABFR on NH3-N removal. The following fitted regression models (equations
in terms of coded values for the regressors) are used to quantitatively investigate the effects of ABFR, HRT,MLSS, and pH on the characterization of the submerged
membrane process for NH3-N removal efficiencies. According to the sequential model
sum of squares, the models were selected based on the highest-order polynomials where the additional terms were significant. An empirical relationship between the responses and the variables was expressed by the following equationsof fourth degree.
The effects of the independent variables on the dependent variables, i.e. NH3-N (y1)
removal efficiencies, is evaluated using approximating functions Eq. (4).
y1 = 90.39 + 5.14 x1 + 6.56 x2 + 0.40 x3 + 10.88 x4 + 0.16 x1x2+ 0.13 x1x3 – 1.10 x1x4+ 0.50 x2x3 – 1.63 x3x4 – 3.86 x12 – 2.64 x22+ 1.11 x32 – 6.29 x42 – 0.41 x1x2x3 – 0.35 x2x3x4– 0.68 x1x3x4 – 0.12 x2x3x4– 4.46 x12x2+
3.45 x12x3– 5.06 x12x4–3.46 x1x22–0.81 x1x2x3x4 (4)
where y1 is defined as the NH3-N removal in the permeate solution and x1, x2, x3 and x4
represent normalized ABFR, HRT, MLSS, and pH.
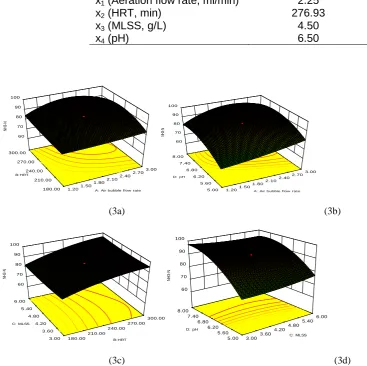
Figs.3 shows 3-D graphs of NH3-N removal. It is clearly shown by Fig. 3a that the slight
increment of NH3-N removal occurs monotonously with the increase of ABFR at HRT =
180 min.On the other hand,,NH3-N removal shows a maximum at ABFR of 2.25 mL/min
when HRT is maintained at 300 min. Similar trend was illustrated in Fig. 3b, i.e. NH3-N
Seminar Nasional Teknik Industri [SNTI] 2013 Lhokseumawe-Aceh, 28-29 Agustus 2013 ISSN 2338-7122
199
TSS removal.The ABFR must be carefully controlled to maintain adequate expansion and liquid-liquid mass transfer while minimizing shear effects. Rosenberger et al. (2002) alsomentioned that the smaller particle size in aerated submerged ultrafiltration was mainly due to violent turbulence that aeration produced under membrane bundles
[13].In Fig. 3d NH3-N removal decreased slightly, at pH 8.00, when MLSS
concentration increased from 3.00 g/L to 6.00 g/L. Both Figs. 5b and 5d show a strong
effect of pH increase from 5 to 8. According to Fig.3cNH3-N became the highest at the
highest HRT value of 300 min. This was true at both the lowest (3.00 g/L) and the highest (6.00 g/L) of MLSS concentration.The above observation was consistent with the conclusion made by Bai and Tien(2005) [14].
It can thus be concluded that NH3-N removal increased with increase in HRT and
pHand decrease in MLSS concentration. ABFR must be carrefully controlled to maintain adequate expansion and mass transfer while minimizing shear effects near the optimum value. The concentration polarization on the membrane surface was also one of the factors, as has been observed at low ABFR. It should however be noted that
there are other reasons for the high NH3-N removal observed. The nitrogen compounds
are adsorbed to the deposited matters thatare retained by the membrane in filtration process. Besides, the biomass also assimilates organic nitrogen. This high removal value was also possible due to nitrification reactions that occurred in the reservoir where ammonium was highly soluble in water. The ammoniumions thus formed can be readily reduced to nitrite and nitrate. Pulefouet al., (2008) observed that the percentage of ammonia removal increased with increasing alkalinity of dissolved ammonium in water, as it is known that ammonium ions are formed with increasing alkalinity (pH
8.00) [15]. Maximum NH3-N removal efficiencies as well as operating variables at
optimized values for treatment of refinery wastewater are listed in Table 5.
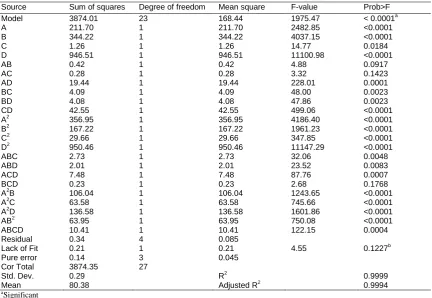
Table 4.Anova for response surface backward quartic model, Response: NH3-N removal.
Source Sum of squares Degree of freedom Mean square F-value Prob>F
Model 3874.01 23 168.44 1975.47 < 0.0001a
Seminar Nasional Teknik Industri [SNTI] 2013 Lhokseumawe-Aceh, 28-29 Agustus 2013 ISSN 2338-7122
200
Table 5. Optimum process conditions (factors) for maximum response results with standard deviation (S.D.)
Factors Optimum value (S.D.)
y1 (NH3-N removal
Fig.3. 3-D plot of NH3-N from the model equation of effect the condition process: (a)
ABFR-HRT, (b) ABFR-pH, (c) HRT-MLSS, (d) MLSS-pH.
Conclusions
Response surface methodology was used to find the optimal process parameters in suspended solid and ammonia nitrogen removal for refinery wastewater treatment. This statistical analysis shows that all the variables set in the preparation of the model, within the tested boundaries of the model, have significant effect on the model. Four process parameters, such as air bubble flow rate, hydraulic retention time, mixed liquor
suspended solids and pH solution influence NH3-N removal efficiencies. The optimal
filtration conditions for maximum removal efficiencies of NH3-N (92.89 %)found by RSM
Seminar Nasional Teknik Industri [SNTI] 2013 Lhokseumawe-Aceh, 28-29 Agustus 2013 ISSN 2338-7122
201
In addition, it can be concluded that the four parameters tested have significant effect
on NH3-N removal, is borne out by the statistical analysis (ANOVA) of R2 value were
0.9999, respectively. It has been concluded that a mathematical approach is useful for picturing the theoritical has been testified to be a powerful tool in studying submerged ultrafiltration process.
References
[1] Environmental Quality (Industrial Effluent) Regulation 2009, http://www.mkma.org/EnvironmentalRegulation2009.htm., Retrieved on 25 May 2011.
[2] D.B. Mosqueda-Jimenez, R.M. Narbaitz,T. Matsuura, G. Chowdhury, G. Pleizier, J.P. Santerre, Influence of processing conditions on the properties of ultrafiltration membranes, J. Membr. Sci. 231 (2004) 209-224.
[3] M. Khayet, T. Matsuura, Preparation and characterization of polyvinylidene fluoride membranes for membrane distillation, Ind. Eng. Chem. Res. 40 (2001) 5710-5718.
[4] R.H. Myers, D.C. Montgomery, Response Surface Methodology: Process and Product Optimization using Designed Experiments, 2nd ed., John Wiley & Sons, USA, 2002.
[5]E. Yuliwati, A.F. Ismail, T. Matsuura, M.A. Kassim, M.S. Abdullah, Characterization of surface-modified porous PVDF hollow fibers for refinery wastewater treatment using microscopic observation, Desalination 283 (2011) 206-213.
[6] Design-Expert® Software Version 6 User’s Guide, 2001.
[7] Design-Expert® Software Version 8.0.5.2, 2011.
[8] A. Del-Prete, A.A. De Vitis, A. Spagnolo, ). Experimental Development of RSM Techniques for Surface Quality Prediction in Metal Cutting Application, Int. J. Mater. Form 2010, 3(1), 471-474.
[9] A.W. Zularisam, A.F. Ismail, M.R. Salim,Mimi Sakinah, T. Matsuura, Application of coagulation-ultrafiltration hybrid process for drinking water treatment: Optimization of operating conditions using experimental design, Sep. Purif. Technol. 65 (2009) 193-210.
[10] A. Mansourizadeh, A.F. Ismail, Effect of LiCl concentration in the polymer dope on the structure and performance of hydrophobic PVDF hollow fiber membranes for CO2
absorption, Chem. Eng. J., 165 (3) (2010) 980-988.
[11] E. Yuliwati, A.F. Ismail, W.J. Lau, B.C. Ng, A. Mataram, M.A. Kassim, Effects of process conditions in submerged ultrafiltration for refinery wastewatertreatment: Optimization of operating process by response surface methodology, Desalination 287 (2012) 350-361.
[12] E. Yuliwati, A.F. Ismail, T. Matsuura, M.A. Kassim, M.S. Abdullah, Effect of modified PVDF hollow fiber submerged ultrafiltration membrane for refinery wastewater treatment, Desalination 283 (2011) 214-220.
[13] S. Rosenberger, U. Krüger, R. Witzig, U. Manz, M. Szewzyk, M. Kraume, Performance of a bioreactor with submerged membranes for aerobic treatment of municipal wastewater, Water Res. 36 (2002) 413-420.
[14] R. Bai, C. Tien, Further work on cake filtration analysis, Chem. Eng. Sci. 60 (2005) 89-101.
![Table 1.Composition of refinery wastewater and the national discharge standards for refinery wastewater [1]](https://thumb-ap.123doks.com/thumbv2/123dok/3715726.1478926/9.595.131.442.668.732/composition-refinery-wastewater-national-discharge-standards-refinery-wastewater.webp)