DECISION LEVEL FUSION OF ORTHOPHOTO AND LIDAR DATA
USING
CONFUSION MATRIX
INFORMATION FOR LNAD COVER CLASSIFICATION
S. Daneshtalab a, H.Rastiveis a
a School of Surveying and Geospatial Engineering, College of Engineering, University of Tehran, Tehran, Iran -
(somaye.danesh, hrasti)@ut.ac.ir
KEY WORDS: Classification, LiDAR data, Orthophoto, SVM, Decision Level Fusion, Confusion matrix
ABSTRACT:
Automatic urban objects extraction from airborne remote sensing data is essential to process and efficiently interpret the vast amount of airborne imagery and Lidar data available today. The aim of this study is to propose a new approach for the integration of high-resolution aerial imagery and Lidar data to improve the accuracy of classification in the city complications. In the proposed method, first, the classification of each data is separately performed using Support Vector Machine algorithm. In this case, extracted Normalized Digital Surface Model (nDSM) and pulse intensity are used in classification of LiDAR data, and three spectral visible bands (Red, Green, Blue) are considered as feature vector for the orthoimage classification. Moreover, combining the extracted features of the image and Lidar data another classification is also performed using all the features. The outputs of these classifications are integrated in a decision level fusion system according to the their confusion matrices to find the final classification result. The proposed method was evaluated using an urban area of Zeebruges, Belgium. The obtained results represented several advantages of image fusion with respect to a single shot dataset. With the capabilities of the proposed decision level fusion method, most of the object extraction difficulties and uncertainty were decreased and, the overall accuracy and the kappa values were improved 7% and 10%, respectively.
1. INTRODUCTION
The performance of land cover classification using LiDAR data and Aerial imagery data separately has previously been analyzed and it was shown that superior results were achieved using LiDAR data (Jakubowski et al., 2013). However, simultaneous use of several remote sensing data from different sensors or methods of integration may be appropriate.In other words, the data obtained from different sources, each with aspects of the value that can be used together and are complementary (Esteban, Starr et al. 2005). Multiple sensors may provide complementary data, and fusion of information of different sensors can produce a better understanding of the observed site, which is not possible with single sensor (Simone, Farina et al. 2002).
Fusion of multiple data sets can be performed on signal, Pixel, feature and decision level (Pohl and Van Genderen 1998). In signal level fusion, signals from multiple sensors are combined together to create a new signal with a better signal-to-noise ratio than the input signals. In pixel level fusion, the information from different images, pixel by pixel, are merged to improve detection of objects in some tasks such as segmentation. Feature level fusion consists of merging the features extracted from different images. In this level of fusion, features are extracted from different sensors and combined to create a feature vector for classified using a classifier method (Abbasi, Arefi et al. 2015).
In decision level fusion, different datasets are combined at a higher level of integration. In this level of fusion, first the data from each single sensor is separately classified, then fusion consists of merging the output from the classification(Goebel and Yan 2004, Dong, Zhuang et al. 2009, Du, Liu et al. 2013).
Singh and Vogler investigated the impact of urban land use litter to detect classes of integration of Landsat imagery and lidar data began. By applying the supervised classification method showed that most like to merge the two data classification accuracy up to 32% compared to the separate use of lidar data has increased(Singh, Vogler et al. 2012).
Kim and colleagues used data integration aerial imagery and lidar ground cover gave way to improve classification accuracy. (Kim 2016). Gerke and Xiao proposed a combination of lidar and aerial image classification and automatic detection of effects used in urban areas. The method combines lidar data and aerial image of two dimensional geometry and spectral data liar image to extract four classroom buildings, trees, vegetation and land without vegetation land was used. The new classification method was introduced to the use of geometric and spectral information during the process of classification was defined (Gerke and Xiao 2013).
Another method for automatic extraction of buildings using lidar integration and optical image was presented by Li Wu. This procedure was completely data-driven, and also was suitable for any form of buildings(Li, Wu et al. 2013).
Decision template (DT. In this way, the characteristics of each data source separately extracted and the optimal properties were selected among them. Then, each of the data sources was classified separately using support vector machine. The output of this classification integrated using a Bayesian algorithm(Bigdeli, Samadzadegan et al. 2014).
Gilani, proposed a graph based algorithm for combination of multispectral images and airborne data lidar. The results showed enhancement in performance and improvement in the accuracy of the reconstruction and building recognition process(Gilani, Awrangjeb et al. 2015).Rastiveis Presented a Decision level fusion of lidar data and aerial color imagery based on Bayesian theory for urban area classification. This classification is performed in three different strategies: (1) using merely LiDAR data, (2) using merely image data, and (3) using all extracted features from LiDAR and image. The results of these classifiers were integrated in a decision level fusion based on Naïve Bayes algorithm (Rastiveis, 2015).
For the abovementioned researches, therefore, using color imagery with lidar data together in decision level of fusion may improve accuracy of classification in urban areas. In this study, we proposed a new decision level fusion of lidar data and orthophoto to improve the classification results. For this purpose, the paper will go on with describing the details of the proposed method. After that the study area would be introduced and, then, obtained results from the implementation of this method will presented.
2. PROPOSED METHOD
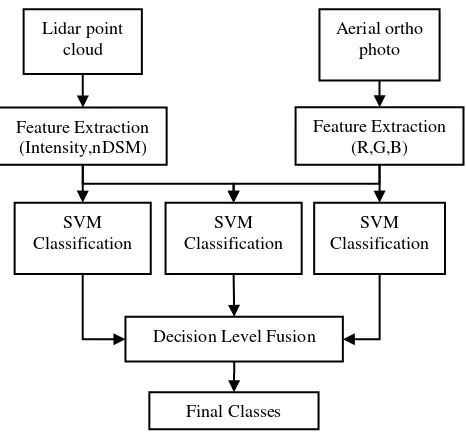
In this paper, an automatic object extraction system based on the integration of high resolution aerial orthophoto and LiDAR data is provided. Figure 1 shows the flowchart of the proposed algorithm.
Figure 1.Flowchart of the proposed method for automatic object extraction from LiDAR data and orthophoto
As shown in Figure 1, after extracting proper features, both input data are classified through support vector machine classifier. Integrating all the extracted fetures from both sensors, another another classification are performed. Finally, according to the output from each of the classification and their error matrices, the results are integrated in a decision level fusion system to obtain the final classification result. The details of the proposed method are described in the following sections.
2.1 Data Preparation
In this step, as can be seen from Figure 1, different features are extracted from Lidar and ortho image data. These features must contain useful information to improve accuracy of classification process.
Intensity of Lidar as the primary attribute from lidar data recorded the reflectance on the surveyed area (Axelsson 1999). It is useful to discriminate asphalt areas from grassland or buildings in classification process (Buján, González‐Ferreiro et al. 2012). Therefore, the intensity and is used as a feature in the classification of Lidar data. Besides, Normalized Digital Surface Model (nDSM) is extracted using LiDAR raw points cloud through Equation 1.
nDSM= DSM – DTM (1)
It should be noted that to simplify the fusion process the data set should have the same spatial resolutions. Therefore, a irregular format of the nDSM and the Intensity of LiDAR data are generated using interpolation techniques with the same resolution of the orthophoto.
From the orthophoto, three visible channels of Red, Green and Blue were considered as feature vector for the classification process.
Although different features may be used in classification process, however, increasing the number of features results more complexity in computations. Therefore, the most easy-access features for both data set are considered.
2.2 SVM Classification
There are a lot of classification algorithm that have been introduced during the last decades. In this paper, Support Vector Machine (SVM) classification algorithm is used to classify the data sets. Support vector machine is a machine learning method that is widely used for data analyzing and pattern recognition. The algorithm was invented by Vladimir Vapnik and the current standard incarnation was proposed by Corinna Cortes and Vladimir Vapnik. Classifying data has been one of the major parts in machine learning. The idea of support vector machine is to create a hyper plane between data sets to indicate which class it belongs to. The challenge is to train the machine to understand structure from data and mapping with the right class label, for the best result, the hyper plane has the largest distance to the nearest training data points of any class(Pal 2006). In this step, both data sets are classified using the aforementioned feature vectors.
4.2 Feature Level Fusion
5.2 Decision Level Fusion
SVM classifiers are separately applied to each data. Then results of single classifiers are fused through a multiple classifier system classifier fusion is successfully applied on various types of data to improve single classification results. Classifier fusion can improve classification accuracy in comparison to a single classifier by combining results of classification algorithms on different data sets. The possible ways of integrating the outputs of classifiers in a decidedly fusion depend on what information can be obtained from the discrete members. In our proposed method, based on classification results in three lidar data, orthophoto and integration features, overall accuracy and omission, commision error for each class final image is created from the classification.
Finally, combining the previous classification results, the final classification are obtained. In this case, decision for each pixel are made according to the results of the overall classification from ortho photo, lidar data and the feature level fusion results. So that, first all pixels that the three classifications were agree about belonging them to the same class are remaind without changing. The pixels that the classifications were disagree were labeled with regard to the overall accuracy and omission, commission error is a class act. In this case, the priority of a class in the final image is selected based on the lowest error rate or highest overall accuracy. Thus, all the pixels are checked and a decision is made on each.
3. EXPERIMENTAL RESULTS AND DISCUSSIONS
In this study, the standard data set from IEEE data fusion contest 2015 were used. The details of the data set are described in the following section. After that the obtained results from testing the algorithm using this data set are presented.
3.1 Data Set
The imaging data were acquired on March 13, 2011, using an airborne platform flying at the altitude of 300 m over the urban and the harbor areas of Zeebruges. The data were collected simultaneously and were georeferenced to WGS-84(IEEE, 2015).
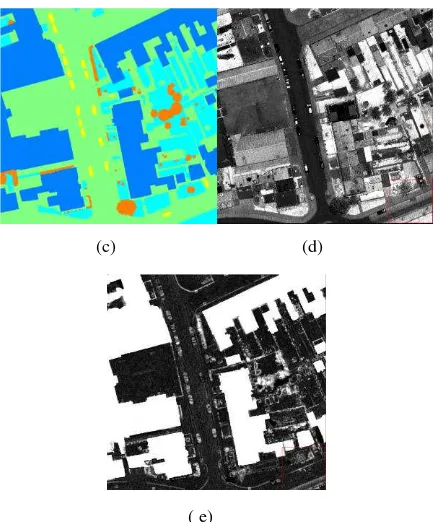
The point density for the LiDAR sensor was approximately 65 points/m², which is related to point spacing of approximately 10 cm. Both the 3D point clouds and the resulting digital surface model (DSM) are provided. The color orthophotos were taken at nadir and have a spatial resolution of approximately 5 cm (IEEE, 2015). The ground truth of this data set five different land cover classes; in our proposed method these classes are Building, Grassland, Ground, Car and Tree. These features from LiDAR data, orthoimage and Ground trouth are displayed in Figure 2 (a-c).
(a) (b)
(c) (d)
( e)
Figure 2. Applied data sets a) orthophoto, b) Lidar derived DSM, c) Ground trouth, d) Lidar pulse Intensity, e) nDSM
3.2 Results and Experiment
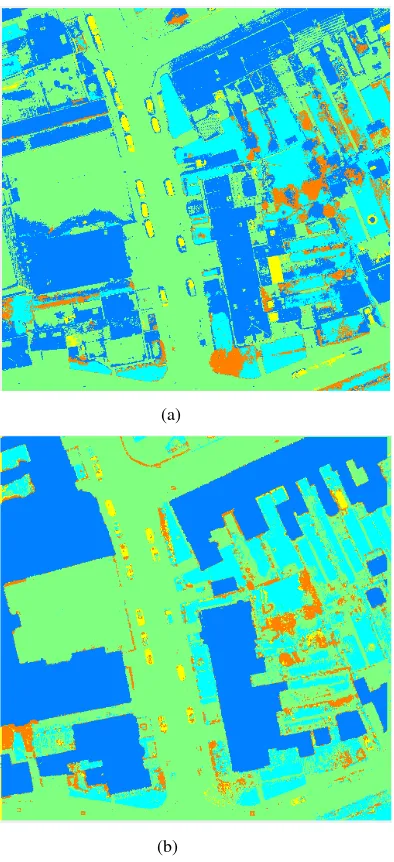
(a)
(b)
Figure 3. The output of the SVM classification,(a) orthophoto, (b) lidar data.
Figure 4. The output of the SVM classification from feature level fusion.
Figure 5. The output of the weighted majority voting classification.
Figure 6. The output of the final classification using Decision Level Fusion.
Class building grass ground car tree
Building 896509 51260 331296 6696 11641
Grass 8333 475196 62784 105 47055
Ground 400187 10999 1344542 8911 2219
Car 25818 821 20305 31651 3
Tree 16559 97998 47727 4 63315
OverallAccuracy 70.95 KappaCoefficient 0.55
Class building grass ground car tree
Building 1234290 10019 58201 0 7917
Grass 19887 400345 169546 4347 20771
Ground 63382 167759 1475474 15333 38177
Car 7860 14631 22701 22872 8414
Tree 21987 43520 80732 4815 48954
OverallAccuracy 80.31 KappaCoefficient 0.70
Table 2. Confusion Matrix from SVM classifiers lidar.
Class building grass ground car tree
Building 1247403 7841 59441 137 4886
Grass 15225 477671 153113 97 35297
Ground 66546 89490 1515177 11872 10657
Car 6189 4151 28576 35228 411
Tree 12043 57121 50347 33 72982
OverallAccuracy 84.51 KappaCoefficient 0.76
Table 3 Confusion Matrix from SVM classifiers feature level.
Class building grass ground car tree
Building 1237916 1762 52120 24 1787
Grass 8333 475196 62784 105 47055
Ground 87532 64805 1580796 9943 15028
Car 3676 1418 24605 37152 160
Tree 3874 20747 19256 3 47841
OverallAccuracy 87.28 KappaCoefficient 0.79
Table 4. Confusion Matrix from SVM classifiers decision.
Class building grass ground car tree
Building 1249625 11741 64437 150 7395
Grass 6255 466702 82446 43 31717
Ground 78101 116290 1605405 12747 18209
Car 5683 2296 22612 34426 255
Tree 7742 39245 31754 1 66657
OverallAccuracy 86.39 KappaCoefficient 0.78
Table 5. Confusion Matrix from Weighted majority voting.
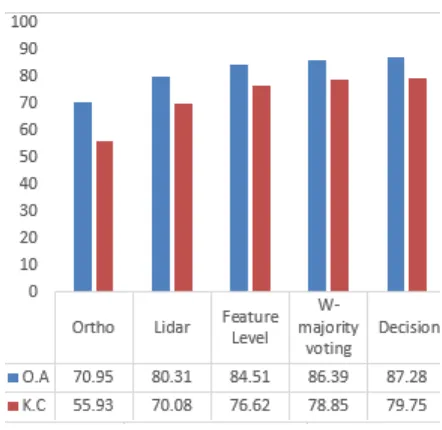
In Tables 6 (a-b) user and producer accuracies of each category for all performed classifications are shown, and Figure 7 depicted the resulted overall accuracy and kappa coefficient.
orthophoto lidar feature decision WMV
Class U.A U.A U.A U.A U.A
Building 69.1 94.1 94.5 95.6 93.7
Grass 80 65.1 70.1 80.0 79.4
Ground 76 83.8 89.4 89.9 87.6
Car 40.2 29.9 47.2 55.4 52.7
Tree 28.0 24.4 37.9 52.1 45.8
(a)
orthophoto lidar feature decision WMV
Class P.A P.A P.A P.A P.A
Building 66.5 91.6 92.5 91.8 92.7
Grass 74.6 62.9 75 74.6 73.3
Ground 74.4 81.6 83.8 87.4 88.8
Car 66.8 48.2 74.3 78.4 72.6
Tree 50.9 39.4 58.7 38.5 53.6
(b)
Table 6. The resulted user and producer accuracies of all classes. a) UserAccuracy , b)ProducerAccuracy
Figure 7. Comparison between classification results
extraction difficulties and uncertainty were decreased and, the overall accuracy and the kappa values were improved 7% and 10%, respectively.
4. CONCLUSION
In this paper, a new decision level fusion approach for the integration of high-resolution aerial imagery and Lidar data to improve the accuracy of classification in the city complications was proposed. The overall accuracy of the classification complications urban area in five different classes, for orthophoto 70.95%, 80.31% for lidar data, 84.51% at feature level and for the final image of integration in decision level 87.28% were obtained. The obtained results showed 7% and 10% improvement in the overall accuracy and the kappa values, respectively.the weighted majority voting is a fusion method at the decision level. also the results are compared with that method. Although the results were promising, however, more tests considereing different data ses, features, number of classes are suggested.
REFERENCES
Abbasi, B., et al. (2015). "Fusion of hyperspectral and lidar data based on dimension reduction and maximum likelihood." The International Archives of Photogrammetry, Remote Sensing and Spatial Information Sciences 40(7): 569
.
Axelsson, P. (1999). "Processing of laser scanner data— algorithms and applications." ISPRS Journal of Photogrammetry and Remote Sensing 54(2): 138-147
.
Bigdeli, B., et al. (2014). "A decision fusion method based on multiple support vector machine system for fusion of hyperspectral and LIDAR data." International Journal of Image and Data Fusion 5(3): 196-209
.
Buján, S., et al. (2012). "Land Use Classification from Lidar Data and Ortho‐Images in a Rural Area." The Photogrammetric Record 27(140): 401-422
.
Dong, J., et al. (2009
"
.)
Advances in multi-sensor data fusion: Algorithms and applications." Sensors 9(10): 7771-7784.
Du, P., et al. (2013). "Information fusion techniques for change detection from multi-temporal remote sensing images." Information fusion 14(1): 19-27
.
Esteban, J., et al. (2005). "A review of data fusion models and architectures: towards engineering guidelines." Neural Computing & Applications 14(4): 273-281
.
Gerke, M. and J. Xiao (2013). "Supervised and unsupervised MRF based 3D scene classification in multiple view airborne oblique images." ISPRS Annals of the Photogrammetry, Remote Sensing and Spatial Information Sciences 2(3): 25-30
.
Gilani, S., et al. (2015). "Fusion of LiDAR data and multispectral imagery for effective building detection based on graph and connected component analysis." The International Archives of Photogrammetry, Remote Sensing and Spatial Information Sciences 40(3): 65
.
Goebel, K. and W. Yan (2004). Choosing classifiers for decision fusion. Proceedings of the Seventh International Conference on Information Fusion
.
Kim, Y. (2016). "Generation of Land Cover Maps through the Fusion of Aerial Images and Airborne LiDAR Data in Urban Areas." Remote Sensing 8(6): 521
.
H. Rastiveis, (2015). "Decision level fusion of LIDAR data and aerial color imagery based on Bayesian theory for urban area classification," The International Archives of Photogrammetry, Remote Sensing and Spatial Information Sciences, vol. 40, p. 589.
Li, Y., et al. (2013). "An improved building boundary extraction algorithm based on fusion of optical imagery and LiDAR data." Optik-International Journal for Light and Electron Optics 124(22): 5357-5362
.
Pal, M. (2006). "Support vector machine‐based feature selection for land cover classification: a case study with DAIS hyperspectral data." International Journal of Remote Sensing 27(14): 2877-2894
.
Simone, G., et al. (2002). "Image fusion techniques for remote sensing applications." Information fusion 3(1): 3-15