* Corresponding author:
E-mail: [email protected]
Received: May 28, 2015
Approved: September 21, 2015
How to cite: Rieger FA, Zolin CA, Paulino J, Souza AP, Matos ES, Magalhães CAS, Farias AF. Water Erosion on an Oxisol under Integrated Crop-Forest Systems in a Transitional Area between the Amazon and Cerrado
Biomes. Rev Bras Cienc Solo. 2016;v40:e0150111.
Copyright: This is an open-access article distributed under the
Water Erosion on an Oxisol under
Integrated Crop-Forest Systems
in a Transitional Area between the
Amazon and
Cerrado
Biomes
, Ciro Augusto de Souza Magalhães(2)
and Austeclínio Lopes de Farias Neto(2)
(1)
Universidade Federal de Mato Grosso, Instituto de Ciências Agrárias e Ambientais, Programa de Pós-Graduação em Agronomia, Campus Sinop, Mato Grosso, Brasil.
(2)
Embrapa Agrossilvipastoril, Sinop, Mato Grosso, Brasil. (3)
Universidade Federal de Mato Grosso, Instituto de Ciências Agrárias e Ambientais, Sinop, Mato Grosso, Brasil.
ABSTRACT: Water erosion is one of the main factors driving soil degradation, which has large economic and environmental impacts. Agricultural production systems that are able to provide soil and water conservation are of crucial importance in achieving more sustainable use of natural resources, such as soil and water. The aim of this study was to evaluate soil and water losses in diferent integrated production systems under natural rainfall. Experimental plots under six diferent land use and cover systems were established in an experimental ield of Embrapa Agrossilvipastoril in Sinop, state of Mato Grosso, Brazil, in a Latossolo Vermelho-Amarelo Distróico (Udox) with clayey texture. The treatments consisted of perennial pasture (PAS), crop-forest integration (CFI), eucalyptus plantation (EUC), soybean and corn crop succession (CRP), no ground cover (NGC), and forest (FRS). Soil losses in the treatments studied were below the soil loss limits (11.1 Mg ha-1 yr-1), with the exception of the plot under bare soil (NGC), which exhibited soil losses 30 % over the tolerance limit. Water losses on NGC, EUC, CRP, PAS, CFI and FRS were 33.8, 2.9, 2.4, 1.7, 2.4, and 0.5 % of the total rainfall during the period of study, respectively.
Keywords: surface runof, natural rain, soil loss, water loss, land slope.
INTRODUCTION
Water erosion has had extensive negative impacts on soil quality throughout Brazil. Soil degradation mainly occurs from anthropogenic interference in natural conditions (Silva et al., 2005), changing the soil structure and increasing runof and sediment yield, which will ultimately have impacts on siltation and eutrophication of water bodies (Cruz, 2006).
Soil tolerance to losses determines factors like magnitude of the erosion and impacts over time (Nunes et al., 2012). Determining soil losses does not restrict land use and management; it only controls the choice of the techniques to be adopted, without considering economic factors (Lombardi Neto and Bertoni (Lombardi Neto and Bertoni, 1975). Furthermore, methods to estimate tolerance to soil loss by erosion are empirical as regards the deinition of the weighting factors used to express the efect of each variable, which leads to diferent estimates of tolerance for the same soil (Bertol and Almeida, 2000).
Evaluation of soil and water losses is important in choosing and adopting management practices aimed at reducing soil degradation (Martins et al., 2003); soil preparation systems are essential in the control of water erosion. In conventional tillage, there is substantial soil mobilization, disrupting soil structure and increasing susceptibility to erosion. Soil management systems without plant residue are less efficient in erosion control (Panachuki et al., 2011). Conversely, management of the mulch provided by crop residue has a direct and effective impact on reduction of water erosion, due to dissipation of the kinetic energy of raindrops, which reduces disintegration of soil particles and surface sealing (Cogo et al., 2003) and decreases soil loss (Volk and Cogo, 2014).
The root system favors aggregation of soils, both by the release of organic exudates and by approximation of mineral particles by pressures exerted during root growth and water uptake, favoring the cohesion of soil particles (Castro Filho et al., 1998; Silva and Mielniczuk, 1998; Palmeira et al., 1999).
In Brazil, despite extensive research on water and soil loss (Mannigel et al., 2002; Cogo et al., 2003; Beutler et al., 2003; Brito et al., 2005; Amorim et al., 2010; Lima et al., 2014), few studies address this subject in integrated systems, e.g., crop, livestock, and forest integration systems. Additionally, regions of agricultural expansion, such as the area of transition between the Amazon and Cerrado (Brazilian tropical savanna) biomes, in the state of Mato Grosso, require a better understanding of the aspects related to water and soil losses in diferent settings of soil uses and ground covers. In the study of diferent soil uses and ground covers, it is hypothesized that treatments with a tree component are more efective in reducing water and soil losses.
The aim of the present study was to evaluate water and soil losses under natural rainfall in integrated and monocrop systems in the region of transition between the Amazon and Cerrado biomes in the north of the state of Mato Grosso, Brazil.
MATERIALS AND METHODS
The study was carried out in the experimental ield of Embrapa Agrosilvopastoral, located in Sinop, MT, Brazil (11° 51’ 50.25” S and 55° 37’ 39.65” W; 364 m altitude). The climate of the region, according to the Köppen classiication, is an Aw (tropical) type, with average annual temperature of 24.7 °C and annual rainfall of 1,974 mm (Souza et al., 2013). The soil in the experimental site is classiied as a Latossolo
Vermelho-Amarelo Distróico (Santos et al., 2013), a Udox (Soil Survey Staf, 2014) of clayey texture with A-moderate horizon, in which the 0.00-0.20 m (A horizon) and 0.20-1.00 m (B horizon) layers have 510 and 560 g kg-1 clay, respectively,
The experimental plot began to be deforested in 1984 for cassava (Manihot esculenta Crantz) production (Araujo et al., 2009); this deforestation ended in the 2000s. In the early 1990s, the area started to be planted to rice (Oryza sativa L.) and later soybean (Glycine max (L.) Merr.) (Diel et al., 2014). From 2002-2007, it was cultivated with soybean and winter corn (Zea mays L.), in a conventional system. In the 2007/2008 and 2008/2009 crop seasons, soybean and cotton (Gossypium hirsutum L.) were grown in succession. In the 2010/2011 crop season, the area remained fallow. To set up the experiment, soil decompaction operations were conducted (i.e. subsoiling at 0.40 m and mild harrowing) to make the soil structure more uniform. After these operations, which were performed in November and December 2011, the following activities were performed, constituting the treatments used in each plot: PAS – pasture (Brachiaria brizantha cultivar Marandu); CFI – crop-forest integration, containing triple rows of the eucalyptus (Eucalyptus urograndis) clone h13 as the tree component, with a 3.5 × 3 m spacing and 30 m between rows, intercropped with soybean and corn; EUC – eucalyptus plantation (Eucalyptus urograndis, clone h13); CRP – soybean and corn crop succession; NGC – no ground cover; and FRS – forest.
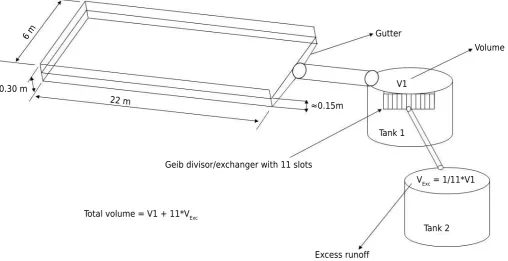
The experimental unit consisted of a plot measuring 22 × 6 m (132 m2) delimited on top and on the sides by 3.00 × 0.30 m galvanized steel sheets ixed in the soil at a depth of approximately 0.15 m. The plot length followed the slope line of the terrain. Runof-collection gutters were set up at the lower extremity, where surface runof was conducted to collection tanks through a PVC tube. The collection system consisted of two 1,000 L water tanks. Between the collection tanks, a Geib divisor with 11 slots was installed to conduct 1/11 of the excess runof from the irst to the second tank (Figure 1).
The average slopes of the plots studied were 3 % for the treatment forest (FRS), and 1.5 % for the other treatments. Soil bulk density (BD) was determined from collecting samples in bulk density rings, in an evaluation made at the end of 2012 and in early 2013. The BD data in the 0.00-0.10 m layer were determined from an average of 16 values per treatment. The following results were obtained: 1.02 Mg m-3 (FRS); 1.16 Mg m-3 (CFI);
1.17 Mg m-3 (NGC); and 1.19 Mg m-3 (PAS and EUC).
Figure 1. Experimental design of water and sediment collector system.
Excess runoff
Total volume = V1 + 11*VExc
Tank 2 Tank 1
VExc = 1/11*V1
Geib divisor/exchanger with 11 slots
V1
Volume 1 Gutter
≈0.15m 22 m
Soil tillage and sowing of plants in rows were performed perpendicular to the slope. Corn was sown in rows spaced at 0.50 m, and plant spacing was 0.20 m; soybean was sown with 0.50 m spacing between rows and 20 plants per linear meter; pasture was sown with rows spaced at 0.50 m, with 30 seeds per linear meter; and eucalyptus was planted through opening furrows (with a furrower), at a spacing of 3 × 3 m and 1,111 plants ha-1.
Collections to determine soil and water losses were performed after rainfall events that caused surface runof in the period from November 2012 to September 2013. Collections performed in the same month were grouped to determine the average monthly losses of soil and water.
Aiming to quantify soil and water losses, samples of runof and sediments were collected from the water tanks. Coarse sediments were held in a 50 L cotton bag installed in the irst tank. After the runof present in the tanks was homogenized, 1 L aliquots were collected, taken to the laboratory, and iltered with quantitative ilter paper to determine the suspended sediments. The iltered material and coarse sediments were dried in an oven at 105 °C for dry matter determination.
In the determination of rainfall erosivity, monthly rainfall data obtained at the experimental site during the collection periods were used. Subsequently, monthly erosivity (EI30m)
was calculated according to the equation proposed by Almeida et al. (2012).
For comparison purposes, soil losses were adjusted for the degree of slope (S factor) of 0.09 m m-1 of the standard plot from the Revised Universal Soil Loss Equation (RUSLE)
deined, according to McCool et al. (1987), by equation 1.
S = 10.8 senθ + 0.03 Eq. 1 where S is the slope factor (dimensionless); and θ is the terrain slope angle.
Therefore, with S being the ratio between soil loss in a plot with any slope (SL) and the soil loss in the standard plot (SLR), the correction equation is given below (Equation 2).
SLR = SL
S 1
Eq. 2
Tolerance to soil loss by water erosion was calculated by the expression adopted by Lombardi Neto and Bertoni (1975) (Equation 3), as follows:
T = h × r × 1,000-1 Eq. 3
where T is soil-loss tolerance (mm yr-1); h is efective soil depth (mm), limited to 1,000 mm;
and r is efect of the textural relationship between horizons B and A in the weighting of soil losses (g kg-1)/(g kg-1).
The soil sediment-carrying capacity (SCC) was calculated according to Martins et al. (2010), by dividing the soil losses in mg ha-1 yr-1 by the water losses in mm yr-1.
Datasets including all water and soil losses (30 rainfall events) were tested as to their normality by the Shapiro-Wilk test for later analysis of means, central values (trends), and their variability. Analyses were run using the R free software.
RESULTS AND DISCUSSION
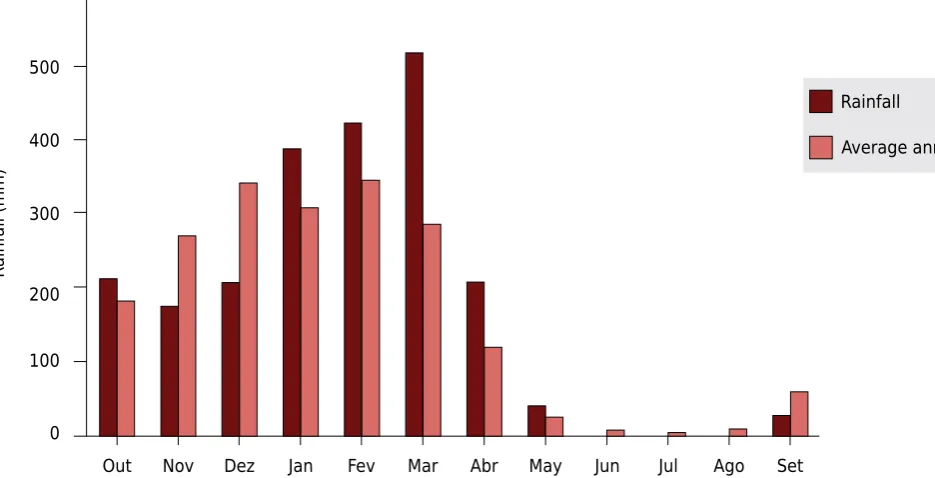
Total rainfall in the period studied was 1,997.1 mm, with 384.2 mm in 2012 and 1,612.95 mm in 2013, concentrated in the period from January to March 2013 (Figure 2). The same was found for rainfall erosivity, which peaked in the months with greatest rainfall: 2,789.24; 3,009.18; and 3,624.89 MJ mm ha-1 h-1 in January, February, and March, respectively, amounting to an annual
of Mato Grosso were studied by Almeida et al. (2012); they found 16,220 MJ mm ha-1 h-1 yr-1 in
Vera (a town neighboring Sinop), which is very similar to the result found here, demonstrating the erosivity potential of rainfall in these municipalities and the care that should be taken in maintaining ground cover to lessen the impact of raindrops and soil disintegration.
After analysis of normality of all water and soil loss data (from the onset of the rainy period of 2012 to the end of the dry period of 2013) by the Shapiro-Wilk test, it was found that the datasets did not have a normal distribution (p<0.01). The mean and total values (tables) and central values (trends) and the variability of the data were then analyzed by the boxplot diagram.
The values obtained for water loss ranged from 10.3 to 675.3 mm, which represented 0.5 % and 33.8 % of the rainfall accumulated in the period studied in the FRS and NGC treatments, respectively (Table 1). It should be noted that the water losses in the NGC treatment were 17 times higher than the average of those in the other treatments, which shows the efect of plant cover on reduction of surface runof. This reduction in the FRS treatment is a result of interaction among the processes of interception, reduction in kinetic energy from rainfall, and greater opportunity for water iniltration resulting from the runof delayed due to residue present on the soil surface, which does not occur in NGC.
In the municipality of Lavras, MG, Carvalho et al. (2007) found 298 mm of water loss in an Argissolo Vermelho Amarelo (Ultisol) without ground cover. However, total rainfall was 1,429 mm and rainfall erosivity was 8,102 MJ ha-1 h-1 yr-1. In Lavras, MG, Silva et al. (2005) found water loss values of 371 mm and 114 mm (rainfall erosivity of 4,865 MJ mm ha-1 h-1 yr-1) in a Cambissolo Háplico (Inceptisol) and
Latossolo Vermelho (Udox), respectively, with a slope greater than 0.12 m m-1. The water loss values found by these
authors, even for higher slopes, are lower than those observed here, which may be due mainly to the lower erosive potential of rainfall in the regions referred to in these studies.
Disregarding the soil with no ground cover, in the months from January to April 2013, it was observed that the highest water loss values occurred in the EUC treatment. However, in February, losses were relatively higher in PAS due to the cultivation practices performed in this treatment.
Figure 2. Monthly and average annual rainfall from October 2012 to September 2013. 600
500
400
300
200
100
0
Ra
infall (mm)
Rainfall
Average annual rainfall
The higher losses in EUC are possibly because it was at the beginning of its development, with no accumulation of plant litter (which contributes to increasing surface roughness); low interception by the tree crown and the cultivation practices used may have facilitated surface runof as well. According to Pires et al. (2006), in the early development of eucalyptus, the soil is more exposed because of setting up the plantation, which intensiies water losses. The authors found 77 mm of runof losses for contour planting of Eucalyptus with an average slope of 0.33 m m-1 in the municipality of Belo Oriente, MG (average
rainfall of 700-1,500 mm yr-1).
In November and December, the greatest water losses were found in the PAS treatment; this efect might have been a result of the removal of most of the fresh matter that was in the plot for use as hay, thereby reducing ground cover. The highest losses observed in February, in turn, may be associated with mowing of the pasture, also reducing ground cover, which, together with a considerable increase in rainfall in that month, might have facilitated surface runof. Water loss values (also in pasture) of 9.23 mm in a Latossolo
Vermelho Distróico típico (Haplortox) with 0.19 m m-1 slope were found by Brito et al. (2005). These authors observed that the average rainfall in the region studied (Vale do Rio Doce, MG) did not exceed 1,200 mm yr-1.
The FRS and CFI treatments showed the lowest water loss values, especially demonstrating the importance of the tree component associated with ground cover in reducing the kinetic energy of the rain, which beneits iniltration time and reduction in runof. In their study, as here, Martins et al. (2003) and Brito et al. (2005) found small water losses in the forest, associating this result with the synergistic efect of the high interception capacity of the forest, considerable accumulation of plant residue and better soil structure resulting from the root system of the trees and from microbiological activity.
For the CRP treatment, water losses ranged from 1.4-14.9 mm, which were the highest values observed in the period of February and March, coinciding with soybean harvest and corn sowing, respectively, as well as a period of high rainfall erosivity.
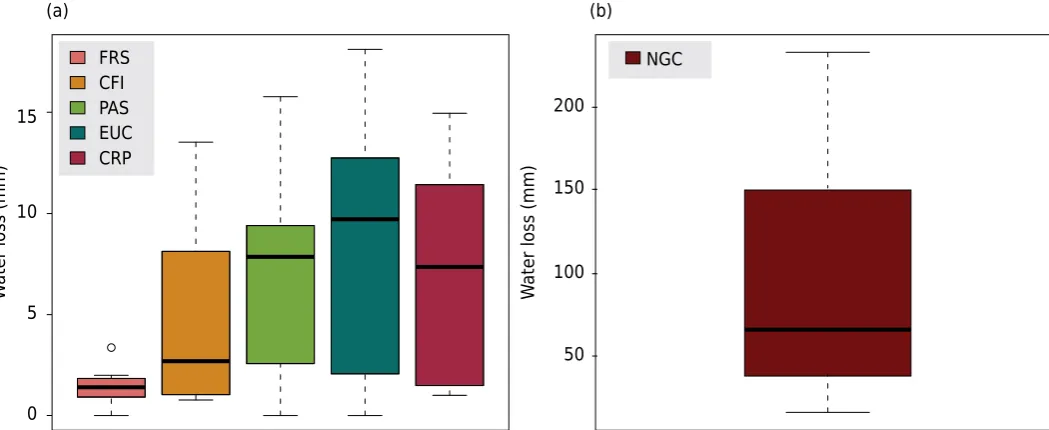
An increase can be observed in the central (black horizontal line) values (trends) of water loss for the FRS, CFI, CRP, PAS, and EUC treatments (Figure 3a). These values were very close to the CRP and PAS treatments. As regards data variability (i.e., the length of
Month NGC PAS CFI EUC CRP FRS Rainfall
mm % mm % mm % mm % mm % mm % mm
2012
November 26.5 15.1 3.5 2.0 1.0 0.6 2.3 1.3 1.5 0.8 1.0 0.6 175.2
December 50.7 24.2 10.1 4.8 2.7 1.3 9.7 4.6 7.4 3.5 1.7 0.8 209.0
2013
January 90.1 23.0 8.7 2.2 6.9 1.8 10.2 2.6 8.5 2.2 2.0 0.5 390.9
February 206.9 48.7 15.8 3.7 13.5 3.2 15.2 3.6 14.3 3.4 1.4 0.3 424.6
March 234.3 45.1 7.8 1.5 9.3 1.8 18.1 3.5 14.9 2.9 3.4 0.6 520.1
April 66.8 32.1 1.6 0.8 1.1 0.5 1.8 0.9 1.5 0.7 0.8 0.4 208.2
May 0 0 0 0 0 0 0 0 0 0 0 0 41.1
June 0 0 0 0 0 0 0 0 0 0 0 0 0
July 0 0 0 0 0 0 0 0 0 0 0 0 0
August 0 0 0 0 0 0 0 0 0 0 0 0 0
September 0 0 0 0 0 0 0 0 0 0 0 0 28.1
Total 675.3 33.8 47.5 2.4 34.5 1.7 57.4 2.9 48.1 2.4 10.3 0.5 1997.1
the boxplot diagram box), similar variations are observed for the CFI and PAS and the EUC and CRP treatments, the latter two having the highest values. After that is the FRS treatment, with outstanding values, showing the least data variability (i.e the smallest boxplot diagram box), as well as an outlier value, i.e., a value that diverges from the others in the dataset (open circle over the boxplot diagram box). This value occurred in March, possibly because this month had the highest volume of rainfall recorded in the evaluation period. Finally, the NGC treatment has the highest central value and variability (Figure 3b), much higher than the others. The variability observed in the diferent treatments is dependent on their runof capacity, which, in turn, depends on the ground cover characteristics and the cultivation practices performed, as previously mentioned. In NGC, the lack of a cover crop and the sealing that occurs in the soil surface layer during the rainy period greatly contributes to conversion of the rainfall depth into surface runof.
Monthly soil loss (SL) values ranged from 0.0002 to 5.57 mg ha-1 in the FRS and NGC treatments, respectively, with the following ascending order of annual losses: FRS, PAS, EUC, CFI, CRP, and NGC (Table 2). Excluding the NGC treatment, in January, the CRP and EUC treatments had the greatest losses, which may be associated with the fact that these treatments were still in the initial development stage, with little ground cover.
For the CRP treatment, the highest SL occurred from December to April, which was higher than the other treatments (except for NGC). This was probably because the soybean crop did not occupy the space between rows in the beginning of December, whereas at the last stage of the crop cycle (i.e. the end of January), a considerable amount of plant residue was present, helping to reduce runof and, consequently, soil loss. Another noteworthy fact is that the soybean crop was harvested in February and, subsequently, the corn crop was sown, leaving the soil with little ground cover in periods of greater rainfall and erosivity, favouring the water erosion process.
Other authors have found soil losses similar to those obtained here, e.g., Cogo et al. (2003), who obtained soil losses in soybean under direct sowing in a Latossolo Vermelho
Distroférrico (Haplorthox) in the region of Missões, RS, and Schick et al. (2000), who studied soil losses in a Cambissolo Humico Alumínico (Inceptisol) in Lages, SC, and obtained 0.23 Mg ha-1 for intercropping of soybean and corn.
Figure 3. Boxplot of water loss for: (a) forest (FRS), crop-forest integration (CFI), pasture (PAS), eucalyptus plantation (EUC), soybean and corn crop succession (CRP); and (b) no ground cover (NGC).
0 5 10 15
50 100 150 200 FRS
CFI PAS
CRP
(a) (b)
Wa
ter loss (mm)
Wa
ter loss (mm)
EUC
An analogy to what happened in the CRP treatment can be made with the PAS treatment, which showed higher SL values in January and February due to ground cover reduction caused by mowing. In March and April, however, SL was reduced because the pasture resumed its growth, providing greater ground cover.
Regarding the CFI treatment, relatively low SL was observed in January and a high value in February. The latter month coincided with the beginning of the soybean harvest and subsequent corn sowing, reducing ground cover and generating soil turnover in this period. With crop development in the following months, SL was found to decrease in this treatment.
In the EUC treatment, soil losses oscillated, with the highest values in January and a gradual decrease in SL over the period studied, which is consistent with development of the crop, because the area of projection of the tree crown grows, allowing greater rain interception and a decrease in kinetic energy. Moreover, with development of eucalyptus, the presence of plant residue on the soil increases, which also contributes to reducing runof and transport of sediments.
Soil losses in the NGC treatment were higher than those found in the other treatments in all the months studied, with the highest values observed for the months with the greatest rainfall. Soil and water losses in a Latossolo Vermelho Aluminoférrico (Udox) under diferent tillage and cultivation systems under natural rainfall were evaluated by Beutler et al. (2003), who also observed values similar to those found here. Similar values in a Cambissolo Húmico Alumínico (Inceptisol) in Lages, SC, were found by Schick et al. (2000). The results of Guadagnin et al. (2005) in the Planalto Sul Catarinense region also corroborated our values.
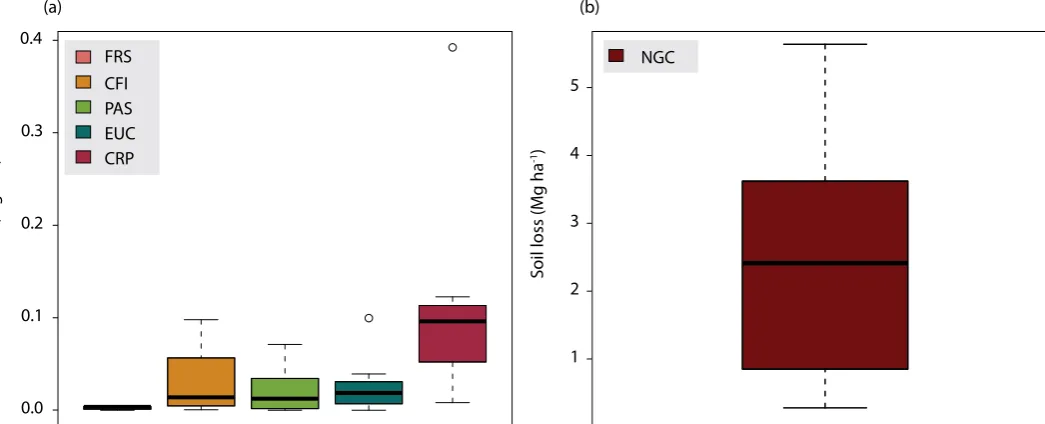
The FRS treatment had the lowest (near zero) central value (trend) and lowest variability (boxplot diagram box size) of the dataset, demonstrating the high capacity of FRS in lowering soil loss throughout the entire rainy period (Figure 4). Regarding the CFI, PAS, EUC, and CRP treatments, the irst three had very similar central values (trends), whereas the CRP treatment had a higher value. Data variability was higher in the CRP treatment, followed by CFI, PAS, and EUC. This variability may be related mainly to changes that (1)
SL: observed soil loss; (2)
SLR: soil loss in the standard plot.
Month NGC PAS CFI EUC CRP FRS
SL(1)
SLR(2)
SL SLR SL SLR SL SLR SL SLR SL SLR
Mg ha-1
2012
November 0.898 4.679 0.012 0.065 0.051 0.267 0.100 0.519 0.096 0.501 0.005 0.014
December 2.387 12.435 0.027 0.142 0.098 0.510 0.019 0.097 0.104 0.541 0.004 0.010
2013
January 4.280 22.296 0.041 0.215 0.009 0.045 0.039 0.204 0.076 0.397 0.004 0.010
February 5.569 29.010 0.071 0.371 0.062 0.322 0.013 0.070 0.392 2.043 0.002 0.006
March 2.880 15.004 0.003 0.013 0.014 0.073 0.022 0.117 0.123 0.639 0.004 0.012
April 0.809 4.212 0.001 0.005 0.000471 0.002 0.000476 0.002 0.028 0.146 0.000237 0.001
May 0 0 0 0 0 0 0 0 0 0 0 0
June 0 0 0 0 0 0 0 0 0 0 0 0
July 0 0 0 0 0 0 0 0 0 0 0 0
August 0 0 0 0 0 0 0 0 0 0 0 0
September 0 0 0 0 0 0 0 0 0 0 0 0
Total 16.824 87.635 0.156 0.811 0.234 1.218 0.194 1.009 0.819 4.266 0.019 0.053
Table 2. Total and monthly soil loss for each treatment (NGC – no ground cover; PAS – pasture; CFI – crop-forest integration; EUC – eucalyptus plantation; CRP – soybean and corn crop succession, and FRS – forest) and adjusted values for the standard plot (slope of 0.09 m m-1
take place in the systems throughout the crop cycles, due to management practices, planting, and harvesting. For instance, because the CFI treatment received greater human intervention than PAS (due to the crop component), it showed greater variability than PAS, which was subjected to only one mowing during the period evaluated. Because it received the least intervention, the EUC treatment displayed lower variability compared to the CFI and PAS treatments, although it had a slightly higher central value. Only the EUC and CRP treatments showed outlier values, that is, values that diverge from the dataset of the referred treatments. Finally, in igure 4b, it can be observed that the NGC treatment had the highest central value (trend) for soil loss and the greatest variability, which was well above the other treatments. This result is related to the lack of ground cover, which leads to conversion of rainfall depth into surface runof, causing greater soil disintegration and loss.
The limit for soil loss tolerance found for the soil in the area studied was 1.11 mm yr-1,
i.e., 11.1 mg ha-1 yr-1, which is higher than the soil losses found in all treatments, except
for that without ground cover.
These data emphasize the importance of ground cover and its maintenance throughout the months of rain. Soil loss values of 18 mg ha-1 yr-1 in a
Latossolo Vermelho (Udox) in a plot of soil with no ground cover were found by Carvalho et al. (2007); the tolerance limit was 12.70 mg ha-1 yr-1. Soil loss values of 55.74 mg ha-1 yr-1 in a
Latossolo Vermelho
Distroférrico típico (Haplorthox) were obtained by Silva et al. (2005), which was also above the tolerance limit.
The annual sediment-carrying capacity values in mg ha-1 mm-1 of rainfall are shown in igure 5, both for the area studied (SL) and for the standard plot (SLS) for the slope of 0.09 m m1.
The values ranged from 0.002 to 0.025 mg mm-1 ha-1, and, as observed for the water and soil losses, the upper and lower values were obtained in the FRS (minimum) and NGC (maximum), treatments, demonstrating the efect of ground cover.
For the other treatments, sediment-carrying capacity values were found in decreasing order in PAS, EUC, CFI, and CRP. It should be stressed that this descending order of sediment-carrying capacity is in line with the ground cover potential of the diferent treatments, which facilitates interception and reduction of kinetic energy from the rain, as also observed by Brito et al. (2005).
Figure 4. Boxplot of soil loss for: (a) forest (FRS), crop-forest integration (CFI), pasture (PAS), eucalyptus plantation (EUC), soybean and corn crop succession (CRP); and (b) no ground cover (NGC).
Greater sediment-carrying capacity found in the CRP treatment is probably related to the more intensive cultivation practices adopted in that area (viz., harvesting and planting) during the rainy period, which means that in this treatment, at the time around the harvest of corn and planting of soybean, the soil had less ground cover, undergoing the direct impact of raindrops. This process modiied the soil structure, reducing iniltration and increasing surface runof, which facilitated soil loss. Cardoso et al. (2012) evaluated the efects of cover crops on water and soil losses and observed values similar to those found in PAS, EUC, and CFI.
CONCLUSIONS
Treatments including a tree component (CFI, EUC, and FRS) were more efective in reducing water and soil losses compared to the CRP and NGC treatments.
Soil losses were inluenced by soil use, showing values lower than the annual tolerance limit, which was 1.11 mm for the area studied, except for the soil without ground cover, which was 1.44 mm yr–1, i.e., 30 % higher than the tolerance limit.
Soil and water losses vary with soil use; lower values were found in the CFI treatment compared to the CRP treatment.
ACKNOWLEDGMENTS
The authors thank the Embrapa Agrossilvipastoril, the Federal University of Mato Grosso (UFMT) through the graduate studies program in Agronomy (Sinop Campus), the National Council of Scientiic and Technological Development (CNPq) and the Mato Grosso State Research Foundation (FAPEMAT).
REFERENCES
Almeida COS, Amorim RSS, Eltz FLF, Couto EG, Jordani AA. Erosividade da chuva em municípios do Mato Grosso: distribuição sazonal e correlações com dados pluviométricos. Rev Bras Eng Agric Amb. 2012;16:142-52. doi:10.1590/S1415-43662012000200003
Figure 5. Annual soil sediment-carrying capacity for each treatment (SCC) and adjusted values for the standard plot (SCCSP), with slope of 0.09 m m-1
. NGC: no ground cover, PAS: pasture, CFI: crop-forest integration, EUC: eucalyptus plantation, CRP: soybean and corn crop succession, FRS: forest.
Soil Sediment Ca
rr
ying Capacit
y
(Mg mm
-1 ha -1)
NGC PAS CFI EUC CRP FRS
1.4
1.2
1.0
0.8
0.6
0.4
0.2
0.0
SCCSP
Amorim RSS, Silva DD, Pruski F, Matos AT. Avaliação do desempenho dos modelos de predição da erosão hídrica USLE, RUSLE e WEPP. Eng Agríc. 2010;30:1046-9. doi:10.1590/S0100-69162010000600006
Araujo RA, Costa RB, Felili JM, Gonçalvez IK, Sousa RATM, Dorval A. Florística e estrutura de fragmento lorestal em área de transição na Amazônia Matogrossense no Município de Sinop.
Acta Amaz. 2009;39:865-78. doi:10.1590/S0044-59672009000400015
Bertol I, Almeida JA. Tolerância de perda de solo por erosão para os principais solos do estado de Santa Catarina. Rev Bras Cienc Solo. 2000;24:657-68. doi:10.1590/S0100-06832000000300018
Beutler JF, Bertol I, Veiga M, Wildner LP. Perdas de solo e água num Latossolo Vermelho aluminoférrico submetido a diferentes sistemas de preparo e cultivo sob chuva natural. Rev Bras Cienc Solo. 2003;27:509-17. doi:10.1590/S0100-06832003000300012
Brito LF, Pires LS, Ferreira MM, Silva MLN, Curi N, Leite FP. Erosão hídrica de Latossolo Vermelho muito argiloso relevo ondulado em área de pós-plantio de eucalipto no Vale do Rio Doce, região Centro Leste do Estado de Minas Gerais. Sci For. 2005;67:27-36.
Cardoso DP, Silva MLN, Carvalho GJ, Freitas DAF, Avanzi JC. Plantas de cobertura no controle das perdas de solo, água e nutrientes por erosão hídrica. Rev Bras Eng Agric Amb. 2012;16:632-8. doi:10.1590/S1415-43662012000600007
Carvalho R, Silva MLN, Avanzi JC, Curi N, Souza FS. Erosão hídrica em Latossolo Vermelho sob diversos sistemas de manejo do cafeeiro no sul de Minas Gerais. Cienc Agrotec. 2007;31:1679-87. doi:10.1590/S1413-70542007000600012
Castro Filho C, Muzilli O, Podanoschi AL. Estabilidade dos agregados e sua relação com o
teor de carbono orgânico em um Latossolo Roxo distróico, em função de sistemas de plantio,
rotações de culturas e métodos de preparo das amostras. Rev Bras Cienc Solo. 1998;22:527-38. doi:10.1590/S0100-06831998000300019
Cogo NP, Levien R, Schwarz RA. Perdas de solo e água por erosão hídrica inluenciadas por
métodos de preparo, classes de declive e níveis de fertilidade do solo. Rev Bras Cienc Solo. 2003;27:743-53. doi:10.1590/S0100-06832003000400019
Cruz ES. Inluência do preparo de solo e de plantas de cobertura na erosão hídrica de um Argissolo
Vermelho-Amarelo [dissertação]. Seropédica: Universidade Federal Rural do Rio de Janeiro; 2006.
Diel D, Behling M, Farias Neto AL, Isernhagen ECC. Distribuição horizontal e vertical de fósforo
em sistemas de cultivos exclusivos de soja e de integração lavoura-pecuária-loresta. Pesq
Agropec Bras. 2014;49:639-47. doi:10.1590/S0100-204X2014000800008
Guadagnin JC, Bertol I, Cassol PC, Amaral AJ. Perdas de solo, água e nitrogênio por erosão hídrica em diferentes sistemas de manejo. Rev Bras Cienc Solo. 2005;29:277-86. doi:10.1590/S0100-06832005000200013
Lima PLT, Silva MLN, Curi N, Quinton J. Soil loss by water erosion in areas under maize and jack beans intercropped and monocultures. Cienc Agrotec. 2014;38:129-39. doi:10.1590/S1413-70542014000200004
Lombardi Neto F, Bertoni J. Tolerância de perdas de terra para solos do Estado de São Paulo.
Campinas: Instituto Agronômico de Campinas; 1975. (Boletim técnico, 28).
Mannigel AR, Carvalho MP, Moreti D, Medeiros LR. Fator erodibilidade e tolerância de perda dos solos do Estado de São Paulo. Acta Sci Agron. 2002;5:1335-40.
Martins SG, Silva MLN, Avanzi JC, Curi N, Fonseca S. Fator cobertura e manejo do solo e perdas de solo e água em cultivo de eucalipto e em Mata Atlântica nos Tabuleiros Costeiros do estado do Espírito Santo. Sci For. 2010;38:517-26.
Martins SG, Silva MLN, Curi N, Ferreira MM, Fonseca S, Marques JJGSM. Perdas de solo e água
por erosão hídrica em sistemas lorestais nas regiões de Aracruz (ES). Rev Bras Cienc Solo.
2003;27:395-403. doi:10.1590/S0100-06832003000300001
Nunes JG, Campos MCC, Oliveira FP, Nunes JC. Tolerância de perda de solo por erosão na região sul do Amazonas. Ambiência. 2012;14:854-68.
Palmeira PRT, Pauletto EA, Teixeira CFA, Gomes AS, Silva JB. Agregação de um Planossolo submetido a diferentes sistemas de cultivo. Rev Bras Cienc Solo. 1999;23:189-95. doi:10.1590/S0100-06831999000200001
Panachuki E, Bertol I, Sobrinho TA, Oliveira PTS, Bicca DB. Perdas de solo e de água e
iniltração de água em Latossolo Vermelho sob sistemas de manejo. Rev Bras Cienc Solo.
2011;35:1777-85. doi:10.1590/S0100-06832011000500032
Pires LS, Silva MLN, Curi N, Leite FP, Brito LF. Erosão hídrica pós-plantio em lorestas de
eucalipto na região centro-leste de Minas Gerais. Rev Bras Cienc Solo. 2006;41:687-95. doi:10.1590/S0100-204X2006000400021
Schick J, Bertol I, Balbinot Junior AA, Batistela O. Erosão hídrica em Cambissolo Húmico alumínico submetido a diferentes sistemas de preparo e cultivo do solo: I. Perdas de solo e água. Rev Bras Cienc Solo. 2000;24:427-36. doi:10.1590/S0100-06832000000200019
Santos HG, Jacomine PKT, Anjos LHC, Oliveira VA, Lumbreras JF, Coelho MR, Almeida JA, Cunha TJF,
Oliveira JB. Sistema brasileiro de classiicação de solos. 3ª.ed. rev. Brasília, DF: Embrapa; 2013.
Silva AM, Silva MLN, Curi N, Lima JM, Avanzi JC, Ferreira MM. Perdas de solo, água, nutrientes e carbono orgânico em Cambissolo e Latossolo sob chuva natural. Pesq Agropec Bras. 2005;40:1223-30. doi:10.1590/S0100-204X2005001200010
Silva IF, Mielniczuk J. Sistemas de cultivo e características do solo afetando a estabilidade de agregados. Rev Bras Cienc Solo. 1998;22:311-17. doi:10.1590/S0100-06831998000200017
Soil Survey Staf. Keys to soil taxonomy. 12th
.ed. Washington, DC: United States Department of Agriculture, Natural Resources Conservation Service; 2014.
Souza AP, Mota LL, Zamadei T, Martim CC, Almeida FT, Paulino J. Classiicação climática
e balanço hídrico climatológico no estado de Mato Grosso. Nativa. 2013;1:34-43. doi:10.14583/2318-7670.v01n01a07
Volk LBS, Cogo NP. Erosão hídrica, em três momentos da cultura do milho, inluenciada