A NOVEL 3D CITY MODELLING APPROACH FOR SATELLITE STEREO DATA USING
3D ACTIVE SHAPE MODELS ON DSMS
Beril Sirmacek, Hannes Taubenboeck, Peter Reinartz
German Aerospace Center (DLR), Earth Observation Center (EOC) PO Box 1116, 82234, Wessling, Germany
(Beril.Sirmacek, Hannes.Taubenboeck, Peter.Reinartz)@dlr.de
Commission III/4
KEY WORDS:Building, Modelling, City, DSM/DTM
ABSTRACT:
Since remote sensing provides new sensors and techniques to accumulate stereo data on urban regions, three-dimensional (3D) repre-sentation of these regions gained much interest for various applications. 3D urban region reprerepre-sentation can e.g. be used for detailed urban monitoring, change and damage detection purposes. In order to obtain 3D representation, one of the easiest and cheapest way is to use Digital Surface Models (DSMs) which are generated from very high resolution stereo satellite images using stereovision tech-niques. Unfortunately after applying the DSM generation process, we cannot directly obtain a full 3D urban region representation. In the DSM which is generated using only one stereo image pair, generally noise, matching errors, and uncertainties on building wall loca-tions are very high. These undesirable effects prevents a DSM to provide a realistic 3D city representation. Therefore, some automatic techniques should be applied to obtain real 3D city models using DSMs as input. In order to bring a solution to the existing problems in this field, herein we propose a fully automated approach based on the usage of a novel 3D active shape model. Our experimental results on DSMs of Munich city which are obtained from different satellite (Cartosat-1, Ikonos, WorldView-2) and airborne sensors (3K camera, HRSC, and LIDAR) indicate possible usage of the algorithm to obtain 3D city representation results automatically.
1 INTRODUCTION
As satellite and airborne sensor technology provides higher imag-ing qualities, especially 3D representation of cities gained much interest for various applications. For obtaining 3D representa-tion, Digital Surface Models (DSMs) can be generated from opti-cal stereo satellite or aerial images using stereovision techniques, or they can also be obtained by using LIDAR sensor technol-ogy. As a challenge, for satellite data, in most of the cases, just one stereo image pair is available for DSM generation. Unfortu-nately, after applying an automatic DSM generation process, due to the occlusion effects and stereo matching errors these DSMs do not correctly represent 3D city models with steep building walls and detailed rooftop representations. This is a major problem es-pecially for DSMs which are generated over city centers, since many regions are occluded by dense and complex building struc-tures. Although these occluded regions can be filled by interpola-tion, these techniques lead to a decrease in sharpness of building walls. Besides, deficiencies in the stereo matching process may cause noise within DSMs, e.g. due to shadow areas. Therefore, automatically obtaining 3D city models from DSMs is still an open and challenging problem for researchers.
In the previous work there is a wide variety of studies on building detection and shape extraction from two-dimensional single satel-lite or aerial images. The earliest studies in this field generally depend on edge and line extraction (Krishnamachari and Chel-lappa, 1996, Irvin and McKeown, 1989, Davis, 1982). Unfortu-nately, these methods generally fail to detect individual buildings which have highly textured rooftops or which appear in com-plex environments. In order to cope with this problem, Saeedi and Zwick (Saeedi and Zwick, 2008) combined edge informa-tion with graph based segmentainforma-tion results of the region. Many researchers developed more advanced methods to extract shapes of the detected buildings (Karantzalos and Paragios, 2009, Cui et al., 2008, Benedek et al., 2009). Sirmacek and Unsalan (Sirma-cek and Unsalan, 2010) developed a fast method to detect shapes
where each particle stands for an urban object. Preknowledge about building shapes is used to model these particles. Arefi et al. (Arefi et al., 2008) extracted above-ground objects from LI-DAR data. Then, 3D buildings are reconstructed by hierarchical fitting of minimum boundary rectangles (MBR) and a RANSAC based straight line fitting algorithm. Kada and McKinley (Kada and McKindley, 2009) introduced an approach for the automatic reconstruction of 3D building models. Again they used existing building groundfloor plans and LIDAR DSMs. Using building footprints they decomposed the building shape into sets of non-intersecting cells, and for each cell the rooftop is reconstructed by checking the normal directions of the DSM. Tournaire et al. (Tournaire et al., 2010), developed a stochastic geometry based on an algorithm to detect building footprints from DSM data which have less than 1mresolution. They tried to fit rectangles on the buildings using an energy function and prior knowledge about buildings. To minimize the energy function, they used a Reversible Jump Monte Carlo Markov Chain (RJMCMC) sam-pler coupled with a simulated annealing algorithm which leads to an optimal configuration of objects. Maas (Maas, 1999) used maximum slope values in order to determine best fitting rooftype shapes to generate 3D building models. Valero et al. (Valero et al., 2008) developed a feature extraction and classification based method to classify building roofs into two classes as flat-roof and gable-roof. They estimated ridge-line positions which are based on skeletons of groundfloor plans. They provided the dif-ference between the average roof outline height and the average ridge-line height as first feature, and the norm of the orthorecti-fied image gradient as second feature for the support vector ma-chine (SVM) classifier. In all introduced studies, good results are achieved generally using very high resolution (better than 1 m spatial resolution) DSMs which are generally generated from airborne images or LASER scan data. However, enhancement of buildings in low resolution urban DSM data which are generated from satellite images is still an open research problem. On the other hand, generally previous approaches require manual extrac-tion of building outlines or providing groundfloor maps as input. In order to bring an automated solution to this problem, in previ-ous work we have proposed a novel technique for obtaining 3D city representations by applying a building shape and rooftop-type detection approach to DSMs (Sirmacek et al., 2012). We started by applying local thresholding to raw DSMs in order to extract high urban objects which can indicate building locations. We have extracted building shapes from regions which are ob-tained from a thresholding result by using a binary active shape growing algorithm. This methodology depends on growing rect-angular shapes in elongated segments which are detected in bi-nary masks obtained by thresholding the DSM. After extracting the building shapes, we generated 3D models by understanding the building rooftop-types. Herein, we follow a similar approach to reconstruct 3D city models, however for active shape growing we propose a novel approach which uses 3D information in calcu-lating shape fitting criteria. Using this new method, we increase the robustness of complex building shape extraction which in turn increases robustness of 3D reconstruction. Besides introducing a new methodology, our experiments also provide and insight on applicabilities of DSMs obtained from different sensors.
2 DETECTING POSSIBLE BUILDING SEGMENTS FROM DSMS
In this step, we would like to detect approximate building loca-tions from the DSM before extracting building shapes. If a digital terrain model (DTM) of the region is available, we could use it to calculate a normalized digital elevation model (nDEM). In a nDEM, ground height is referenced to zero, therefore it only
pro-vides information about building heights independent from the height of the terrain. If a nDEM could be calculated, we could simply threshold it with a constant value in order to obtain high objects which can represent buildings or trees. In our study, we segment high objects directly from the DSMs by applying a lo-cal thresholding. Therefore, the algorithm can be also used for regions which do not have corresponding DTM data. In local thresholding, a100×100pixel size sliding window is used over
the DSM, and a new threshold value is calculated for each region under the sliding window. This window size is chosen by con-sidering approximate building sizes in given DSMs of the study region. However, the thresholding result does not differ signifi-cantly with slight changes of window size or with slight changes of input image resolution. Therefore, we can use the same win-dow size for our input DSMs with different geometric resolutions.
After applying local thresholding to the DSM (D(x, y)), we ob-tain a binary image (BD(x, y)) where high objects are labeled
with value1. We apply labeling toBD(x, y)to obtain its
con-nected components (Sonka et al., 1999). Here each concon-nected component represents a building segment. If the size of a con-nected component is less thanRpixels we discard it since these small regions generally correspond to tree clusters. Considering geometric resolutions of input DSMs, we assume theRvalue as 100, since building objects cannot be smaller than this pixel size in our input DSMs. However, this value should be fixed by con-sidering minimum sizes of the buildings in study regions before starting to run the algorithm on DSMs. In Fig. 1(a) and (b), we represent a subpart of theD(x, y)and obtainedBD(x, y)
thresh-olding result respectively. Unfortunately, due to the low resolu-tions or surrounding trees around the building, thresholding result does not directly represent the building shape. However, it gives an idea about the approximate shape of the building.
50
100
150
(a)
50
100
150
(b)
700 720 740 760 780 800
(c) (d)
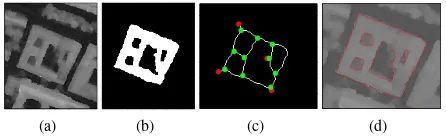
Figure 1: (a) A sub-part of the original Worldview2 satellite DSM (D(x, y)), (b) After applying local thresholding (sub-part ofBD(x, y)), (c) Skeleton of the building in the same sub-part of
BD(x, y), (d) Detected building shape.
In the next step, we use the detected approximate segments to understand building complexity and to run our 3D active shape growing method.
3 EXTRACTING BUILDING SHAPES
In a previous study, Sirmacek and Unsalan (Sirmacek and Un-salan, 2010) proposed an automatic rectangular binary active shape growing approach (called box-fitting). First they used color in-variant features to extract possible building rooftop segments. Mass centers of the rectangular segments are assumed as seed-points (as approximate building centers). Seed-point locations are used to grow a virtual active rectangular shape based on an energy criteria. In previous studies (Sirmacek et al., 2010) and (Sirmacek et al., 2012), we have used this binary active shape growing approach to detect complex building shapes from a bi-naryBD(x, y)approximate building segment mask. First, we
building segment is in a complex shape, we divided the building segment into elongated pieces using its skeleton. To do so, we de-tected junctions and endpoints of the building segment skeleton. We divided the skeleton into pieces by removing these junction pixels from the skeleton. For each obtained skeleton piece, we divided it again intolpixel length pieces if it is longer thanl pix-els. We assume center pixels of obtained skeleton pieces as our seed-point locations to run the box-fitting algorithm. Herein, sim-ilarly to our previous applications, we assumelvalue as equal to 20pixels. In our previous study (Sirmacek et al., 2012), we pro-vided effects of choosinglvalue to the shape detection result in detail.
For detecting complex building shapes, herein we follow a similar methodology. However instead of using the binary active shape growing approach in each seed-point location, we propose a novel active shape growing approach based on the usage of 3D informa-tion. To do so, after extracting(xs, ys)seed point locations as we
describe in (Sirmacek et al., 2012) in detail, we start to grow our active rectangular shapes in each seed point location by regarding the height information. We assume that(xn
v, ynv)array holds the
pixel coordinates fornth edge of the virtual rectangular shape. It-eratively, we sweep each edge to the outwards growing direction if the edge pixels satisfy(max(D(xn
v, yvn))−min(xnv, yvn)< δ)
inequality (n ∈ [1,2,3,4]). Here,δthreshold is the minimum
building height that we would like to detect in the region. In our application we assume δ as equal to 3, which means that we assume the buildings to be higher than 3 meters to be de-tected. When the growing process stops for each edge, we cal-culate the final energy value by using the equation that we rep-resent in Eqn. 1. In the equation, m(.) represents the mean value. For the same seed-point, we apply growing process for allθ∈[0, π/6, π/3, π/2,2π/3, ...,2π]angles withθdif =π/6
radian turning steps. As we discussed in detail in (Sirmacek et al., 2012), by reducingθdif step sizes, we can obtain more accurate
approximations, however in this case we need more computation time. After calculatingEθ for allθ angles, herein we pick the
estimated box which exhibits the highestEθ energy as detected
building shape. Since most buildings appear like compositions of rectangular building segments, it makes sense to extract rect-angular shapes on buildings. The main advantage of using the box-fitting approach is that approximate building shapes still can be found even if the building edges are not well-determined, or even if there are trees adjacent to the building facades. However, other region growing algorithms fail to extract an object shape in these cases, since the growing region can flow out easily when the parameters are not set precisely.
Eθ= 4×m(BD(x, y)×Di(x, y))−
4
∑
n=1
m(D(xn
v, ynv)) (1)
For complex buildings, after fitting a chain of boxes, discontinu-ity between adjacent boxes should be smoothed. For this purpose, we simply benefit from morphological operations. First, we start with filling inside of the detected binary boxes with1value in BB(x, y)binary mask. Then, we apply morphological dilation
and erosion operations respectively to the detected boxes, using a disk shaped structuring element with radius1. After this opera-tion small discontinuity between adjacent boxes can be smoothed. Final improved building shapes are kept in a newB(x, y)binary mask.
The detected shape for our sample building can be seen in Fig. 1.(d). Obtained building shape is used to insert sharp building walls into our 3D model.
3.1 Rooftop-type Classification
After detecting building groundfloor shapes, we focus on recon-struction of rooftops. For this purpose, we benefit from our pre-vious approach that we represent in (Sirmacek et al., 2012). We first start with ridge-line and tower detection. Using obtained ridge-lines we classify rooftops as flat or gable type. Obtained information is used to insert realistic models into our 3D city rep-resentations.
The ridge-line detection approach is based on derivative calcula-tion over the DSM. We use the following derivative filter. For a symmetric Gaussian functionG(x, y) =exp(−(x2+y2)), it is
possible to define basis filtersGp0andGpπ
2 as follows,
Gp0= ∂
∂xG(x, y) =−2xexp(−(x
2
+y2)) (2)
Gpπ
2 =
∂
∂yG(x, y) =−2yexp(−(x
2+y2))
(3)
We can find a derivative in an arbitraryθdirection using follow-ing filter function,
Gpθ=cos(θ)Gp0+sin(θ)Gpπ
2 (4)
We convolve our DSM with this derivative filter inθ∈[0, π/12,
...,23π/12]directions as follows,
Jθ=D(x, y)∗Gpθ (5)
Ifθangle is perpendicular to the building ridge-line orientation, then one side of the building rooftop gives positive response, and the other side of the building rooftop gives negative response to the filter. AssumingBj(x, y)
is thejth connected component inB(x, y)binary building segment matrix, we assume that two sides of the building rooftop (RPθjandRN
j
θ) can be extracted as
follows,
RPθj=B j
(x, y)×(Jθ>0) (6)
RNθj=B j
(x, y)×(Jθ<0) (7)
Since we have no pre-information about building orientations, we should do the derivative filtering in all possible orientations. Therefore, we calculate∑θRLj
θ forθ ∈[0, π/12, ...,23π/12]
directions. Building ridge-lines will be extracted inθjfiltering
angle which is almost perpendicular to the ridge-line orientation. However the ridge-line will be also detected inθj−π/12and
θj+π/12neighbor filtering directions. Therefore, the ridge-line
will have a value of higher than 2 in the∑θRLjθ result. As a result, the ridge-line ofjth building rooftop can be obtained by calculatingRj(x, y) =∑
θRL j
θ>2and eliminating connected
components which are less than 10 pixels in order to eliminate redundant information coming from small objects on rooftop.
values of the DSM (mx) for each building segment. For jth building which is held asjth connected component inB(x, y) binary building mask, the maximum height value is calculated as;mx= max(Bj(x, y)
×D(x, y)). Then, we threshold the
DSM at building region using the following equation;tj(x, y) =
(Bj(x, y)
×D(x, y))>0.8mx. Here, we obtained our
thresh-old value by extensive tests. Finally, we apply size threshthresh-olding totj(x, y)
binary mask. In order to make the size thresholding process independent from the geometric resolutions of the input DSM, we compare the obtained region intj(x, y)
with the to-tal sizes of thejth building segment. If the size of the region intj(x, y)is smaller than1/10size ofBj(x, y)segment, then
tj(x, y)
is assumed as a binary mask which holds a tower region inside. Otherwise, all pixel values intj(x, y)
matrix are changed with zero values. After applying the same methodology to all building segments inB(x, y), union of alltj(x, y)matrices give
us a binary mask which holds the tower regions. Binary tower matrix (T(x, y)) is obtained by calculatingT(x, y) =∪tj(x, y)
for alljvalues.
Next, we use detected ridge-lines for roof-type classification and 3D rooftop model reconstruction purposes. We benefit from de-tected roof ridge-lines to classify rooftops as’flat roof ’or’gable roof ’type.
If there is no ridge-line detection result on a building segment, we assume that building as flat roof. If there is a ridge-line on thejth building segment, then we calculate mean of DSM height values on ridge-line location by calculating∑(x,y)Rj(x, y)×
D(x, y)/M, whereM is the total number of ridge-line pixels in Rj(x, y)
binary matrix. We also calculate mean of DSM height values on building border by calculating∑(x,y)Bj(x, y)
×D(x,
y)/N, whereNholds the total number of building border pixels inBj(x, y)
binary matrix. If the difference between these two mean values is lower than 2 meters, then we assume the rooftop as aflat rooftop. Otherwise, it is assumed asgable rooftop. This 2 meters criteria is obtained by observinggable rooftop charac-teristics over test area.
3.2 Generating 3D City Models
In raw DSM data, both building walls and rooftops need to be improved, since generally building walls make a soft transition from rooftop to the ground and the rooftop contains noise. In addition to that, raw DSM may include spurious values coming from stereo image matching errors in the DSM generation pro-cess. Therefore, in order to obtain better 3D representation, we should sharpen building walls and towers, and we should also enhance the rooftop view.
First, we start with generating a zero matrixD2(x, y)with the
same size withD(x, y)matrix. New height values belonging to objects in the city will be stored inD2(x, y)matrix. In order
to eliminate noise in non-built regions, we apply median filter-ing to the original DSM (D(x, y)) by usfilter-ing a3×3pixel size window, and we obtain smoothed DSM (Df(x, y)). For
non-built areas, or in other saying for(x, y)coordinates which satisfy B(x, y) = 0, we applyD2(x, y) = Df(x, y). That means;
we assign smoothed ground height values for non-built regions. As building wall, we insert a single height value to each build-ing boundary which is stored inB(x, y)binary building shape matrix. For each building, the building height value is assigned by calculating the mean ofD(x, y)values on building boundary pixels. After smoothing the noise on the ground and inserting sharp building walls, finally rooftop height values are assigned to D2(x, y)matrix. Rooftop height assignment is done by
consider-ing the roof-type. If the roof is classified as a flat roof, then only
one single height value is assigned to all building areas which is equal to building wall heights. If the rooftop is classified as a gable-roof, we follow different approaches depending on the building complexity. If the building is not detected as a complex building as structure type (if the Euler number is equal to1), then we can find polygons which define the rooftop in 3D space. To this end, we detect corners of the building segment using Har-ris corner detection algorithm (HarHar-ris and Stephens, 1988) over panchromatic image of the test region. Besides, we also detect endpoints of the building ridge-line. We pick each building cor-ner one by one. Then, we find the closest ridge-line endpoint. A line between building corner and the closest ridge-line end-point can divide the rooftop into polygons. A detailed demon-stration of this approach is illustrated in (Sirmacek et al., 2012). Height values of rooftop polygons are assigned to corresponding pixels inD2(x, y)matrix. If the building is detected as a
com-plex structure or if the building ridge-line could not be extracted properly, unfortunately we cannot use the same idea for building rooftop reconstruction and more advanced rooftop reconstruction approaches are needed. Herein we leave the building rooftop re-construction at this level. For complex building rooftops and for rooftops for which we cannot extract the ridge-line properly, we only insert corresponding pixel values fromDf(x, y)matrix.
Fi-nally, for tower regions which are stored inT(x, y)binary matrix we insert the original DSM values (not filtered DSM values) to D2(x, y)matrix fromD(x, y).
4 EXPERIMENTS
4.1 Data Sets
The investigated data set consists of six DSMs which are ob-tained from different sensors covering each parts of the city of Munich, Germany. Three of them are obtained from the satel-lite sensors Cartosat-1, Ikonos, WorldView-2 and will show the potential of stereo satellite data to derive and enhance building models depending on their spatial resolution. All satellite data are along-track stereo data, since taking data from different dates is not appropriate due to radiometric changes and different shadow properties, which reduce the image matching density and quality significantly. The Cartosat-1 sensor on-board the Indian satel-lite IRS-P5 collects panchromatic data with two pushbroom cam-eras having a ground sampling distance (GSD) of approximately 2.5mand a stereo angle of31◦. They are delivered with RPC
values in a level called Ortho Ready, which is equivalent to Level 1A. RPCs have to be refined by ground control using an affine correction. The data set used has been acquired in May 2008. The whole area covered is about30km×30km, equivalent to one scene.
The Ikonos data used in this paper exhibit a GSD of1mand a stereo angle of approximately10◦, which is quite suitable for
DSM generation in city areas (Reinartz et al., 2010). The data cover an area of approximately10km×10km and have been
acquired in July 2005; the processing level is ”radiometric cor-rected”, so also equivalent to Level 1A.
The WorldView-2 data used have a GSD of0.5mand are com-prised of 2 stereo pairs acquired on the same day and orbit with an overlap in the test area, leading to 4 different viewing directions with stereo angles between12◦and24◦. These data have been
acquired in July 2010 with the processing level ”Level 2 Ortho Ready”, which is equivalent to a projection on a plain for each single image. The overlapping for all 4 images is about2km×
Reinartz, 2011), have the same sampling distance as the image data and cover all parts of the city center of Munich.
Two of the DSMs are obtained from airborne cameras, namely the High Resolution Stereo Camera (HRSC) and the 3K-camera system, both operated by DLR. The HRSC-AX (High Resolu-tion Stereo Camera Airborne Extended) is a pushbroom camera and is especially designed to acquire stereo aerial photographs from 5 viewing directions. The image data exhibit a GSD of1m while the DSM, generated as described in (Hirschmueller et al., Springer, DAGM 2005, Wien, Austria).
The DLR 3K-camera system consists of three off the shelf digital frame cameras (Canon EOS 1Ds Mark, 16 MPixel) mounted on a platform, of which one is pointed nadir, the second pointed to the left and the third is pointed to the right according to the flight direction (Kurz et al., 2008). The data used are acquired from a flight altitude of approximately1500m, leading to a GSD of 25cmThe DSM has a GSD of50cmand is derived using images with80%overlap leading to 4 viewing directions per object. The airborne stereo data also cover parts of the Munich city center. Therefore for further investigations an area is used where DSM data from all sensors are available.
The sixth DSM, which is mainly used as a reference was ac-quired by an Airborne Laser Scanning (ALS) system and pro-vided through the Bavarian Surveying Authorities, the 3D point cloud with a density of 2 points per square meter has been inter-polated to a regular sampling distance grid of1mspacing. 4.2 Evaluation of Performances
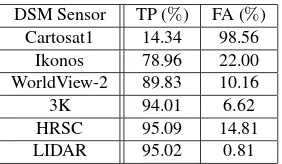
In this section, we discuss the automatic 3D modelling perfor-mance of the proposed system on six different DSMs of a test building. In order to be able to calculate quantitative values for shape detection performance analysis, we use a binary building shape mask which includes groundfloor shapes of the buildings. This mask has been prepared by Munich municipality by using cadastral data. We apply pixel based performance analysis by counting the number of correctly detected building groundfloor pixels (True Positives - TP), and the number of false detected building groundfloor pixels (False Alarm - FA). By dividing the obtained numbers to the total number of building groundfloor pix-els appearing in the groundtruth mask, in Table 1 we presentTP
andFAnumbers as percentages. As can be seen in this table, the highest detection performance is obtained for the 3K, HRSC and LIDAR sensor DSMs, as expected since these are all derived from airborne data. But it has to be noted that also the WV2 DSM pro-vides quite good results, with a quite low FA rate. On the other hand, the lowest detection performance is obtained on Cartosat1 sensor DSM since the low resolution of this sensor does not al-low seeing neighbored building segments separately. The highest false alarm rate is obtained again on the Cartosat1 sensor DSM for the same reason. The lowest false alarm rate is obtained with LIDAR sensor DSM because of its high spatial resolution and since this DSM does not include trees which generally appear connected to the building facades.
In order to provide an insight on height estimation performances, we visualize a demonstration in Fig. 2. In Fig. 2.(a), we repre-sent a profile of the sample building where we take height values. In 2.(b), the red dashed profile represents original WV2 DSM values, black dashed profile represents the LIDAR DSM values, while the blue continuous line represents automatically obtained reconstruction values by using WV2 DSM.
Finally, we compare the automatic reconstruction method that we propose herein with our previous reconstruction method which
is based on active shape growing using building edge informa-tion (Sirmacek et al., 2012). On the same building sample of WV2 DSM, our previous approach gives performance values as
TP =%65.02andFA =%34.97. Unfortunately, the previous ap-proach cannot obtain successful detection results when the build-ing edges cannot be detected correctly because of the noisy DSM or because of the objects on the building rooftops.
DSM Sensor TP (%) FA (%) Cartosat1 14.34 98.56
Ikonos 78.96 22.00 WorldView-2 89.83 10.16
3K 94.01 6.62
HRSC 95.09 14.81
LIDAR 95.02 0.81
Table 1: Pixel Based Building Groundfloor Detection Perfor-mances for Six Different DSMs
(a) (b)
Figure 2: (a) The slice of the sample building where the hight values are taken. (b) Red dashed profile represents original WV2 DSM values, black dashed profile represents the LIDAR DSM values, blue continues line represents automatically obtained re-construction values by using WV2 DSM.
5 CONCLUSIONS
Developing remote sensing technology and methods offer new and low-cost approaches such as DSM generation based on stereo satellite image matching principle. Herein, we introduced a novel method for automatic 3D detailed city modeling based on build-ing shape, tower, and rooftop ridge-line extraction. Usbuild-ing the pro-posed approach we could generate 3D city models with high de-tails even by using satellite images. Especially for regions which cannot be covered by airborne measurements, or for fast map up-dating or damage assessment purposes these data are well suited. Besides proposing a novel and robust approach for 3D city mod-eling, we provided a detailed assessment of the algorithm perfor-mance for different sensor data. For this purpose, we used DSMs which are obtained from different satellite (Cartosat-1, Ikonos, WorldView-2) and airborne sensors (3K camera, HRSC, and LI-DAR). Beyond the development of the fine detailed 3D city mod-els, we believe that the provided performance analysis over differ-ent sensor DSMs presdiffer-ents an important information about the ca-pabilities of the different sensors and their remotely sensed stereo data.
REFERENCES
Arefi, H., Engels, J., Hahn, M. and Mayer, H., 2008. Levels of de-tail in 3d building reconstruction from lidar data. In Proceedings of International Archives of Photogrammetry, Remote Sensing, and Spatial Information Sciences 37, pp. 485–490.
Brenner, C., Haala, N. and Fritsch, D., 2001. Towards fully auto-mated 3d city model generation. Workshop on Automatic Extrac-tion of Man-Made Objects from Aerial and Space Images (III).
Brunn, A. and Weidner, U., 1997. Extracting buildings from dig-ital surface models. In Proceedings of International Archives of Photogrammetry, Remote Sensing, and Spatial Information Sci-ences.
Canu, D., Gambotto, J. and Sirat, J., 1996. Reconstruction of building from multiple high resoltion images. In Proceedings of International Conference on Image Processing.
Cui, S., Yan, Q. and Liu, Z., 2008. Right-angle building extrac-tion based on graph-search algorithm. Internaextrac-tional Workshop on Earth Observation and Remote Sensing Applications, EORSA 2008 1, pp. 1–7.
d’Angelo, P. and Reinartz, P., 2011. Semi-global matching re-sults on the isprs stereo matching benchmark. ISPRS Hannover Workshop, International Archives of the Photogrammetry, Re-mote Sensing and Spatial Information Sciences.
Davis, L., 1982. Hierarchical generalized hough transforms and line-segment based generalized hough transforms. Pattern Recogntion 15 (4), pp. 277–285.
Fradkin, M., Roux, M., Maitre, H. and Leloglu, U., 1999. Surface reconstruction from multiple aerial images in dense urban areas. In Proceedings of IEEE Computer Vision and Pattern Recogni-tion 2, pp. 262–26.
Haala, N. and Brenner, C., 1999. Extraction of buildings and trees in urban environments. ISPRS Journal of Photogrammetry and Remote Sensing 54, pp. 130–137.
Haala, N., Brenner, C. and Anders, K., 1998. 3d urban gis from laser altimeter and 2d map data. In Proceedings of International Archives of Photogrammetry, Remote Sensing, and Spatial Infor-mation Sciences 32, pp. 339–346.
Harris, C. and Stephens, M., 1988. A combined corner and edge detector. Proceedings of 4th Alvey Vis. Conf. pp. 147–151.
Hirschmueller, H., Scholten, F. and Hirzinger, G., Springer, DAGM 2005, Wien, Austria. Stereo vision based reconstruction of huge urban areas from an airborne pushbroom camera (hrsc). Pattern Recognition, 27th DAGM Symposium pp. 58–66.
Horn, B., 1986. Robot vision. New York, McGraw-Hill pp. 73– 77.
Irvin, R. and McKeown, D., 1989. Methods for exploiting the relationship between buildings and their shadows in aerial im-agery. IEEE Transactions on ystems, Man and Cybernetics 19 (6), pp. 1564–1575.
Jacobsen, M., 2005. Point-process theory and applications: Marked point and piecewise deterministic processes (Probability and its applications). First edition edn, Birkhaeuser Boston.
Kada, M. and McKindley, L., 2009. 3d building reconstruction from lidar based on a cell decomposition approach. Proceedings of ISPRS Workshop on Object Extraction for 3D City Models, Road Databases and Traffic Monitoring Concepts, Algorithms and Evaluation, CMRT’09, Paris, France.
Karantzalos, K. and Paragios, N., 2009. Recognition-driven two-dimensional competing priors toward automatic and accu-rate building detection. IEEE Transactions on Geoscience and Remote Sensing 47 (1), pp. 133–144.
Krishnamachari, S. and Chellappa, R., 1996. Delineating build-ings by grouping lines with mrfs. IEEE Transactions on Image Processing 5 (1), pp. 164–168.
Kurz, F., Ebner, V., Rosenbaum, D., Thomas, U. and Reinartz, P., 2008. Near real time processing of dsm from airborne digital camera system for disaster monitoring. Congress of the ISPRS, Beijing, China, International Archives of the Photogrammetry, Remote Sensing and Spatial Information Sciences.
Maas, H., 1999. Fast determination of parametric house mod-els from dense airborne laserscanner data. ISPRS Workshop on Mobile Mapping Technology, Bangkok, Thailand.
Ortner, M., Descombes, X. and Zerubia, J., 2002. Building ex-traction from digital elevation models. INRIA Research Report.
Reinartz, P., d’Angelo, P., Krauss, T., Poli, D., Jacobsen, K. and B¨uy¨uksalih, G., 2010. Benchmarking and quality analysis of dem generated from high and very high resolution optical stereo satel-lite data. Convergence in Geomatics, CGC, ISPRS. ISPRS Sym-posium Commission I, June 2010, Calgary, Kanada, International Archives of the Photogrammetry, Remote Sensing and Spatial In-formation Sciences.
Rottensteiner, F., Trinder, J., Clode, S. and Kubik, K., 2007. Building detection by fusion of airborne laser scanner data and multi-spectral images: performance evaluation and sensitivity analysis. ISPRS Journal of Photogrammetry and Remote Sensing 62 (2), pp. 135–149.
Saeedi, P. and Zwick, H., 2008. Automatic building detection in aerial and satellite images. International Conference on Control, Automation, Robotics and Vision, ICARCV 2008, Hanoi, Viet-nam 1, pp. 623–629.
Sirmacek, B. and Unsalan, C., 2010. A probabilistic framework to detect buildings in aerial and satellite images. IEEE Transac-tions on Geoscience and Remote Sensing pp. –.
Sirmacek, B., d’Angelo, P., Krauss, T. and Reinartz, P., 2010. Enhancing urban digital elevation models using automated com-puter vision techniques. ISPRS Commission VII Symposium, Vienna, Austria.
Sirmacek, B., Taubenb¨ock, H., Reinartz, P. and Ehlers, M., 2012. Performance evaluation for 3-d city model generation of six dif-ferent dsms from air- and spaceborne sensors. IEEE Journal of Selected Topics in Applied Earth Observations and Remote Sens-ing 1 (99), pp. 1939–1404.
Sonka, M., Hlavac, V. and Boyle, R., 1999. Image processing, analysis and machine vision. PWS Publications, Pacific Grove, CA, second edn.
Tournaire, O., Bredif, M., Boldo, D. and Durupt, M., 2010. An ef-ficient stochastic approach for building footprint extraction from digital elevation models. ISPRS Journal of Photogrammetry and Remote Sensing 65 (4), pp. 317–327.
Valero, S., Chanussot, J. and Gueguen, P., 2008. Classification of basic roof types based on vhr optical data and digital eleva-tion model. IEEE Internaeleva-tional Geoscience and Remote Sensing Symposium IGARSS’08, Boston, USA.