SEMANTIC LABELLING OF URBAN POINT CLOUD DATA
A.M.Ramiyaa∗, Rama Rao Nidamanuria
, R Krishnan
aDept. of Earth and Space Science, Indian Institute of Space Science and Technology, Thiruvananthapuram,Kerala India 695547 [email protected]
Commission VI, WG VI/4
KEY WORDS:Building Reconstruction, urban modelling, LiDAR,segmentation
ABSTRACT:
Three dimensional urban reconstruction is gaining popularity with the paradigm shift from 2D maps to 3D maps. LiDAR remote sensing is emerging as the main source of 3D spatial data because of its very dense and discrete point cloud. The enormous amount of data collected over natural terrain calls for automatic methods for labelling the point cloud. Semantically labelling the urban point cloud into various features is essential for urban planning and development. In this study,we propose a new object oriented methodology for semantic labelling of urban point cloud data. In addition to the geometrical information from LiDAR, we have used the spectral information for labelling of the point cloud. The coloured point cloud was segmented using colour based region growing algorithm to produce 3D segments. Spectral and geometrical features were extracted from the segments created. The extracted features were classified using different classifier system into five urban classes. The proposed methodology has been tested on LiDAR captured over urban datasets .The results indicate the potential of object based classification for automated 3D point cloud labelling.
1. INTRODUCTION
Semantically identifying and labelling the minutest details of the real world (eg: Road, lawn, residential buildings, commercial buildings etc) resulting in a realistic 3D models has numerous applications - city planning, disaster response preparation,virtual tourism,cultural heritage documentation etc (Golovinskiy et al., 2009). However creating such models automatically remains a challenge.
Geospatial technology is considered to be the main source of data for producing such models ranging from ground survey to stereo images. Last decade has witnessed the power of Light Detection and Ranging (LiDAR) technique for accurately capturing the 3D of the various earth surface features. The ability of LiDAR in directly capturing the altitude information of ground and above ground objects through range measurements (point cloud) makes it readily usable for three dimensional city modelling. The dense point cloud obtained from LiDAR is useful not only for the gen-eration of high resolution DTM (Digital Terrain Model) but also for many applications ranging from 3D urban reconstruction, bio-physical parameter estimation,virtual reality models etc. Despite the ready availability of geometrical information from the LiDAR point cloud, many applications require the point cloud to be se-mantically classified into the various earth surface objects. This method known as point cloud classification is one of the impor-tant research topics in LiDAR data processing. The nature of data makes the automatic labelling of point cloud a challenge.
In the domain of point cloud labelling of urban scene, the earlier works were on separating the ground and non ground points. This technique, popularly known as filtering, has been well developed. Some of the popular filtering techniques include progressive den-sification based filtering (Axelsson, 2000) morphological based filtering (Vosselman, 2000) surface based filtering (Pfeifer, 2005) and segmentation based filtering (Filin and Pfeifer, 2006).A re-view of the ground filtering algorithms by (Meng et al., 2010) summarize that the current ground filtering algorithms use one
∗Corresponding author. This is useful to know for communication
with the appropriate person in cases with more than one author
of the following characteristics to separate ground points from non ground points: lowest feature in specific area, ground slope threshold, ground surface elevation difference threshold and smooth-ness. The review paper concludes that the filtering algorithms work well for flat terrain dataset but has certain limitations over undulating terrain.
Many studies have focussed on extracting one of the urban fea-tures from LiDAR dataset. Building prevail to be the objects of most interest amongst the researchers (Lari et al., 2011),(Rab-bani et al., 2006),(Ghosh and Lohani, 2011),(Topographic Laser Ranging and Scanning:Priniciples and Processing, 2009). Clus-tering based segmentation was used by Shan and Sampath (Topo-graphic Laser Ranging and Scanning:Priniciples and Processing, 2009) to extract building from point cloud data. (Sun and Sal-vaggio, 2013) has used graph cut methods for building extraction from point cloud.
Most of the existing studies used only the geometrical informa-tion from the LiDAR point cloud to identify various urban fea-tures in the scene. The spectral information from optical images could complement the geometrical information from LiDAR for better object discrimination. However, due to the different na-ture of the datasets, one being in three dimension and the other in the two dimension, it is not straightforward to use the datasets together for object recognition. Early researchers have converted the LiDAR to 2D Digital Surface Models (DSM) or Digital Ter-rain Models (DTM) and fused with the optical images (Rotten-steiner et al., 2004),(Sohn and Dowman, 2007). However, this leads to loss of the rich geometrical information inherent to Li-DAR data (Wang and Shan, 2009). Very few studies have at-tempted using the coloured point cloud for urban scene analysis (Niemeyer et al., 2014).
labelling of LiDAR data using object based methods. Spectral in-formation is not used in most of the cases. We propose a method-ology for object oriented semantic labelling of point cloud de-rived from LiDAR data complemented with the spectral infor-mation obtained from optical data. The spectral inforinfor-mation ob-tained from aerial images (R, G, B) was first integrated with geo-metric information from LiDAR to produce a colored point cloud (X, Y, Z, R, G, B). An improved color based 3D region growing segmentation algorithm was applied on the colored point cloud data. Various geometric and spectral features extracted from the 3D segments are then classified semantically using various clas-sification algorithms. All the points inside a 3D segment were labelled with the same class as that of the segment.
We applied the proposed methodology on two airborne LiDAR datasets and the corresponding aerial images.
2. METHODOLOGY
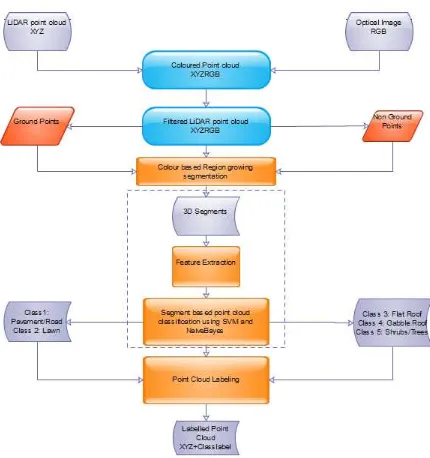
Point cloud labelling can be either point based classification or object based classification approach. In point based classifica-tion points are classified mainly using the few features inherent to the point cloud such as distance from the ground, planarity. In most of the commercial softwares available such as Terrasolid, point labelling is based on point based classification. On the other hand, object based point cloud analysis is gaining momentum as it produces more realistic results. Similar to the GeOBIA (Ge-ographic Object Based Image Analysis) concepts of 2D images, object based analysis for LiDAR point cloud has two stages. Seg-mentation is the first stage in which the point cloud is grouped to form objects (also called as segments), mainly based on geomet-ric characteristics. Features are then extracted from the segments, for classification. The label assigned to each segment is then given to all the points belonging to the segment. This involves assigning a labelcito each of the 3D pointsi. Fig 2. shows the methodology adopted in this research. The point clouds were as-signed to one of the five classes 1. Pavement/Road 2.Lawn 3.Flat Roof Building 4. Gabbled Roof Building 5. Shrubs/Trees.The steps are explained in detail in the following sections.
2.1 Filtering
To reduce the complexity of classification, the LiDAR points were separated into ground and non ground points before further pro-cessing. This step is essential as the first two classes ie.,Pavement / Road and Lawn belong to the ground class whereas as the three classes belong to the non ground class. We have used have pro-gressive TIN densification algorithm(Axelsson, 2000). In this al-gorithm, an initial TIN surface is generated from a set of seed points chosen initially based on the statistical information derived from the LiDAR data. The initial TIN surface is densified itera-tively using the threshold that is obtained iteraitera-tively based on the threshold to the two parameters - angle to the nodes and the dis-tance from the nodes.
2.2 Segmentation
Segmentation groups LiDAR points which are similar in some respect. This approach combines the inherent geometric prop-erties of the LiDAR data with the spectral information from the optical image to produce disjoint 3D segments which are used for further processing. Since the LiDAR is captured in an unorgan-ised random fashion, we have used KD tree algorithm to establish the neighbourhood of the point cloud. Color based region grow-ing segmentation was then carried out on the organised dataset. There are three main steps in this algorithm : region growing, re-gion merging and rere-gion refinement. Seed points were selected
Figure 1: The general framework of object based point cloud la-belling
by fitting a normal to the set of KNN neighbours and calculat-ing the residual of the point which indicate the curvature of the points. Points which have high curvature value has high resid-ual and the points with minimum curvature values were chosen as seed points.(Rabbani et al., 2006). Seed points were selected which were grown using colorimetric distance as given in equa-tion 1
CD(C1, C2) =p(R1−R2)2+ (B1−B2)2+ (G1−G2)2
(1) where R,G,B denote the spectral values obtained from the optical image. The roughly segmented regions obtained from the region growing process were checked for colorimetric similarity and are merged in the region merging stage. In the region refinement process the regions with less than acceptable number of points were merged with the neighbouring region.
2.3 Feature Extraction
The 3D segments created were used to extract features for fur-ther classification. Various spectral and geometrical features are computed in addition to the range of Z value in each segments.
2.4 Classification
Three different classifiers: Naive Bayes, K Nearest Neighbour-hood, Support Vector Machines were used for classification. Naive Bayes is a probabilistic classifier which uses the prior and the likelihood to find the probability of an instance to be classified to a particular class. K Nearest Neighbourhood uses the dis-tance/similarity function to relate the unknown class with the known class.
The performance of the classifiers was evaluated by generating confusion matrix and kappa coefficients. Ground truth map was generated based on complete enumeration. To assess whether the classification was due to chance, the popular statistical measure Cohen’s Kappa coefficient was used. Kappa value was calculated using the equation 2
κ=p0−pe
1−pe
(2)
wherep0is the sum of the relative frequency in the diagonal of confusion matrix (proportion of true agreement) andpeindicates proportion due to chance agreement. The kappa value ranges be-tween 0 and 1. Value ofkbetween 0.6 and 0.8 indicate substan-tial agreement between the classification and ground truth data and the value of kappa above 0.8 and 1 indicate almost perfect agreement.
2.5 Point cloud labelling
The labels obtained from the classification for the segments as-signed to all the corresponding points within the segment. The points were given one of the following labels 1. Pavement/Road 2. Lawn 3. Flat roof 4. Gabbled Roof 5. Shrubs/Trees.
3. DATASET USED
Figure 2: Test sites of Vaghingen, Germany : a) Area1 : Inner City b) Area2 : High Riser
The dataset used for the study was provided to us as part of IS-PRS Test Project on Urban classification and 3D building recon-struction. The dataset was captured over Vaihingen, Germany on August 2008 using Leica ALS50. The flying altitude was 500 m above ground. The point density of the LiDAR dataset is around 5 points per sq m. The corresponding optical image was captured using an Integraph/ZI DMC. The spatial resolution of the image is 8 cm and has a radiometric resolution of 11 bits. Two subsets of around 170 sq m were used for the study as shown in Figure
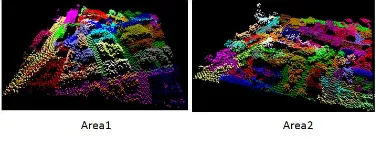
2.Area1 consists of dense complex buildings with some trees and is situated in the center of the city. Area 2 consists of few high rising residential buildings surrounded by trees. Figure 3. shows the LiDAR data points captured over Area 1 and Area 2 displayed based on the elevation.
4. RESULTS AND DISCUSSION
The methodology described in the previous section was applied to the two study sites and the results obtained is discussed in this section.
Figure 3: LiDAR point cloud data of the test sites Area1 and Area 2 displayed based on elevation
Area 1 contained a total of 10242 points. After applying filter-ing algorithm there are 3806 ground points and 6436 non ground point. Area 2 had 15282 points of which there are 5887 ground and 9395 non ground points. The results of filtering is shown in figure 4.
Figure 4: Filtered point cloud
The ground and the non ground points were segmented using color based region growing algorithm. For Area 1, there are 32 segments, of which 11 belonged to ground points and the rest to the non ground points. Area 2 consist of 56 clusters out of which 19 belong to ground points and the rest to the non ground points. The results of color based region growing segmentation algorithm is as seen in Fig5. Each cluster is assigned a color for easy visualisation. The results of segmentation indicate that most of the urban features are classified distinctively indicating that spectral information along with geometrical information can be a key factor to distinguish the various urban features present.
Figure 5: Segmented point cloud
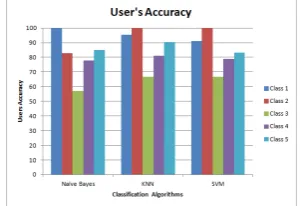
The ground and the non ground data point were classified us-ing the different algorithms discussed in the methodology sec-tion. The results are presented in Table 1 and Figure8. It can be seen that the accuracy of classification is comparable among all the three classifiers. However, amongst the three classifiers, KNN performs relatively well for both the ground and non ground classes with an overall accuracy of around 96.67 % for ground classes and 84.48 % for non ground classes. Kappa coefficient also exhibits substantial to almost perfect agreement with the ground data. The overall accuracy for all the three classifiers is above 90% for the ground features whereas it is around 80% for non ground features. This is reflected also in the producers and users accuracy for the individual classes as shown in Figure6and
Classes/Classifiers Naive Bayes KNN SVM Ground Point Overall Accuracy 93.33 96.67 93.33 Kappa Coefficient 0.857 0.923 0.842 Non Ground Point Overall Accuracy 79.31 84.483 81.035
Kappa Ceofficient 0.725 0.771 0.7056
Table 1: Performance Evaluation of different classifiers
used in this study. Use of more geometrical features such as shape and planarity int he classification may improve the classification accuracy.
Figure 6: Producers accuracy for different urban features
Figure 7: Users accuracy for different urban features
The point cloud data were assigned class labels based on the la-bels generated as a result of classification.The points were as-signed to either one of the 5 urban land cover class (1. Pave-ment/Road 2. Lawn 3. Flat roof 4.Gabbled Roof 5. Shrubs/Trees).
Figure 8: Labelled point cloud data representing various urban features
5. CONCLUSION
A novel object based semantic point cloud labelling method util-ising the geometrical information from LiDAR point cloud data and spectral information from optical images has been developed for urban land cover classification. The proposed method is able to label the points with an accuracy of 94% for ground classes and 82% for non ground classes. Color based 3D segmentation followed by KNN classification gives the best accuracy for point
cloud labelling. Results indicate that better geometrical descrip-tors in the classification stage can improve the accuracy of point cloud labelling.
6. ACKNOWLEDGMENTS
The Vaihingen data set was provided by the German Society for Photogrammetry, Remote Sensing and Geoinformation (DGPF) (Cramer, 2010):http://www.ifp.uni-stuttgart.de /dgpf/DKEP-Allg.html.
REFERENCES
Axelsson, P., 2000. DEM Generation from Laser Scanner Data using Adaptive TIN models. International Archives of Pho-togrammetry and Remote Sensing XXXIII, pp. 110–117.
Filin, S. and Pfeifer, N., 2006. Segmentation of airborne laser scanning data using slope adaptive neighbourhood. ISPRS Jour-nal of Photogrammetry and Remote Sensing.
Ghosh, S. and Lohani, B., 2011. Heuristical feature extraction from lidar data and their visualization. In: Proceedings of the ISPRS Workshop on Laser Scanning.
Golovinskiy, A., Kim, V. G. and Funkhouser, T., 2009. Shape-based recognition of 3D point clouds in urban environments. 2009 IEEE 12th International Conference on Computer Vision pp. 2154–2161.
Lari, Z., Habib, A. and Kwak, E., 2011. An adaptive approach for segmentation of 3d laser point cloud. In: International Archives of the Photogrammetry, Remote Sensing and Spatial Information Sciences.
Meng, X., Currit, N. and Zhao, K., 2010. Ground filtering algo-rithms for airborne lidar data: A review of critical issues. Remote Sensing.
Niemeyer, J., Rottensteiner, F. and Soergel, U., 2014. ISPRS Journal of Photogrammetry and Remote Sensing Contextual clas-sification of lidar data and building object detection in urban ar-eas. ISPRS Journal of Photogrammetry and Remote Sensing 87, pp. 152–165.
Pfeifer, N., 2005. A subdivision algorithm for smooth 3d terrain models. ISPRS Journal of Photogrammetry and Remote Sensing.
Rabbani, T., Heuvel, V. and Vosselmann, G., 2006. egmenta-tion of point clouds using smoothness constraints. nternaegmenta-tional Archives of Photogrammetry, Remote Sensing and Spatial Infor-mation Sciences.
Sohn, G. and Dowman, I., 2007. Data fusion of high-resolution satellite imagery and LiDAR data for automatic building extrac-tion. ISPRS Journal of Photogrammetry and Remote Sensing 62(1), pp. 43–63.
Sun, S. and Salvaggio, C., 2013. Aerial 3d building detection and modeling from airborne lidar point clouds. IEEE Journal of Se-lected Topics in applied Earth Observation and Remote sensing.
Topographic Laser Ranging and Scanning:Priniciples and Pro-cessing, 2009. CRC Press,Taylor and Francis Group, chapter Building Extraction from LiDAR Point Clouds Based on Clus-tering Techniques.
Vapnik, V., 1995. The Nature of Statistical Learning Theory. Springer.
Vosselman, P., 2000. Slope based filtering of laser altimetric data. In: International Archives of the Photogrammetry, Remote Sens-ing and Spatial Information Sciences, XXXIII.