SEMI-AUTOMATIC ROAD/PAVEMENT MODELING USING MOBILE LASER
SCANNING
Alexandre Hervieu∗
, Bahman Soheilian∗
∗
IGN/SR, MATIS, 73 avenue de Paris, 94160 Saint-Mande, France, ([email protected])
KEY WORDS:Curb detection, street modeling, road surface.
ABSTRACT:
Scene analysis, in urban environments, deals with street modeling and understanding. A street mainly consists of roadways, pavements (i.e., walking areas), facades, still and moving obstacles. In this paper, we investigate the surface modeling of roadways and pavements using LIDAR data acquired by a mobile laser scanning (MLS) system. First, road border detection is considered. A system recognizing curbs and curb ramps while reconstructing the missing information in case of occlusion is presented. A user interface scheme is also described, providing an effective tool for semi-automatic processing of large amount of data. Then, based upon road edge information, a process that reconstructs surfaces of roads and pavements has been developed, providing a centimetric precision while reconstructing missing information. This system hence provides an important knowledge of the street, that may open perspectives in various domains such as path planning or road maintenance.
1 INTRODUCTION
Understanding a street scene is a major issue in the field of auto-matic information processing. Indeed, a street scene may be com-posed of a variety of elements, making its processing challenging. Still components (buildings, trees, road, pavements, posts. . . ) as well as mobile entities (vehicles, people, thrash bin. . . ) may be encountered, and each street scene is a unique combination of common/unexpected elements. This challenging field is of huge interest and could bring important advances in various fields such as autonomous vehicles, video surveillance, traffic simulation or public domain maintenance.
Street ground modeling consists of several tasks. The detection of curb is here a crucial step, defining the frontiers between road and pavements (i.e., walking areas). Once curbs are located, the issue is to model the surface of roads and walking areas.
3D curb detection has first been investigated in the context of computer vision, where 3D information is computed using stereo-scopic images (Floros and Leibe, 2012) (Siegemund et al., 2011) (Oniga and Nedevschi, 2010). Despite the real interest of some of the proposed methods, 3D information extracted from stereo-scopic images remains highly uncertain whereas LIDAR produces a direct and precise 3D information. Besides, vision systems suf-fer from unfavorable light or weather conditions, i.e, overcast sky, sun glare, shadows. . .
The reliability of the 3D information produced by LIDAR sen-sors is adapted to street modeling. Several approaches have been developed for curb detection with LIDAR data.
Stückler et al. (Stückler et al., 2008) proposed a LIDAR-based detection of curbs dedicated to in-lane localization. They used GPS waypoints and road models to get a knowledge of lane width in order to produce a model of expected curbs. The system then attempts to reduce the offset between the model and the observed curbs. LIDAR information is first transformed into height images where curbs detection is done by edge filters. Then, an Iterative Closest Point (ICP) algorithm is used to minimize the sum of the
observed offsets. Wijesoma et al. (Wijesoma et al., 2004) also proposed a road edge detection method requiring approximate road width at the successive positions (given by a GPS). Road area detection was here processed by a Kalman filtering method that tracks the two road sides. However, those methods require a additional knowledge on the road, i.e., about the road width at some precise positions.
LIDAR-only road side detection method were also proposed in (Maye et al., 2012)(Zhang, 2010)(Zhou and Vosselman, 2012). Maye et al. (Maye et al., 2012) described a method where a piece-wise planar model is used to process the ground. Here, a Digital Elevation Map processed on the LIDAR measurements is divided in cells. Each of these cells was then handled using a Conditional Random Fields algorithm. An Expectation-Maximization algo-rithm for planar mixture model enabled to get the corresponding piecewise planar model. Curbs were then defined by the lim-its between plane segments. These last road boundary detection method (see also (Hernàndez and Marcotegui, 2009) (McElhin-ney et al., 2010) (Han et al., 2012) does not reconstruct the miss-ing information (mainly in case of occlusions).
A recent work by Yang et al. (B. Yang, 2013) describes a method that handle occlusions. Road sides are first detected using a mov-ing window process through successive road cross section. These results are later refined using a local similarity rule.
Our aim is to propose a method for detecting curbs and curb ramps that does not require any additional knowledge than LI-DAR point clouds and that reconstructs curbs when information is not available. Moreover, we wish to process the surface of roads as well as walking areas using a simple and exportable model and that efficiently reconstructs the ground when not avail-able in the LIDAR data. Our wish is also to get a method that allow efficient processing of large amount of data, so that an op-erator might be requested in tricky steps.
2.1 Road side detection
This subsection is dedicated to the curb and curb ramps detection. First the considered feature map is presented, then the detection process is described. Lastly, a semi-automatic scheme helping to handle problematic situations is proposed to handle efficiently large amount of data. The core of this first part of the method was previously described in (Hervieu and Soheilian, 2013), where fur-ther descriptions of the process may be available. Road side de-tection results are later used in this paper to model and reconstruct roads and pavements (Section 2.2).
2.1.1 Angular distance to ground normal map
LIDAR data have been processed to compute the angular distance to ground normalθ. Ifzis the normalized normal to the ground (i.e., the unitary orientation vector of height coordinates) andVp the normal vector at a given pointp,θ= arccos(Vp·z). The direction of the normal vectorVpis so thatVp·z >0, i.e., the normal vector is always oriented within the same half-space thanzand henceθ∈[0,Π
2]
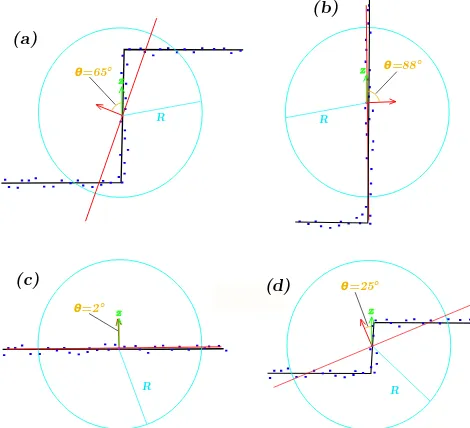
This feature describes the curb 3D pattern that we wish to retrieve (see Fig. 1). It enabled us to distinguish curb pattern such as the ground, facades or stairs of higher heights.
R
(a)
z
R
(b)
z
R
(c)
z θ
R
(d)
z θ
=2°
=25°
θ=65° θ=88°
Figure 1: Four different profile patterns depicted here in 2D for better understanding. (a), (b), (c) and (d) schemes respectively represent a stair, a facade, the ground and a road side (usually lower than a stair). The red arrows correspond to computed nor-mals whereas the green one is the z vector. Blue points are LIDAR points, the red line denotes the estimated plane (using RANSAC) based on the LIDAR points within the blue circle. The yellow arrow is theθfeature, i.e., the angle deviation with the z vector.
As shown in Fig. 1, a radius value parameterR(Rwas set to 0.2 meters) is required.Rdefines an area around the pointp(the
Figure 2: Theθfeature map.
blue area in Fig. 1) where all points are taken into account to fit a plane (least-square fitting). The normalVpatpis computed, and θis the difference of angle withzthe normal to the ground. Depending on the distance to the LIDAR sensor and on the speed of the MLS velocity, the density of points may vary importantly within the point cloud. A post-processing scheme that handle changes of point densities is set up. Fig. 2 illustrates the feature map processed on a road curve.
2.1.2 Prediction/Estimation model
To process the feature map, a prediction/estimation model was designed. The goal is first to detect road edges in the(x, y)plane (2D top view). The processing requires an initialization. This is an ordered sequence of points (or a line in the top view(x, y)2D map, selected manually) that indicates the direction of the curb processing.
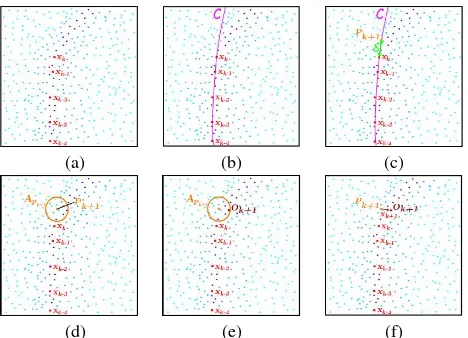
In the rest of the section, we denote byXkthe result of the pro-cessing at timek.Xkis the state vector such thatXk= (xk, yk). The studied model is divided in three steps which are described separately: the prediction step, the observation selection step and the result step. It was inspired by Kalman models. However, as the prediction step relies on several previous results, some properties of classical Kalman filters do not hold (for covari-ance and Kalman gain especially). Fig. 3 illustrates the succes-sive steps used to obtain resultXk+1from the previous results {Xt}t=1,...,k.
prediction step
LetPk+1be the prediction of the model at timek+ 1, we have
Pk+1=f({Xt}t=k−Np−1,...,k, D, δ) (1)
fdenotes the process that provides the prediction using theNp previous results{Xt}t=k−Np−1,...,kand the parametersDand δ. A polynomial curveCof degreeDwas used to fit theNp(Np was set to 3) previous results{Xt}t=k−Np−1,...,kof the process. Then, the curveCwas used further to get the prediction relying onδ, a parameter that defines the distance between the previous resultXkand the current predictionPk+1(δwas around 0.5
me-ters). The resulting predictionPk+1 is found by selecting the
point distant ofδfrom the previous resultXkwhen following the curveC. It is illustrated in Figs. 3(b) and 3(c).
observation selection step
LetOk+1be the selected observation of the process at timek+1.
Let us defineApandA′
ptwo areas around a given pointP, re-spectively relying on two radius parametersrandr′
(a) (b) (c)
(d) (e) (f)
Figure 3: The road side detection steps from timekto timek+ 1. (a) LIDAR points and previous resultsxk−4, . . . , xk. (b)
poly-nomial fitting by a curveC(c) selection of the predictionPk+1.
(d)APk+1the search area aroundPk+1. (e) selection of the best
observationOk+1(f) new resultxk+1.
we setrandr′
to 0.25 meters and 0.1 meters respectively).Ok+1
was selected within the areaAPk+1. In Figs. 3(d), (e),APk+1are depicted by a orange circle.Ok+1is chosen by:
Ok+1=g(Pk+1, θcurb, r, r gdenotes the process that selects an observation relying on the predictionPk+1and three parametersθcurb,randr
′ .
θcurbis the representativeθvalue of a classical curb (regarding the radius value parameterR, see section 2.1.1). In the exper-iments, θcurb value was 20 degree. Ai is the area around the pointiof radiusr. N(a, b, σ)denotes the value at a positiona of a Gaussian function centered inband of standard deviationσ. dis(i, j)is the distance between points of indexiandj. σ1and
σ2 are deviation parameters set to 5 cm and 5 degree. Such a
model helps in selecting an observation for which its own feature value and the close (thanks toσ1) neighborhood feature values
are close to parameterθcurb (thanks toσ2). θcurb, σ1 andσ2
respectively correspond to angle, distance and angle values, and hence don’t depend on the observed scene. Also, if density is high, the radius parameter valueRis constant for areas close to the laser and henceθcurbparameter stands. Fig. 4 describes the observation selection process. In Fig. 3(e), the selected observa-tionOk+1verifying Eq. 3 is depicted in brown.
result step
The resulting road curb localization is a weighted mean of the prediction and the selected observation:
Xt+1= (1−α(WObs)). Pt+1+α(WObs). Ot+1 (4)
whereWObs= maxi∈APk+1Wi(Wiis defined in Eq. 3). The functionα(WObs)characterizes the reliability given to se-lected observation regarding the model predictions. It was de-fined by a parameterS that correspond to a multiplying factor
Figure 4: Description of the observation selection step. The blue points are the LIDAR points, and the darker blue they are, the closer ofθcurbthey are. TheA′
pregions are the regions within which points are used to computeWp(see Eq. 3) and are shown for three pointsj1,j2andj3. Among all the points inAPk+1,j3
is the chosen observation.
(S value was set to 1.5) ofWObs. As soon asWObs is higher than 1
If no observation is available, i.e., in case of an occlusion, the model follows the prediction until it founds a new observation. In addition, as long as the process is located in an occluded part of the point cloud, the radius parameterrthat defines the obser-vation 3D search area is increased by a multiplying parameter M at each time step until it reaches a limitLM (In practice,M value was 1.125 andLM value was 0.5 meters). When a new observation is found, therparameter is set to its initial value. In the case of curb ramps, selected observations have a feature value θobswhich is far away from the parameter valueθ. Hence, these observations have little influence on the weighted result from pre-diction to selected observation, and the model still (mainly) fol-lows predictions.
curb ramp detection
Curb ramps are detected using a sliding window process on the detected road sides. The size of the sliding window corresponds toKtotsuccessive results (Ktotset to9). If at leastKminvalues ofθobsin the sliding window are below a given parameterθmin, a curb ramp is detected (Kminandθminwere respectively set to
6and24).
2.2 Road and pavement surface modeling
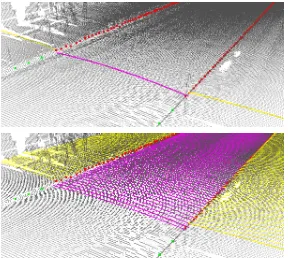
Figure 5: Points of the road around the slice in light blue. Points of a walking area around the slice in deep blue. Road and walking area surface modeling respectively in purple and yellow.
Figure 6: Up: surface model of the first slice in purple and yellow. Down: surface model of successive slices.
2 usually and 3 in crossroads, see further). The same process is applied to walking areas. Purple and yellow points in Fig. 5 are discretizations of road and pavement surface polynomials. The process moves forward in the direction that is perpendicu-lar to slice’s one. A advancing parameterAdefines the distance between two successive slides (here it was set to 25cm). The pro-cess stops when it get out of the point cloud area. An illustration of the evolution of the process is depicted in Fig. 6. Once the first street slice surface is approximated, a temporal consistency is set up in the RANSAC procedure. It forces successive polynomials to be relatively similar. Indeed, in the RANSAC process, only the polynomials that have parameters close to previous ones are taken into account. It helps handling occlusions and important obstacles by using previous surface models (as well as neighbor-ing 3D points) to estimate the new one. If no information at all is available (which may happen in the walking areas, if a high ob-stacle is located between the LIDAR sensor and the pavement), the surface model remain constant and equal to previous one.
3 RESULTS AND EVALUATIONS
3.1 Mobile laser scanning
LIDAR data were obtained by a multi-sensor mobile laser scan-ning system called Stereopolis (see (Paparoditis et al., 2012)). The Stereopolis system is composed of a navigation device hy-bridating measurements from two GPSs, an inertial measurement unit, and a wheel odometer. The navigation device produces geo-referencing of the platform that allows to locate all data and im-agery in a global reference datum.
Data processed in this article have been acquired using a Riegl VQ-250 located at the back of the truck. This LIDAR have an
Tests of the curb detection process have been realized on several parts of the Parisian road provided by the Stereopolis. In most part of the tested scenes, the model provides accurate road side detection (Fig. 7).
Figure 7: Result of the prediction/estimation road side detection model in a crossing part (red points). Green points are the initial-ization.
Satisfying results have been obtained, even in the presence of oc-clusions and curb ramps, especially in the linear parts of the road. In Fig. 8 the right behavior of the model regarding occlusions is illustrated. Many vehicles parked between the LIDAR sensor and the road side to detect. However, the model uses the previous results to get a fine prediction of the road side. Following these predictions, the model passes through the occlusions and finds out the road side on the other side of the occlusion.
Figure 8: Result of the prediction/estimation road side detection model in two linear parts with many occlusions (red points).
There are still circumstances that are difficult to handle with the proposed model. Especially, if a curb ramp or an occlusion occurs in the bending part of the road side, the system may fails to follow the road side. Indeed, if no 3D curb profile pattern is observed in a bend, the prediction of the model will fail to retrieve the shape of the road side. In order to efficiently and quickly process large amount of data, a semi-automatic scheme has been set up.
Semi-automatic version
Our system may fail with curb ramps or occlusions that occur in bends. A user-machine interface step that provides an efficient semi-automatic tool to process curb detection in large point cloud data is considered.
Figure 9: Result of the prediction/estimation road side detection model with two interactions. The yellow curve is the initial result, the purple curve is the result with one interaction and the red one is obtained using two interactions. The cyan points correspond to user mouse clicks. The second cyan point has been clicked two times: as second click for the first redirection and as first one for the second redirection.
system produces an alarm when the process within a hole or a flat part of the ground for more thanNs successive steps (Ns was set to 20). First, an operator one tells the system from where to reprocess the road side (i.e., when the system begins to fail), then he indicates a position further (i.e., a direction) of the good road side. This latter one will attract the process by enforcing the system to make predictions in this direction. In Fig. 9, user mouse clicks are depicted in cyan. The second cyan point has been clicked two times: as second click for the first redirection and as first one for the second redirection.
Figure 10 presents a typical result that was obtained on the Parisian road network. Three interactions were needed since two curb ramps occur in bending parts of the road side (the purple squares) and one occlusion was observed in a road side chicane (the green square). Every curb ramps observed in this road section have been successfully detected (i.e., nine over nine). Thanks to the user-machine interacting scheme, such a result may be obtained on any road section in very little time and may be used to model road and walking area surfaces.
Figure 10: Result of the prediction/estimation road side detection model with three interactions on a part of Rue D’Assas, in the 6th district of Paris (corresponding to 200 meters of road). The upper image is the results of curb and curb ramp detection, the lower one also presents the LIDAR data. In red, the detected curbs and in orange, the detected curb ramps. Purple squares correspond to interaction caused by a curb ramps occurring in bends. The green square correspond to an occlusion that happens in the end of a road side chicane.
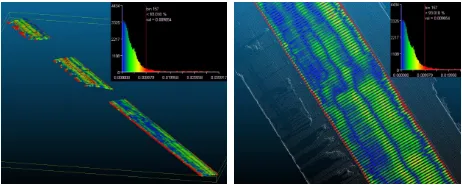
Figure 11: Maps and histograms of the distances between the pro-duced surface model and the real ground points on a road section.
3.3 Road/pavement surface modeling
Results of the surface modeling are quite satisfying since the model reaches a centimetric precision on average. It is illustrated in Fig. 11 that presents the map of the distances between the surface model and ground points. To obtain this map, portions of "good" road (not including crossroads, see further) have been segmented, and obstacles removed. It allows to compare reliably a model with the real data. Figure 11 shows that for 93% of the points, the precision is less than 1cm and the mean distance is around 0.5cm. Same results have been obtained with pavements. Red areas on the borders of the road correspond to gutters, that are not specifically considered in the model. Precision of the sur-face reconstruction falls here to 2/3 cm.
As seen in Figs. 12 and 13, the model accurately fits surfaces and is adapted to variations of ground shapes. In Fig. 13, a curb ramp surface is well approximated.
Figure 12: An example of surface modeling on a curb area.
Figure 14: A reconstructed area, behind a vehicle. Point cloud is superimpose on the left.
Figure 15: Inaccurate reconstruction. Point cloud is superimpose on the left.
ramp area is observed that was not present at the beginning of the hole. Hence, the method reconstructs surface as a standard curb and suddenly fits the curb ramp when exiting the hole. It creates a wrong 3D pattern (a "stair") that does not exist.
Crossroads are detected and handled by the method (see Fig. 16). Indeed, if the distance between the street slice and a road side is higher than the advancing parameterA(see section 2.2), a cross-road is detected. In this cases, a third order polynomial (instead of a second order one) is used to model surface. Indeed, it has been observed that while a parabola usually fits a standard road part, crossroads surfaces are more variable. Using a third order poly-nomial enables to efficiently fit such variations on the ground. Fig. 17 presents result of street ground modeling in a Parisian street. It was obtained rapidly (thanks to simple interacting scheme) and is in a centimetric precision. Accurate street ground model-ing is reachable for areas of any scale.
Tests have only been performed on some parts of the Parisian network provided by the Stereopolis. It would be interesting to test the method on other LIDAR data corresponding to scenes in other cities, in order to verify robustness of the process.
4 CONCLUSION
In this paper, a road/walking areas surface modeling for MLS LI-DAR data is presented. It is composed of two parts, a model for road side and curb ramp detection is first described. Results of this first step are further used to model surfaces of both roads and walking areas. The process handle occlusions due to obsta-cles since both road sides and surfaces are reconstructed when no information is available. The system has been successfully tested on large parts of the Parisian road network. A simple user-machine interaction step is also proposed to provide an efficient tool for processing of large amounts of data.
Figure 16: Crossroad areas.
Figure 17: Surface model of a street. Point cloud is superimpose on the left.
REFERENCES
B. Yang, L. Fang, J. L., 2013. Semi-automated extraction and delineation of 3d roads of street scene from mobile laser scan-ning point clouds. ISPRS Journal of Photogrammetry and Re-mote Sensing 79, pp. 80–93.
Floros, G. and Leibe, B., 2012. Joint 2d-3d temporally consistent semantic segmentation of street scenes. In: In Proceedings of the IEEE Conference on Computer Vision and Pattern Recognition. Han, J., Kim, D., Lee, M. and Sunwoo, M., 2012. Enhanced road boundary and obstacle detection using a downward-looking lidar sensor. IEEE Trans. Vehicular Technology 61(3), pp. 971–985. Hernàndez, J. and Marcotegui, B., 2009. Filtering of artifacts and pavement segmentation from mobile lidar data. In: Laser-scanning09.
Hervieu, A. and Soheilian, B., 2013. Road side detection and reconstruction using lidar sensor. In: IEEE Intelligent Vehicles Symposium.
Maye, J., Kaestner, R. and Siegwart, R., 2012. Curb detection for a pedestrian robot in urban environments. In: In Proceedings of the International Conference on Robotics and Automation. McElhinney, C., Kumar, P., Cahalane, C. and McCarthy, T., 2010. Initial results from european road safety inspection (eursi) mobile mapping project. International Archives of Photogrammetry, Re-mote Sensing and Spatial Information Sciences.
Oniga, F. and Nedevschi, S., 2010. Processing dense stereo data using elevation maps: road surface, traffic isle and obstacle de-tection. In: IEEE Transactions on Vehicular Technology. Paparoditis, N., Papelard, J.-P., Cannelle, B., Devaux, A., Soheil-ian, B. and N. David, E. H., 2012. A purpose and multi-sensor 3d mobile mapping system for street visualisation and 3d metrology. Revue Française de Photogrammétrie et de Télédé-tection 200, pp. 69–79.
Siegemund, J., Franke, U. and Förstner, W., 2011. A temporal filter approach for detection and reconstruction of curbs and road surfaces based on conditional random fields. In: In Proceedings of the IEEE Intelligent Vehicles Symposium.
Stückler, J., Schulz, H. and Behnke, S., 2008. In-lane localization in road networks using curbs detected in omnidirectional height images. In: Robotik 08.


