RECONSTRUCTION OF 3D OBJECTS OF ASSETS AND FACILITIES BY USING
BENCHMARK POINTS
S. U. Baig a, *, A. A. Rahman b
a
3D GIS Research Lab, Department of Geoinformatics,
Faculty of Geoinformation Science and Real Estate, Universiti Teknologi Malaysia (UTM), 81310 UTM Skudai, Johor Bahru, MALAYSIA- [email protected], b [email protected]
Commission VI, WG VI/4
KEY WORDS: Terrestrial Laser Scanning, 3D modelling
ABSTRACT:
Acquiring and modeling 3D geo-data of building assets and facility objects is one of the challenges. A number of methods and technologies are being utilized for this purpose. Total station, GPS, photogrammetric and terrestrial laser scanning are few of these technologies. In this paper, points commonly shared by potential facades of assets and facilities modeled from point clouds are identified. These points are useful for modeling process to reconstruct 3D models of assets and facilities stored to be used for management purposes. These models are segmented through different planes to produce accurate 2D plans. This novel method improves the efficiency and quality of construction of models of assets and facilities with the aim utilize in 3D management projects such as maintenance of buildings or group of items that need to be replaced, or renovated for new services.
* Corresponding author. This is useful to know for communication with the appropriate person in cases with more than one author. International Archives of the Photogrammetry, Remote Sensing and Spatial Information Sciences,
1. INTRODUCTION
Although, in the natural environment, many studies have been conducted to collect spatial data using sophisticated surveying equipment such as aerial LiDAR, EDM theodolites, GPS, photogrammetry, many of these studies. Each equipment has its own limitation such as methods using terrestrial photogrammetry produce better results but aerial coverage is restricted. Similarly, aerial photogrammetry offers increased spatial coverage but reduced elevation accuracy (Arayici, 2007).
The utilization of terrestrial laser scanner (TLS) has proven to be fastest in reconstructing the 3D objects as compared to other methods. Similarly, other advantages of reconstruction from TLS is not only buildings, but also others objects that would have been not possible to achieve their real shape using other methods such as trees, landscape, etc. additionally, 3D Laser Scanners in the natural environment also allow construction of Digital Elevation Models (DEMs) (Mendy and Chen, 2006). Real shape, color and exact location of objects can be reproduced by processing TLS.
A large amount of data is produced using terrestrial 3-D laser scanner to scan in a single site. Sometimes the amount of the scanning data of one or a few buildings reaches up to several hundreds of megabytes so the volume of data depends upon the type and number of buildings chosen to be scanned. In case of large buildings, the use of file system management is clearly inadequate Ming et al., 2009. However, other databases such ORDBMS for managing large-scale point-cloud data is a significant. In this case, large amount of data can be effectively organized and managed. Reconstruction of building models from the data stored in a database can be easier and efficient.
This paper describes a methodology to use the geometrical information obtained scan process from Laser Scanner (TS) with the aim to reconstruct 3D buildings shapes of target area. The proposed method constitutes three (3) phases which include capturing of laser scanning data; filtering as pre-processing; and extraction of shapes of 3D building models from pre-processed data. For this purpose as part of initial phase, an experimental data of interior and exterior of a number of buildings is acquired within UTM, Johor Bahru campus. For this purpose, positions of a number of scan points were identified to determine the distance from object to scanner. Scanning was carried out in a number of scanning stations. The second and third phase is not yet completed. However, special attention will be employed during the processing, shaping the models and analysis stage of laser scanner data. This other aim of this research is to These equipments are called terrestrial laser scanners which operate based on laser technology.
Since ‘1980s, laser scanners based on the triangulation principle and high degrees of precision (less than 1 mm) have been speed surveying. Also, a set of mechanisms that allows the laser beam to be directed in space in a range is being used as that varies with respect to the equipment. Distance is measured on a known direction required for each point to be captured. The coordinates (X, Y and Z) of a point can be computed for each recorded distance-direction (Bornaz and Rinaudo, 2004). However, laser scanners can help capture millions of points to be recorded in small fraction of time slice. These equipments are being used for different application i.e. architectural, archaeological and environmental surveying etc.
Points to be surveyed are captured using total stations while laser scanners randomly capture set of point cloud which depends upon the wishes of the operator to select the portion of the object to capture and the density of the points during the scan as well. In this case, angular step of the scan in vertical and horizontal planes are selected by the operator. The capturing is made automated after initial values are chosen.
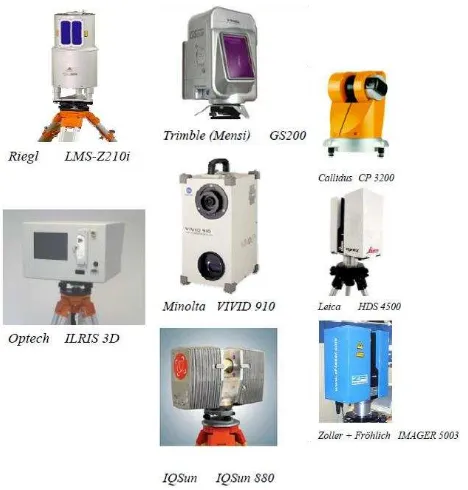
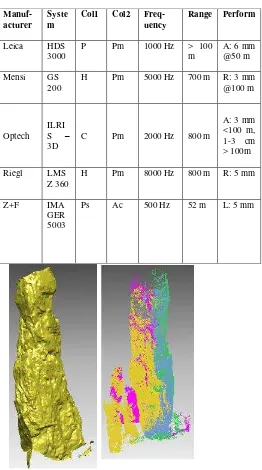
The result of the survey conducted using laser scanner is very densely populated points cloud also called DDSM (Dense Digital Surface Model). The coordinates (X, Y, and Z) for each point of the model and the reflectivity value become the output of the survey. Figure 1 shows different types of scanners desinged by different manufacturers while Table 1 shows the measuring technology, range, accuracy and manufacturers of different scanners use for terrestrial scanning. Different types of scanners designed by different companies with different coverage and performance is illustrated in Table 2.
Figure 1. Laser scanners (adopted from GIM International, 2011) International Archives of the Photogrammetry, Remote Sensing and Spatial Information Sciences,
VisImage, Zoller+Fröhlich Optical
triangulation
<5 <1 Mensi, Minolta
Table 1. Classification of laser scanners
Whereas
Ac= Accuracy Ps = Precision
P = Panorama scanners, C = Camera scanner H = Hybrid scanner, Pm = Pulse-Measurement A = Phase Measurement R = Resolution, L = Linearity
For this purpose as part of initial phase, an experimental data of interior and exterior of a number of buildings is acquired within UTM, Johor Bahru campus. For this purpose, positions of a number of scan points were identified to determine the distance from object to scanner. Scanning was carried out in a number of scanning stations. As this set of points is acquired in a completely arbitrary way, with the exception of the parameters imposed by the operator, it is necessary to manage this data in a critical and reasonable way. Particular attention must be paid to the quality of the original data.
3. DATA PROCESSING AND EXTRACTION OF 3D MODELS
After a set of points cloud captured, a set of actions are made to process TLS data with the aim to produce correct digital model of the object. The set of actions include the pre-processing or initial treatment of the laser data. As “initial treatment” means all the operations that are directly carried out on the point cloud, i.e. (1) data filtering (noise reduction), and the (2) point clouds registration and (3) geo-referencing operations. The result of these procedures becomes “noise free” point cloud (without outliers, gross and systematic errors) (Bornaz and Rinaudo, 2004). Extraction of 3D models from noise free point cloud is second stage of the data processing which is explained in section 4.
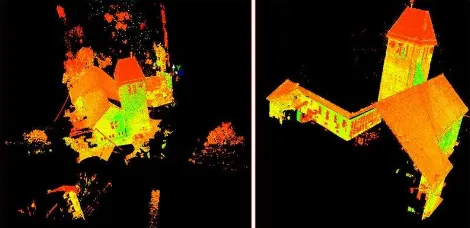
The second part of the laser scanner data management, the extraction of 3D models, is a set of operations that, starting from any point cloud, allows a surface model of the object to be formed. While there is a huge range of different products on the market to carry out extraction of 3D models, just few software for a correct initial treatment of TLS data can be found. An example from (Bornaz and Rinaudo) of mode of The Saint
Jacques tower – Alléves – France generated after the alignment
process and 3D modeling process is presented in below given Figure 2.
Figure 2. The Saint Jacques tower – Alléves – France – Model after the alignment process (left) and after the 3D modelling process (right) (Source: Bornaz & Rinaudo)
Several researchers proposed different methods to extract 3D models from TLS data. A detailed description of their work is presented in this section. The research work presented by (Pu, 2008) shows a new approach which generates building façade outlines from TLS points clouds automatically. This research is an extension of his previous work for building reconstruction process based on TLS given in (Vosselman, 2009). The steps include: feature extraction; modeling; and refining and texturing. During the modeling step, outline polygons of recognized building features (wall, door, roof, dormer, window, Manuf-International Archives of the Photogrammetry, Remote Sensing and Spatial Information Sciences,
extrusion) are generated by geometry fitting of each feature segment. Then the solid polyhedron model of a building is created by combining the fitted outline polygons. Following conclusions were drawn from these experiments:
The process of building outline generation can be automated from TLS point clouds.
Building outlines generated from TLS points can achieve high LoD (level of detail). Large structures and tiny structures are detected and modeled. Outlines for occluded parts are not reliable, because
no laser point is available.
There is still quite a lot of improvement required in this research.
Another method proposed in (Mumtaz, 2008) experimented based on compression of the generated triangulated mesh using processing techniques on TRL data. Processing include: filtration; 2D/3D mesh triangulation (TIN); mesh simplification and smoothing; conversion to VRML; and storage of the models in a database. Generated models are represented in the VRML (Virtual Reality Markup Language) format to be imported into CityServer 3D (3D GeoDatabase) developed by the department of Graphic Information Systems of the Fraunhofer Institute, Dramstadt, Germany. A number of modeling tools i.e. 3D Studio Max, ArcGIS (9.x), AutoCAD etc were used for this purpose. The existing three-tier architecture for visualizing of 3D models from 3D GeoDatabase is experimented for visualization of acquired TLR data. Figure 3 shows the methodology for modeling based on mesh and triangulation and storage in 3D City Server. A result after point cloud cleaning operations is presented in below Figure 4.
Figure 3. Methodology (Adopted from Mumtaz, 2008)
Figure 4. Point Cloud Cleaning Operations (Source: Mumtaz, 2008)
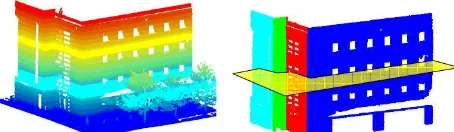
Method presented by (Arayici, 2007) shows that an accurate 3D model of the building can be produced by applying a series of scans externally and internally. This model can be sliced through different planes to generate both accurate 2D plans and elevations as well. This novel technology can help improve the efficiency of maintenance of buildings within Built Environment. Additionally, LS technology can be integrated with differential GPS with the aim to model a terrain for the analysis and inspection purposes of terrain structure accurately. Below Figure 5 shows the workflow for generation of 3D models followed an illustratation of result applying an integrated airborne and terrestrial datasets in the same environment method in Figure 6.
Figure 5. The methodology of the point cloud data capture, processing and modeling (adopted from Y. Arayici, 2007).
Figure 6. Integrated airborne and terrestrial datasets in the same environment (Source: Arayici, 2007).
The research work presented in (Soria-Medina et al., 2010) establish a methodology to detect and therefore, to extract features of historic buildings. This methodology uses the intensity value obtained by TLS, along with the unsupervised classification and mathematical morphology concepts. The proposed methodology has been tested to obtain satisfactory results using the intensity value as a parameter for classification and segmentation of façade features, thus allowing the extraction of characteristics that make up the façades of historic buildings.
The possibility of having extra data (intensity value) may contribute to the detection and extraction of features of historic International Archives of the Photogrammetry, Remote Sensing and Spatial Information Sciences,
buildings, in addition to the geometric information of data provided by TLS systems.
The techniques for scanning and registration presented in (Bostrom, 2006) have been applied to 63 scans. A facade triangulated model based on the registered scans was constructed and combined with an triangulated aerial DSM resulting in a photo realistic and geometrically accurate 3D model. Current work concentrates on the further analysis of the automated registration paradigm, including speed optimization. Regarding the final 3D modelling, efforts focus on enhanced filtering including noise detection, ghost data removal and better closing of eventual gaps.
An integrated approach based on plane sweep technique, a semantic and geometric information integrated point matching based method is developed to register 2D floor plans with TLS points presented by Wang and Sohn (2001). Based on the registration, 3D façade model and indoor model are reconstructed and integrated simultaneously. The test results demonstrate the feasibility of the proposed framework presented in Figure 7. Additionally, the equipment is used to scan the scenario not for only buildings but also others objects i.e. trees, landscape etc, which would have been difficult to capture their real or photo-realistic shape using other traditional methods. Scanning was carried out in the university campus, so during data capturing process, it was imperative to consider some mis-calculations due to moving of students in and out of rooms. These moving objects (people) could affect the real color of certain objects in the vicinity as during scanning, photographs were not taken to depict real situation. Therefore, scanning was carried out while no body was present in the room (3D GIS Lab). So, scanner recorded no points of moving objects. However, the points collected with wrong colors as bad points can be identified and removed to produce good result in reconstructing of 3D objects.
Haala and Kada (2010) suggested that the development of fully automatic algorithms is still a problem faced by a large group of researchers due to difficulty of automatic interpretation lastingly limited operational 3D city modeling to systems with considerable manual operations and just a smaller number of tools for automation despite considerable effort. According to their postulates, since the mid-1990s the demand for 3D city models is incessantly growing and has meanwhile become usual. Especially Internet applications like digital globes as provided by Google Earth or Bing. Therefore, the use of TLS data capturing to provide detailed information on building facades becomes imperative. 3D modeling can be understood by shape grammars, which are suitable to represent the regular structure of these 3D objects. Such approaches can also integrate measurements of heterogeneous quality. For example,
differences in accuracy, coverage and density will occur due to variations in viewpoint and distance to the object of interest if 3D point clouds are used. If measurement is realized by specialized surveying systems like mobile mapping systems than these differences are inherent for TLS data capturing. However, such problems will become even more evident if terrestrial data is collected by consumers and non-experts in web-based applications.
Figure 8. An experimental re-construction from TLS data
To test data acquisition, in small scale, experimental TLS data of human face is captured and process followed by extraction of 3D model illustrated in Figure 8. In medium scale, interior and exterior of few buildings is acquired within UTM, Johor Bahru campus. Initially, the captured data will be filtered as pre-processing. Shapes of 3D building models from pre-processed data will be extracted. It is also the aim of this research is to investigate other aspects of 3D modeling i.e. 3D object reconstruction in the near future and development of a database for TLS data to store point clouds captured from laser scanner.
Acknowledgements
We would like to convey our deepest acknowledgement firstly to Universiti Teknologi Malaysia (UTM) for providing Research Grant Project Vote No. R.J130000.2427.00G24, An Innovative 3D Geo DBMS for Asset and Facilities Management.
Last but not least our sincere appreciations to Research data modelling with the3Dterrestriallaser scanner for built
environment, Automation in Construction, 16 (16): 816-829,
http://dx.doi.org/10.1016/j.autcon.2007.02.008
Mendy. S and Chen. W. 2006. Application of Terrestrial Laser
Scanning In 3D Reconstruction of Building Models. Dept. of
Civil Engineering, National Taipei University of Technology 1, Sec. 3, ChungHsiao E. Rd., Taipei 106, Taiwan
Ming. G, Yanmin. W, Youshan and Junzhao. Z. 2009. Research
on Database Storage of Large-scale Terrestrial LIDAR Data.
International Forum on Computer Science-Technology and Applications
Bornaz. L and Rinaudo.F. 2004. Terrestrial Laser Scanner Data
Processing Politecnico di Torino - Dipartimento di Georisorse e
Territorio, C.so Duca degli Abruzzi, Torino, 24 – 10129 International Archives of the Photogrammetry, Remote Sensing and Spatial Information Sciences,
Pu. P. 2008. Generating Building Outlines From Terrestrial Laser Scanning
The International Archives of the Photogrammetry, Remote Sensing and Spatial Information Sciences. Vol. XXXVII. Part B5. Beijing
Pu. P and Vosselman.G. 2009. Knowledge based reconstruction
of building models from terrestrial laser scanning data. ISPRS
Journal of Photogrammetry and Remote Sensing, Vol. 64, Issue 6, 575-584.
Mumtaz. A. 2008. Integrating Terrestrial Laser Scanning
Models into 3d Geodatabase. 2nd International Conference on
Advances in Space Technologies, Islamabad, Pakistan
Soria-Medina. A, Martínez. J, Buffara-Antunes. A. F., Arias. P and González-Jorge. H. 2010.
An Approach to Extracting Façade Features Using the Intensity Value of Terrestrial Laser Scanner With Mathematical
Morphology. Geomatics Department, Federal University of
Parana, Curitiba, Parana, Brazil, Natural Resources and Environmental Engineering Department, School of Mining Engineering, University of Vigo, Rua Maxwell S/N, Vigo, Spain
Bostrom. G., Fiocco. M, Gonc¸alves. J.G.M and Sequeira.V. 2006. Urban 3d Modelling Using Terrestrial Laser Scanners.
IAPRS Volume XXXVI, Part 5, Dresden.
Fröhlich.C and Mettenleiter. M. 2005. Terrestrial Laser
Scanning – New Perspectives in 3d Surveying. International
Archives of Photogrammetry, Remote Sensing and Spatial Information Sciences, Vol. XXXVI – 8/W2.
Langyue. W and Sohn. G, 2011. Kolbe, T. H.; König, G.; Nagel, C. (Eds.) 2011: Advances in 3D Geo-Information
Sciences, ISBN 978-3-642-12669-7 Series Editors: Cartwright,
W., Gartner, G., Meng, L., Peterson, M.P., ISSN: 1863-2246
Haala. N and Kada. M. 2010. An update on automatic 3D
building reconstruction. ISPRS Journal of Photogrammetry
Remote Sensing, Volume 65, Issue 6, November, 2010. 570-580.
GIM International, 2011. Terrestrial Laser scanners. Accessed July 15, 2012.
.
http://www.gim-international.com/files/productsurvey_v_pdfdocument_33.pdf)
International Archives of the Photogrammetry, Remote Sensing and Spatial Information Sciences,