A ROBUST PCT METHOD BASED ON COMPLEX LEAST SQUARES ADJUSTMENT
METHOD
Fu Haiqianga,*1, Zhu Jianjuna, Wang Changchenga, Xie Qinghuaa, Zhao Ronga
a
Department of Survey Engineering and Geomatics, Central South University, Changsha 410083, Hunan, China
KEY WORDS: Complex Least Squares; Polarimetric interferometric SAR (POLInSAR); Polarization Coherence Tomography (PCT); Vegetation height inversion
ABSTRACT:
Polarization Coherence Tomography (PCT) method has the good performance in deriving the vegetation vertical structure. However, Errors caused by temporal decorrelation and vegetation height and ground phase always propagate to the data analysis and contaminate the results. In order to overcome this disadvantage, we exploit Complex Least Squares Adjustment Method to compute vegetation height and ground phase based on Random Volume over Ground and Volume Temporal Decorrelation (RVoG+VTD) model. By the fusion of different polarimetric InSAR data, we can use more observations to obtain more robust estimations of temporal decorrelation and vegetation height, and then, we introduce them into PCT to acquire more accurate vegetation vertical structure. Finally the new approach is validated on E-SAR data of Oberpfaffenhofen, Germany. The results demonstrate that the robust method can greatly improve accusation of vegetation vertical structure.
*
Corresponding author: [email protected] 1. INTRODUCTION
Forests play an important role in Earth’s carbon cycle by absorbing carbon from the atmosphere and storing it in biomass (Le Toan et al, 2011). So it is important to improve the accuracy of forest biomass estimations. Polarimetric synthetic aperture rada interferometry (POLInSAR) combines POLSAR technology and synthetic aperture radar interferometry (InSAR) technology, which permit to separate main scattering contributions from a resolution cell of vegetated area (Trueuhaft et al., 2000). POLInSAR shows great potential for monitoring biomass (Le Toan et al, 2011; Cloude, 2006; Luo, 2011). It has demonstrated that we can exact biomass through empirical allometric relationship with tree height which obtained by POLINSAR or other mehods (Balzter, et al., 2007). However, forest density has not been considered by this method which reduces the biomass accuracy for some degree (Luo, 2011). PCT can solve this problem well. The reason is that PCT can recover the forest vertical structure directly and show the density difference (Praks, 2008).
Forest height and ground phase are important parameters of PCT. However, temporal decorrelation always has passive effect on forest height (Papathanassiou, 2003). Besides, temporal decorrelation also has effect on PCT result. This paper will propose a Complex Least Square method by the fusion of different polarimetric InSAR data. Adequate observations permit us to apply RVOG+VTD model to exact forest height, ground phase and temporal decorrelation. This method can not only smooth out the observation errors, but also can obtain more redundant observations which permit us to exact more robust forest height, ground phase and temporal decorrelation. After that we use the forest height, ground phase and temporal decorrelation to compute the PCT. In this manuscript, we will introduce this method in detail.
2. METHODOLOGY
2.1 Complex Least Square Method
In this section, we will introduce how we can exact forest height, ground phase and temporal decorrelation using Complex Least Squares method through the fusion of different polarimetric InSAR data.
The RVOG+VTD model can be expressed as (Papathanassiou, 2001; 2003)
where γ( )w is complex interferometric coherence, polarization-dependent and known complex; γ( )w is regarded as observation of surveying adjustment; w is the unitary scattering mechanism;
0
ϕ is the ground surface phase, an unknown real number and polarization independent; µ( )w is effective ground-to-volume amplitude ratio accounting for the attenuation through volume and depending on the polarization and an unknown real number;
t
γ is temporal decorrelation, polarization independent and real unknown; γv is volume-only coherence and polarization
independent, which can be expressed as (Papathanassiou, 2003)
(2 /cos )
σ is electromagnetic wave mean extinction coefficient for vegetation layer, and is a function of the density of scattering in the volume and their dielectric constant. θ,hv are radar incident
International Archives of the Photogrammetry, Remote Sensing and Spatial Information Sciences,
Volume XL-7/W1, 3rd ISPRS IWIDF 2013, 20 – 22 August 2013, Antu, Jilin Province, PR China
angle and vegetation height, respectively. kzis the effective
vertical interferometric wavenumber after range spectral filtering.
If we chose more than 4 polarizations, according to Eq.(1), then Eq.(1) becomes solving non-linear equation groups problem. As the development of POLINSAR, various of w, like PD, MCD, NR, Pauli, Lexicographic and so on (Cloude, 2009), are presented. That is to say, when we chose more than fourw, then redundant observations are obtained. Under this condition, surveying adjustment can be extended to solve the non-liner least squares problem (Wang et al., 2002). We must pay attention to that in Eq.(1), the observations are complex, not real. Zhu et al. have demonstrated that the complex least squares can solve this problem. The corresponding adjustment criterion is like this (Zhu et al., 2013)
2 (Seymour et al., 1994)
2
By the fusion of different polarimetric InSAR data, redundant observations are obtained. In this paper, we chose 10 polarizations, like HH, HV, VV, HH-VV, HH+VV, PD (PDHigh, PDLow), MCD (opt1, opt2, opt3) (Cloude, 2009). Every γ( )w can be divided into real and imagine parts just like the first stage of three-stage method (Cloude, 2009). In this situation, there are 14 unknowns and 20 observation equation. The Complex Least Squares method can reduce the observation error effectively because it considers the observation priori statistical errors.
At last the adjustment model can be expressed as (Wang, 2002; Zhu et al., 2013)
2.2 Synthesis of the Structure Function
The complex interferometric coherenceγ( )w , which is the normalized coherent sum of all contributions, is formulated for a random distribution of scatters, as shown in Eq.(6) (Papathanassiou, 2001;2003)
complex conjugate and <...> is the expectation; hvis the upper bound of integration, which represents forest height; The low bound 0 is looked as reference datum; The RVOG model is derived from this formula. For PCT method, the Fourier-Legendre polynomial decomposition is used to fit the structure function f w z( , ) . This is different from RVOG model. For RVOG model, the structure function is assumed to have exponential shape. The second order Legendre series of f w z( , ) is shown as follow (Cloude, 2006; 2007)
2
without considering temporal decorrelation, we can represent
10
However, we have not considered the effect of temporal decorrelation on Eq. (8). When we obtain the temporal decorrelation value, the Eq. (8) can be translated into (Cloude, 2006; 2007) International Archives of the Photogrammetry, Remote Sensing and Spatial Information Sciences,
Volume XL-7/W1, 3rd ISPRS IWIDF 2013, 20 – 22 August 2013, Antu, Jilin Province, PR China
robust PCT result using Eq.(10).
3. EXPERIMENTAL RESULTS
The experimental data are E-SAR L band fully polarimetric data. The test site locates Oberpfaffenhofen, Germany. Figure. 1. shows Pauli image and transects. From the Pauli image, we can clearly see two forests, as marked in Figure1. Forest. 1. is mixed forest, and forest 2 is labour management pine forest. H−α classification method is used to mask out the non-vegetation and low non-vegetation areas.
A A’
Figure. 1. Pauli image and transects
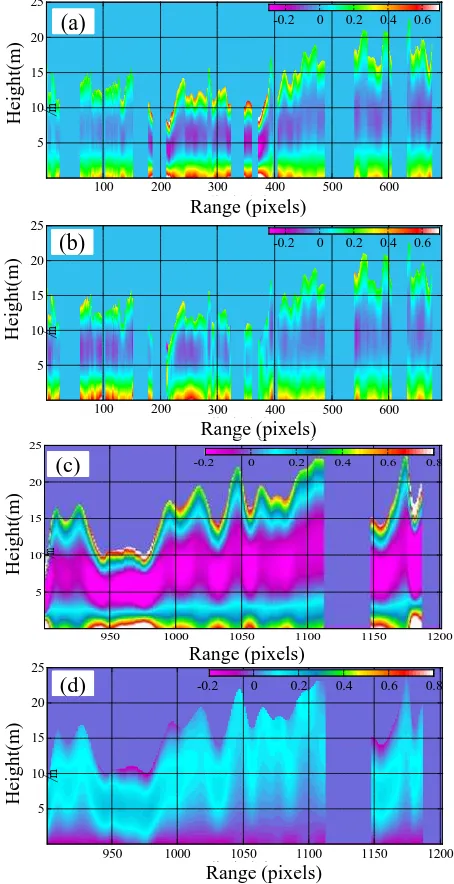
Figure. 2. shows tomograms along A-A’ (a,b) and B-B’(c,d). For forest 1, (a) is tomogram calculated without considering temporal decorrelation. And the corresponding forest height and ground phase needed by Eq.(8) are calculated by Eq.(5). (b) is calculated by Eq.(10). Near 100 range pixel, the corresponding area is covered by sparse forest. For this region, (b) is different from (a) for the height 5-10m, which are main trucks. Low value of f w z( , ) may be obtained. At the bottom of forest may reflect the presence of more “double-bounce” contributions. (b) matches this priori information. Between 200-400 range pixels, the corresponding area is covered by relatively dense forest. More “volume scattering” contributions may be occur. (a) shows low f w z( , ) value. On the contrary, (b) can overcome this problem for some degree. Except this, from (b) we can see, near 400-500 range pixels, the corresponding forest own higher density. In addition, we can conclude that, for this mixed forest, the top canopy own large f w z( , ) values, compared with truck layer. At the bottom of forest, we can see the corresponding
( , )
f w z values are also relatively large. The reason is that there
is low vegetation. Volume scattering also occur in this region. For forest 2, (c) is tomogram calculated by Eq.(8). (d) is calculated by Eq.(10). (c) is different from (d). The top and bottom of canopy show high ( , )f w z values in tomogram (c).
While for (d), canopy shows uniform f w z( , ) values. It contains a relatively homogeneous managed spruce forest (Reigber, 2005). We may conclude that the corresponding vertical structure is uniform. (d) can demonstrate this information well. What’s more, it is not suitable for low vegetation growth at the bottom of spruce forest. From (d), we can see low ( , )f w z values occur at the bottom of forest 2.
Totally speaking, the density of forest 2 is higher than forest1.
Despite the good performance of our method, we can see there are still negative profiles in the estimation. We should note that we just obtain an approximation to the true profile.
像素坐标
树高 /m
100 200 300 400 500 600
5
100 200 300 400 500 600
5
950 1000 1050 1100 1150 1200
5
950 1000 1050 1100 1150 1200 5
Figure. 2. Tomogram along A-A’ (a,b) and B-B’(c,d)
4. CONCLUSIONS
In this paper, a robust PCT method has been proposed. We have used Complex Least Squares method to compute forest height, ground phase and temporal decorrelation base on RVOG+VTD model. At last, using E-SAR data, we have tested the feasibility of our method. In future, muti-baseline will be applied to improve the resolution of PCT.
5. ACKNOWLEDGMENTS
The authors thank ESA for providing POLSARpro software and E-SAR data freely.
International Archives of the Photogrammetry, Remote Sensing and Spatial Information Sciences,
Volume XL-7/W1, 3rd ISPRS IWIDF 2013, 20 – 22 August 2013, Antu, Jilin Province, PR China
6. REFERENCES
[1] Le, Toan, T. et al, 2011. The BIOMASS Mission: Mapping global forest biomass to better understand the terrestrial carbon cycle. Remote Sensing of Environment, 115(11), pp.2850-2860.
[2] Trueuhaft R., N., Siqueira P R, 2000. Vertical structure of vegetatedland surfaces from interferometric and polarimetric radar. Radio Science, 35(1), pp.141-177. [3] Luo, H., 2011. Models and methods of extracting forest
structure information by polarimetric SAR interferometry. Chengdu: University of Electronic Science and Technology of China.
[4] Balzter, H., Rowland, C. S., Saich, P, 2007. Forest canopy height and carbon estimation at Monks Wood National Nature Reserve, UK, using dual-wavelength SAR interferometry. Remote Sensing of Environment, 108 (3), pp.224-239.
[5] Praks, J., Kugler, F., Hyyppa, J., Papathanassiou, K., Hallikainen, M., 2008. SAR coherence tomography for boreal forest with aid of laser measurements. In
Geoscience and Remote Sensing Symposium, 2008. IGARSS 2008. IEEE International, 2, pp. II-469-472.
[6] Papathanassiou K. P., Cloude S. R., 2003. The effect of temporal decorrelation on the inversion of forest
parameters from Pol-InSAR data. International
Ernational Geoscience and Remote Sensing Symposium, 3,
pp.1429-1431.
[7] Papathanassiou K. P., Cloude S. R., 2001. Single-baseline polarimetric SAR interferometry. IEEE Transactions on
Geoscience and Remote Sensing, 39(11), pp. 2352- 2362.
[8] Zhu J.J., Xie Q.H., Zuo T., Wang C.C., Xie J., 2013. Criterion of complex least squares adjustment and its application in tree height inversion with POLInSAR data.
Acta Geodaetica et Cartographica Sinica (Accepted).
[9] Wang, X., Z., 2002. Non-Linear model parameter estimation theory and application [M]. Wuhan: Wuhan
University Press.
[10] Seymour, M., S., Cumming I., G., 1994. Maximum likelihood estimation for SAR interferometry. IEEE
Geoscience and Remote Sensing Symposium, 4,
pp.2272-2275.
[11] Cloude, S., R., 2009. Polarisation: Applications in Remote Sensing. New York: Oxford University Press, pp.240-251. [12] Cloude, S., R., 2006. Polarization coherence tomography.
Radio Sci., 41(4).
[13] Cloude, S., R., 2007. Dual-baseline coherence tomography.
IEEE Geoscience and Remote Sensing Letters, 4(1),
pp.127-131.
[14] Reigber A., Neumann, M., Guillaso, S., Sauer, S., Ferro-Famil, L., 2005. Evaluating PolInSAR parameter estimation using tomographic imaging results. In Radar Conference, pp.189-192.
International Archives of the Photogrammetry, Remote Sensing and Spatial Information Sciences,
Volume XL-7/W1, 3rd ISPRS IWIDF 2013, 20 – 22 August 2013, Antu, Jilin Province, PR China