Chapter 7
User Interface and Decision
Visualization Applications
Key to successful use of MSS is the
user interface
The simpler the better
Many MSS applications have
hard
7.1 Opening Vignette:
Geographic Information
System at the Dallas Area
Rapid Transit (DART)
Buses
Vans
By the Mid-1980s Could
Not
–
Respond to customer requests
–
Make changes rapidly
–
Plan properly
–
Manage security
DART had
–
5,000 daily customer inquiries
–
Over 200 bus routes
Geographic
Information System
(GIS) Solution
View and analyze data on digitized maps
Now, DART Employees can
–
Rapidly respond to customer inquiries
(response time cut by 1/3)
–
Provide more accurate information
–
Plan services
–
Perform environmental impact studies
–
Cut bus schedule production costs
–
Track bus locations via GPS
–
Improve bus security
–
Monitor subcontractors
Analysis time cut from
days to less than an hour
Preparation of special
maps: time cut from up to
a week to five minutes
7.2 User Interfaces: An
Overview
Most computer users have limited computer
experience
Inexperienced users do not want to learn the
computer-oriented details
Most systems were developed for experienced
users
Need better user interfaces
The design of an appropriate MSS user interface
could be the most important determinant of
success of the MSS implementation
User Interface Design is
Influenced by User
Characteristics
MSS execution time
Learning time of the MSS
Ease of recall
System's versatility
Errors made by end users
Quality of help
Adaptability to changes in the users'
computer competency
Concentration level required by end users
Fatigue from using the system
User Interface
Human-computer interaction
Surface
Physical aspects (see Figure
7.1)
–
Input Devices
The Cyclical Process
(Figure 7.1)
1. Knowledge
2. Dialog
3. Action Language
4. Computer
5. P
resentation Language
Important Issues in
Building a User Interface
Choice of input and output devices
Screen design
Human-machine interaction sequence
Use of colors and shading
Information density
Use of icons and symbols (especially for
object-oriented)
The User Interface
Management System
(UIMS)
Accommodates the various
information representations
Accommodates the action
languages
Provides an interface between the
7.3 Interface Modes (Styles)
Interface (or interactive) Mode: the
combination of presentation and action
languages
Determines how information is entered and
displayed
Determines the ease and simplicity of
learning and using the system
–
Menu interaction
–
Command language
–
Questions and answers
–
Form interaction
–
Natural language processing
Menu Interaction
Includes Pull-down Menus (in
GUI)
Command Language
Questions and Answers
Computer asks, user answers
Natural Language
Mainly with keyboard
Some with voice input and
output
Major limitation
Inability of the computer to
understand natural language
Graphical User
Interface (GUI)
Icons (or symbols) are directly
manipulated by the user
Most common PC GUI OS: Windows
95
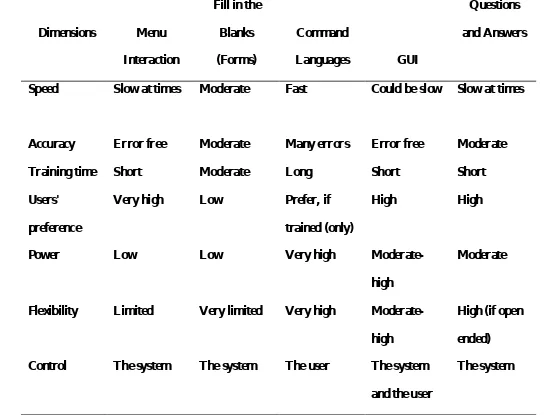
Usability of four styles along four
dimensions (Table 7.1)
Hybrid Modes
–
NLP + Hypermedia
–
Command + Menu
TABLE 7.1 Comparison of Interface Modes.
Dimensions
Menu
Interaction
Fill in the
Blanks
(Forms)
Command
Languages
GUI
Questions
and Answers
Speed
Slow at times
Moderate
Fast
Could be slow Slow at times
Accuracy
Error free
Moderate
Many errors
Error free
Moderate
Training time
Short
Moderate
Long
Short
Short
Users'
preference
Very high
Low
Prefer, if
trained (only)
High
High
Power
Low
Low
Very high
Moderate-high
Moderate
Flexibility
Limited
Very limited
Very high
Moderate-high
High (if open
ended)
Control
The system
The system
The user
The system
and the user
The system
User Interface
Importance
Interface cost can be 60 to 70
% of the total DSS cost
Ideally, interface adaptable to
7.4 Graphics
Graphics Software
Purpose: to present visual images
of information
Integrated software packages:
create graphic output directly from
databases or spreadsheets
–
Stand-alone graphics packages
–
Integrated packages - often include
The Role of Computer
Graphics
Help managers "visualize" data,
relationships, and summaries
(Figure 7.2)
TABLE 7.2 Types of Computer Graphics
Text
plays a critical role in graphics--listing points that the speaker is discussing, showing
subject titles, identifying components and values of a chart, and so on.
Time-series charts
show the value of one or more variables over time.
Bar and pie charts
can be used to show total values (by the size of the bar or pie), as well as
component values, such as breakdowns of, say, "source of money received."
Scatter diagrams
show the relationship between two variables, such as the number of air
travelers who fly on Mondays, Tuesdays, and so on.
Maps
can be two- or three-dimensional. Two-dimensional maps are useful for showing
spatial relationships, for example, the locations of customers and the locations of a
company's customer service facilities. Three-dimensional maps show surface contours with
a three-dimensional effect (see the GIS in the opening vignette).
Layouts
of rooms, buildings, or shopping centers convey much information in relatively
simple diagrams.
Hierarchy charts
, such as organizational charts, are widely used.
Sequence charts
, such as flowcharts, show the necessary sequence of events, and which
activities can be done in parallel.
Motion graphics
, such as motion pictures and television, clearly will continue to perform
vital functions.
Desktop publishing
systems that have extensive graphic capabilities (e.g., transferring a
picture into the computer, laying it in a desirable position, and then printing it) are gaining
in popularity.
7.5 Multimedia and
Hypermedia
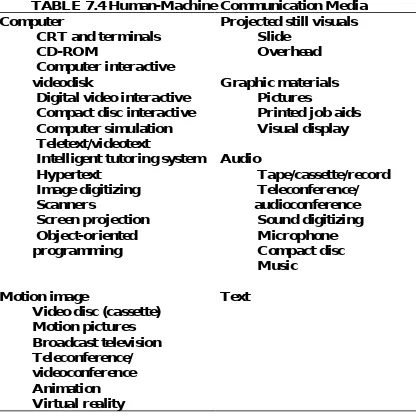
Multimedia
Pool of human-machine
communication media (Table 7.4)
–
Sound
–
Text
–
Graphics
–
Animation
–
Video
TABLE 7.4 Human-Machine Communication Media
Computer
CRT and terminals
CD-ROM
Computer interactive
videodisk
Digital video interactive
Compact disc interactive
Computer simulation
Teletext/videotext
Intelligent tutoring system
Hypertext
Image digitizing
Scanners
Screen projection
Object-oriented
programming
Motion image
Video disc (cassette)
Motion pictures
Broadcast television
Teleconference/
videoconference
Animation
Virtual reality
Projected still visuals
Slide
Overhead
Graphic materials
Pictures
Printed job aids
Visual display
Audio
Tape/cassette/record
Teleconference/
audioconference
Sound digitizing
Microphone
Compact disc
Music
Text
Hypermedia
Virtual reality via Virtual
Reality Modeling Language
(VRML) for Web delivery
Hypermedia: multimedia
Multiple Layers of
Information
Menu-based natural language
interface
Object-oriented database
A relational query interface
A hypermedia abstract machine
Media editors
Change management virtual memory
Hypermedia
Characterizations
Explicitly linked different
information structures
Multimedia
Linking information by
Classes of Hypermedia
Presentation for knowledge and
data navigation (Figure 7.3)
Active participation in research to
help record, organize, and
integrate information and
processes (Figure 7.4)
Hypertext
–
Nonlinear information access
–
Follow a thread (drill)
Multimedia, Hypermedia,
the Internet/Web and the
Object-oriented Approach
GUI Icons
Visual Programming
Web Hooks
Electronic Document
Management (EDM)
–
Problems with paper documents
–
EDM systems
7.6 Virtual Reality
3-D Presentations
3-D user interfaces
–
Manufacturing
–
Marketing
Virtual reality (VR)
–
Decision making
–
Advertising
–
Data visualization
–
Visual, spatial, and aural immersion
VRML: Virtual Reality Markup
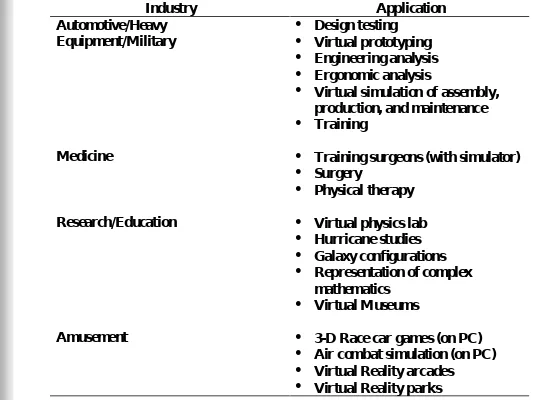
TABLE 7.5 Examples of Virtual Reality Applications.
Industry
Application
Automotive/Heavy
Equipment/Military
Design testing
Virtual prototyping
Engineering analysis
Ergonomic analysis
Virtual simulation of assembly,
production, and maintenance
Training
Medicine
Training surgeons (with simulator)
Surgery
Physical therapy
Research/Education
Virtual physics lab
Hurricane studies
Galaxy configurations
Representation of complex
mathematics
Virtual Museums
Amusement
3-D Race car games (on PC)
Air combat simulation (on PC)
Virtual Reality arcades
7.7 Geographic Information
Systems (GIS)
Computer-based system for
capturing, storing, checking,
integrating, manipulating, and
displaying data using digitized
maps
GIS Software
GIS Data In-house or
purchased
GIS Applications
Political campaign support
Consumer marketing and sales
support
Sales and territory analysis
Site selection
Fleet management
Route planning
Disaster planning
GIS and the Internet/Intranet
GIS Servers
Client GIS data
Emerging GIS Applications
With GPS
DSS In Focus 7.6: How
Com
panie
s are
Using
GIS
Supe
r Valu, the
country’s No. 1 supe
rm
arke
t w
hole
sale
r, use
s a GIS to he
lp
locate
store
s. GIS fre
e
s up analysts from
m
undane
m
anual m
apping
tasks to
actually analyze
the
proble
m
at hand.
W
e
ste
rn Auto, a Se
ars Roe
buck subsidiary, inte
g
rate
s com
pany data w
ith GIS to
cre
ate
a de
taile
d de
m
og
raphic profile
of a store
’s ne
ig
hborhood so it can se
t up
the
rig
ht product m
ix for its custom
e
r base
. This e
stablishe
s custom
e
r loyalty
m
ore
quickly. The
re
sult is that on ave
rag
e
, a store
bre
aks e
ve
n on its ope
rating
e
xpe
nse
s in six m
onths inste
ad of pre
vious to the
GIS, w
he
n it took an ave
rag
e
of
18 m
onths.
Trave
le
rs Insurance
use
s a de
sktop GIS to pe
rform
statistical analysis for site
-planning
, de
m
og
raphics of populations se
rve
d, database
visualization for
e
m
ploye
rs and sale
s support.
Se
ars, Roe
buck & Co. has de
ploye
d a GIS to re
place
a com
pute
rize
d, route
-planning
syste
m
that re
quire
d truck dispatche
rs at e
ach distribution ce
nte
r to
have
e
xte
nsive
know
le
dg
e
of roads and traffi
c in the
ir re
g
ions.
Several healthcare providers are using GIS to better understand the market they
serve. Two such ways are to chart regional anomalies in their service area, such
as higher than normal cancer rates, and to analyze potential partnerships with
other providers to expand the service area of the healthcare system, as well as
assess the need and potential market for expensive capital investments, such as
magnetic resonance imaging scanners.
Wood Personnel Services Inc., a Nashville-based employment agency, boosted
placements by 25 percent in one year by mapping neighborhoods where
temporary workers lived, then locating marketing and recruiting sites there.
Wilkening & Co., a Park Ridge, IL, Consulting firm, uses Wessex’s First St. GIS
to design optimized sales territories and routes for clients, slashing their travel
costs by an average of 15 percent.
CellularONE, a San Francisco cellular network provider, uses MapInfo from
MapInfo Corp. to map its entire cellular network, helping it to identify clusters
of call disconnects and dispatch field-service technicians for troubleshooting.
Acordia Senior Benefits, a subsidiary of Acordia Inc., uses Infomark from
Equifax Marketing Decision Systems Inc. and ArcView from Environmental
Systems Research Institute Inc. to map out locations for new insurance products
and to decide when not to get into an area.
NESA, a Danish utility, has implemented a comprehensive information
management system based on ESRI’s Arc/Info GIS system, to encourage and
enhance data accessibility. GIS provided a greater potential for improving the
daily routine and for creating possibilities for new applications, versus CAD or
standard database software.
In northern California, Pacific Bell is using GIS to help plot a broadband
network of fiber-optic cable.
7.8 Natural Language
Processing (NLP)
Applied artificial intelligence technology
Communicating with a computer in
English (or other human) language
Advantages:
Disadvantages:
Natural language understanding
Natural language generation
7.9 Natural Language
Processing: Methods
Natural language into the
computer
–
Example: English into Netscape
Navigator Commands
Natural language into another
Major NLP Techniques
Key word search (pattern
matching)
Language processing (syntactic
and semantic analysis)
Neural computing (relatively
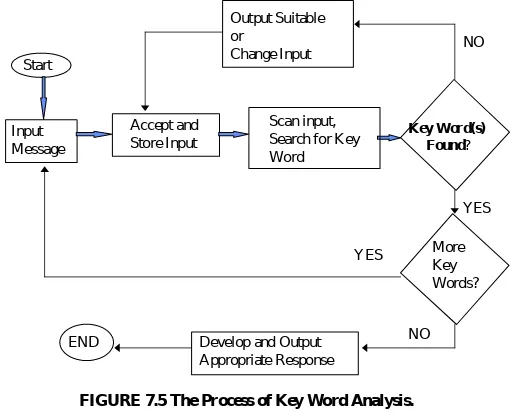
Key Word Analysis
(Pattern Matching)
Pattern matching process:
–
Search for selected key words or
phrases
Provide canned response
Start
Input
Message
Accept and
Store Input
Scan input,
Search for Key
Word
Key Word(s)
Found
?
Output Suitable
or
Change Input
More
Key
Words?
[image:39.720.120.632.66.480.2]Develop and Output
Appropriate Response
END
NO
YES
YES
NO
Key Activities
Parsing to determine word
boundaries
Pattern matching to compare
to prestored words and
phrases
Language Processing
(Syntactic, Semantic,
and Pragmatic Analysis)
Problems
–
Many words with multiple
meanings
–
Many structures including those
Definitions
Syntax analysis looks at the way a sentence
is constructed; the arrangement of its
components and their relationships
Syntactic processes analyze and designate
sentences to clarify the grammatical
relationships between words in sentences
Semantics assigns meaning to the syntactic
constituents
Pragmatic analysis relates individual
The Procedures
How Language Processing
Works
Simplified block diagram
(Figure 7.6)
–
Parser
Lexicon
–
Understander
–
Knowledge base
Parser Syntactically
Analyzes the Input
Sentence
Each word is identified and its part of speech
clarified
The Parser maps the words into a structure called a
parse tree
The Parse tree shows the meanings of all of the
words and how they are assembled
The Lexicon is a dictionary
The Parser is a pattern matcher and builds the parse
tree
The Understander works with the knowledge base to
determine sentence meaning
The understander uses the parse
tree to reference the knowledge
base
The understander can draw
inferences from the input
statement
The generator can initiate
7.10 Applications of Natural
Language Processing and
Software
Database interfaces
Abstracting and summarizing text
Grammar analysis
Natural language translation
Computer language to computer
language translation
Letter composition
7.11 Speech (Voice) Recognition
and Understanding
The computer recognizes the
normal human voice
Advantages of Speech Recognition
–
Ease of Access
–
Speed
–
Manual Freedom
–
Remote Access
–
Accuracy
Classifying Speech
Recognizers
Word Recognizers
Continuous Speech
Recognizers
Speaker Dependent
Speaker Independent
Voice Synthesis
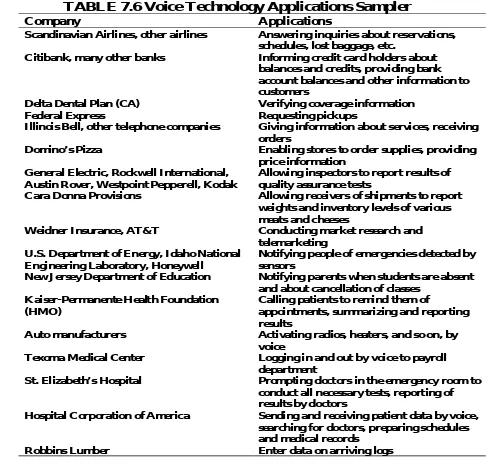
TABLE 7.6 Voice Technology Applications Sampler
Company
Applications
Scandinavian Airlines, other airlines Answering inquiries about reservations,
schedules, lost baggage, etc.
Citibank, many other banks Informing credit card holders about
balances and credits, providing bank account balances and other information to customers
Delta Dental Plan (CA) Verifying coverage information
Federal Express Requesting pickups
Illinois Bell, other telephone companies Giving information about services, receiving
orders
Domino’s Pizza Enabling stores to order supplies, providing
price information General Electric, Rockwell International,
Austin Rover, Westpoint Pepperell, Kodak Allowing inspectors to report results ofquality assurance tests
Cara Donna Provisions Allowing receivers of shipments to report
weights and inventory levels of various meats and cheeses
Weidner Insurance, AT&T Conducting market research and
telemarketing U.S. Department of Energy, Idaho National
Engineering Laboratory, Honeywell Notifying people of emergencies detected bysensors
New J ersey Department of Education Notifying parents when students are absent
and about cancellation of classes Kaiser-Permanente Health Foundation
(HMO)
Calling patients to remind them of
appointments, summarizing and reporting results
Auto manufacturers Activating radios, heaters, and so on, by
voice
Texoma Medical Center Logging in and out by voice to payroll
department
St. Elizabeth’s Hospital Prompting doctors in the emergency room to
conduct all necessary tests, reporting of results by doctors
Hospital Corporation of America Sending and receiving patient data by voice,
7.12 Research on User
Interfaces in MSS
4 Independent Variables
1. Human user
Demographics (age, education,
experience)
Psychological (cognitive style,
intelligence, risk attitude).
2. Decision environment
–
Decision structure
–
Organizational level
3. Task
Decision support (e.g., complexity level)
Inquiry/information retrieval
Data entry
Word processing
Computer-aided instruction.
4. Interface characteristics
Input/output media
Dialogue type
Presentation format (tabular, graphical,
colors, animation)
Dependent Variable:
Human/Computer
Effectiveness
Usefulness
Perceived ease of use
Performance (time, errors,
profit)
User attributes (satisfaction,
confidence)
Use of system option (high, low).
Results of Some
Experiments
1.Colors improve performance
2.Graphic versus tabular: inconclusive
Research on Graphics and Modeling
Metagraphs to represent system
structure graphically for analysis
New Interfaces
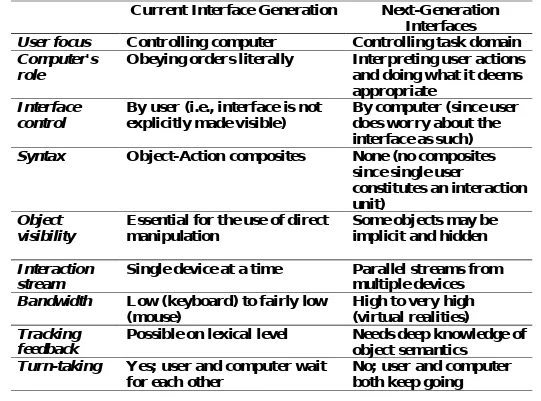
TABLE 7.3 Comparison Between the Current User Interface
Generation of Command-based Interfaces and the Potential Next
Generation of Interfaces Across 12 Dimensions.
Current Interface Generation
Next-Generation
Interfaces
User focus
Controlling computer
Controlling task domain
Computer's
role
Obeying orders literally
Interpreting user actions
and doing what it deems
appropriate
Interface
control
By user (i.e., interface is not
explicitly made visible)
By computer (since user
does worry about the
interface as such)
Syntax
Object-Action composites
None (no composites
since single user
constitutes an interaction
unit)
Object
visibility
Essential for the use of direct
manipulation
Some objects may be
implicit and hidden
Interaction
stream
Single device at a time
Parallel streams from
multiple devices
Bandwidth
Low (keyboard) to fairly low
(mouse)
High to very high
(virtual realities)
Tracking
feedback
Possible on lexical level
Needs deep knowledge of
object semantics
Turn-taking
Yes; user and computer wait
Interface
locus
Workstation screen, mouse,
and keyboard
Embedded in user's
environment, including
entire room and
building
User
programming
Imperative and poorly
structured macro languages
Programming-by-demonstration and
nonimperative,
graphical languages
Software
packaging
Monolithic applications
Plug-and-play modules
Summary
Users want computer systems that are easy
to use
The user interface represents the system to
most users
The user interface must be relatively friendly
Graphics are crucial
GIS
Virtual reality
Natural language processing and speech
recognition
Internet Exercise
10. Contact IBM
(http://www.ibm.com) to find
information about their Voice
Type Dictation, Merlin and
Group Exercise
Each group member will interview five
computer users at school, work or home.
For each user, identify the three interface
modes preferred by the user, ranked in
Questions for the
Opening Vignette
1.
Why is a GIS considered a
graphical user interface?
2.
What are the advantages of
GIS from a user interface point
of view?
Exercises
1. What is a natural language? Name two. What
distinguishes a natural language from a
computer language? Is Esperanto a natural
language? Why or why not?
2. Obtain an NLP/DBMS software (e.g., Q&A).
Try to use it on the database of Chapter 4,
Exercise 5. Compare the use of a regular
DBMS to the one supported by NLP.
3. Explain why icons in the Windows
4. Why is it “easier” for a natural
language to be translated into another
by a human versus by a computer?
5. In the early days of language
translation, the expression “The spirit
is willing, but the flesh is weak” was
translated to Russian and then back to
English. The new English rendering
Questions for
Case Application 7.1
1. Identify the voice recognition and voice synthesis
portions of the system.
2. Identify all the tasks, which do not involve voice,
carried out by a computer.
3. What paperwork can be eliminated by such a system?
4. What are the benefits to Nabisco?
5. What are the benefits to the employees?
6. What alternative communication technologies
described in this chapter can be used instead of the
system described here? Would you recommend any of
these; why or why not?