Summary Root hydraulic conductivity (Lp) and leaf osmotic
potential at full turgor (Ψπ,o) were measured in young,
drought-stressed and nondrought-stressed peach (Prunus persica (L.) Batsch), olive (Olea europaea L.), citrumelo (Poncirus trifoliata Raf. × Citrus paradisi Macf.) and pistachio (Pistachia integerrima L.). Drought stress caused a 2.5- to 4.2-fold reduction in Lp,
depending on species, but Ψπ,o was reduced only in citrumelo
and olive leaves by 0.34 and 1.4 MPa, respectively. No differ-ences existed in Lp among species for nonstressed plants. A
simple model linking Lp to osmotic adjustment through leaf
water potential (Ψ) quantified the offsetting effects of reduced Lp and osmotic adjustment on the hypothetical turgor pressure
difference between drought-stressed and nonstressed plants (∆Ψp). For olive, the 2.5-fold reduction in Lp caused a linear
decrease in ∆Ψp such that the effect of osmotic adjustment was
totally negated at Ψ = −3.2 MPa. Thus, no stomatal closure would be required to maintain higher turgor in drought-stressed olive plants than in nonstressed plants over their typical diurnal range of Ψ (−0.6 to −2.0 MPa). For citrumelo, osmotic adjust-ment was offset by reduced Lp at Ψ≈−0.9 MPa. Unlike olive,
stomatal closure would be necessary to maintain higher turgor in drought-stressed citrumelo plants than in nonstressed plants over their typical diurnal range of Ψ (0 to −1.5 MPa). Regard-less of species or the magnitude of osmotic adjustment, my analysis suggests that a drought-induced reduction in Lp
re-duces or eliminates turgor maintenance through osmotic ad-justment.
Key words: citrumelo, leaf osmotic potential, Olea europaea, olive, peach, pistachio, Pistacia integerrima, Poncirus trifoli-ata × Citrus paradisi, Prunus persica, stomatal closure, turgor, water relations.
Introduction
Drought stress produces a variety of changes in the physiologi-cal behavior of plants. Responses such as stomatal closure and osmotic adjustment have been documented in leaves of many tree crops (Jones et al. 1985). Less is known about the effects of drought on roots, although parameters such as root hydrau-lic conductivity (Lp) are important in determining leaf water
potential (Ψ) at a given rate of transpiration (Weatherley 1982). Most studies have focused on organ-specific responses
to drought, whereas interactions among factors affecting plant water relations are less frequently considered. For example, if drought stress results in reduced leaf conductance (g) and osmotic adjustment, then leaf turgor pressure (Ψp) may be
increased. Simultaneously, drought stress may reduce Lp
(No-bel and Huang 1992), potentially causing reductions in Ψ and Ψp depending on the extent to which changes in Lp, osmotic
potential and g offset each other. Because Ψp is the driving
force for cell expansion and ultimately the growth of plant organs (Cosgrove 1984), understanding the interaction among factors that affect turgor maintenance is important.
I examined the interaction of drought-induced changes in Lp,
leaf osmotic potential (Ψπ) and g in four economically impor-tant tree crops: olive, peach, pistachio and citrumelo. Peach and olive represent the extremes in drought tolerance seen in tree crops: peach is native to humid, temperate regions, and olive is native to arid, Mediterranean regions. Larsen et al. (1989) showed that olive tolerates lower water potentials than peach. Furthermore, olive has been cultivated for centuries in Mediterranean countries without irrigation on sites that would not support other tree crops (Romano 1977). Pistachio is native to the same region as olive and can be grown without irrigation in arid climates, provided that rainfall is at least 300--450 mm per year (Duke 1989). Olive is probably more tolerant than pistachio because it is grown commercially in Northern Africa, where only 200--300 mm of rain falls each year (Romano 1977), and olive tolerates lower predawn and midday Ψ than Pistacia species in Mediterranean climates (Duhme and Hinckley 1992). Citrus requires irrigation and often wind pro-tection for economic production in dry climates that support olive or pistachio production (Chandler 1950). However, citrus trees can survive leaf water potentials of −5 MPa (Fereres et al. 1979), whereas peach trees die after reaching −3 MPa (Proebsting and Middleton 1980). Thus, these crops may be ranked from most to least drought tolerant as olive > pistachio > citrumelo > peach.
Based on preliminary findings that drought stress causes a reduction in Lp and Ψπ, I developed a data set and a simple
analytical model to test the hypothesis that drought-stressed plants maintain higher turgor pressure through osmotic adjust-ment than nonstressed plants, given that the stressed plants must generate lower Ψ to maintain water uptake at reduced Lp.
Offsetting effects of reduced root hydraulic conductivity and osmotic
adjustment following drought
M. RIEGER
Department of Horticulture, University of Georgia, Athens, GA 30602, USA
Received February 28, 1994
Materials and methods Plant material
Commonly used rootstocks for peach, olive, pistachio and citrus were chosen: ‘Nemaguard’ peach (Prunus persica (L.) Batsch), ‘Manzanillo’ olive (Olea europaea L.), Pistacia in-tegerrima L., and ‘Swingle’ citrumelo (Poncirus trifoliata Raf. ×Citrus paradisi Macf.), respectively. Olives were grown from rooted cuttings, but other species were propagated from seed. Plants were grown in 15-cm diameter pots containing coarse sand and fertilized with a soluble fertilizer. Coarse sand was used because it provided good drainage and facilitated accu-rate root length measurements. Plants were 6--12 months old when data were collected in September--October 1992. Green-house conditions varied with season, with minimum tempera-tures of ≈ 15 °C in winter and maxima of ≈ 35 °C in summer. Integrated daily solar radiation was about 70% of outdoor values.
Experimental design
Twenty or more plants of each species were arranged randomly on two greenhouse benches. On August 29, 1992, plants of each species were divided into a nonstressed control group and a drought-stressed group. Nonstressed plants were irrigated every other day to run-off with 200--300 ml of water or nutrient solution. Drought-stressed plants received limited irrigation over a 25- to 45-day period according to the following scheme. Containers of drought-stressed plants were placed in pans that retained 90 ± 10 ml of water. Plants were examined daily for visible wilting or leaf cupping, and occasionally the appear-ance of the roots was observed by inverting the plant and removing the container. Plants exhibiting wilting, leaf cupping or root shrinkage had their pans filled; the water was rapidly absorbed by the medium. Roots in the upper portion of the containers of drought-stressed plants were exposed continu-ously to dry soil because subirrigation rewetted the lower half of the medium only. Drought-stressed plants required irriga-tion at intervals of 3 to 12 days; the period between irrigairriga-tions varied with species, leaf area per container and weather condi-tions. Average weekly irrigation rates for drought-stressed plants were: olive = 64 ± 12 ml, pistachio = 107 ± 29 ml, citrumelo = 198 ± 59 ml, and peach = 128 ± 17 ml. Periodic measurements of Ψ (pressure chamber, PMS Instruments, Cor-vallis, OR) and g (LI-1600 steady-state porometer, Li-Cor Inc., Lincoln, NE) quantified the extent of the drought stress im-posed during a drying cycle. Average midday Ψ was −1.5 to −1.9 MPa in drought-stressed plants before irrigation, whereas the Ψ of nonstressed plants was −0.6 to −0.9 MPa. Leaf conductance of wilted plants during the drought-stress period was highly variable, but generally 2- to 10-fold lower than that of nonstressed plants (200--400 mmol m−2 s−1).
Measurements
Root hydraulic conductivity (Lp) and the minimum Ψ gradient
required for water flow into roots (hereafter referred to as ‘‘intercept’’) were estimated on six intact plants per species per drought-stress treatment by the technique of Rieger and Motisi
(1990). Briefly, plants were brought to the laboratory and watered thoroughly the night before measurement. The canopy of each plant was enclosed in its own 42-l gas exchange chamber with the container and one basal side shoot left outside the chamber. Chamber conditions were: PAR ≥ 1000 µmol m−2 s−1, VPD = 2.0 ± 0.2 kPa, temperature = 27 ± 2 °C,
and [CO2] = 350 ± 10 µl l−1. The container was placed in 1 cm
of distilled water to ensure that the soil water potential was nearly zero. Leaves on the basal shoot outside the chamber were wrapped in parafilm and foil, and allowed to equilibrate with the water potential of the stem base. The water potential gradient across the root system was assumed equal in magni-tude, but opposite in sign, to the water potential of the wrapped leaf at steady state. Total water flow through the plant was measured by pumping chamber air through a desiccant column at a rate that maintained a constant dewpoint. After steady values of transpiration and Ψ were obtained, the lights were turned off, and the VPD was reduced to < 1.0 kPa to induce a lower flow through the plant. A regression equation was devel-oped for water potential gradient (y) versus water flow on a root length basis (x) from the two points obtained for each plant, assuming linearity (Rieger and Motisi 1990). The y -in-tercept of the regression gives the minimum gradient required for flow through the root system (Passioura and Munns 1984, Rieger and Motisi 1990), and the reciprocal of the slope gives Lp (in g H2O h−1 MPa−1 m−1).
Because Lp measurements were time consuming, data were
collected over a 20-day period. The measurement sequence was blocked by replication to enable comparisons among species and between stress treatments despite variations im-posed by time of drought exposure. Regression analysis deter-mined the effects of time of drought exposure on Lp and
intercept.
Leaf conductance was calculated from transpiration and vapor pressure gradient data under the conditions given above on whole plant canopies during Lp measurement. Boundary
layer conductance and leaf temperature were measured as described by Rieger and Motisi (1990). Length of living roots ≤ 2 mm in diameter was estimated by the line intersect method of Tennant (1975).
Osmotic potentials at full hydration (Ψπ,o) of mature and
expanding leaves were measured on October 1, 1992, 33 days after drought stress was imposed. Two mature and two expand-ing leaves were removed from each of five plants in each species × stress treatment combination just after sunrise. Leaves, which were wrapped in parafilm and aluminum foil with only the petiole protruding, were placed on ice and transported to the laboratory. The samples were placed in beakers, with enough distilled water to cover the exposed petiole, and stored at 4 °C overnight to become fully hydrated. Samples were then incubated at −80 °C to destroy membranes and eliminate turgor, and Ψπ,o was then measured with a
freezing, so the Ψπ,o values reported here are probably
overes-timates for living cells. The dilution effect was assumed to be similar between drought-stressed and nonstressed samples. Several samples of mature, drought-stressed olive leaves gave erroneously low values of Ψπ,o (i.e., −6.0 to −20.0 MPa),
presumably because of insufficient rehydration or desiccation during storage; these data were omitted. A t-test was used to separate means between stress treatments within a species.
Analysis of offsetting effects
The flow of water through plants at steady state (Jv) can be
approximated by:
Jv =L∆Ψ, (1)
where ∆Ψ is the water potential gradient between the root surface and the evaporating sites of the leaves. The L in Equa-tion 1 represents whole-plant hydraulic conductance, but for simplicity, I will assume that L = Lp because most of the
resistance to flow in plants resides within the root system (Kramer 1983, Rieger 1989). Assuming soil water potential approaches zero, ∆Ψ becomes simply −Ψleaf, because Ψ at the
root surface should be negligible when plants are rooted in moist soil. The comparison between previously drought-stressed and nondrought-stressed plants was made assuming a favor-able soil water status. Although the relationship between Jv and
−Ψleaf was linear, it did not go through the origin (Rieger and
Motisi 1990):
Setting Jv equal in previously drought-stressed and
non-stressed plants (denoted by subscripts s and n, respectively):
−Lp,n(Ψn − interceptn)=−Lp,s(Ψs − intercepts), (4)
change in root water uptake characteristics following drought. Drought stress often causes a reduction in stomatal opening that persists after rewatering (e.g., Fereres et al. 1979, Tan and Buttery 1982). This would reduce Jv,s and, in turn, increase Ψs.
To consider unequal rates of water flow in drought-stressed and nonstressed plants, the left-hand side of Equation 4 can be multiplied by Jv,s/Jv,n to give a modification of Equation 5 on
This equation considers the interaction of reduced g with changes in Lp. If drought stress reduces Jv,s (by stomatal
clo-sure) and Lp,s by proportionately the same amount, then
Equa-tion 6 predicts that drought-stressed and nonstressed plants will have the same Ψ, provided that any change in intercept is proportional to the change in Lp.
The effects of osmotic adjustment on Ψp and Ψ were
calcu-lated by means of a mathematical description of leaf pressure--volume (PV) curves (Cheung et al. 1976). The BASIC code for this program is available from the author.
Several simplifying assumptions were made to permit the analysis. First, the relationship between the bulk modulus of elasticity (ε) and Ψp was assumed to be asymptotic, equivalent
to the ‘‘Type II’’ response of ε to Ψp given in Roberts et al.
(1981) and to theoretical relationships presented by Cheung et al. (1976). A search of available literature on the four species used here found the ε versus Ψp relationship documented for
peach only (Andersen and Brodbeck 1988), where a linear (‘‘Type I’’ of Roberts et al. 1981) relationship for expanding leaves and a curvilinear (‘‘Type II’’) response for expanded leaves were observed. Second, a maximum value of ε of 20 MPa (εmax) was assumed based on data for peach (Andersen
and Brodbeck 1988) and apple (Jones et al. 1985). Third, the exponential coefficient relating ε to Ψp (β) was estimated as
−2.25, which allowed ε to approach within ≈ 10% of εmax at a
Ψp of 1.0 MPa; this was derived by inspection of curves
presented in Jones et al. (1985) and Cheung et al. (1976). Fourth, an apoplastic water content of 30% of relative water content (RWC) was used, which was a compromise between values of 40% (Santakumari and Berkowitz 1989) and 15--20% (Hardegree 1989) obtained for drought-stressed spinach leaves, and close to the value of 31% obtained for drought-stressed orange leaves (Fereres et al. 1979). Fifth, the slope of the linearportion of the PV curve (RWC versus Ψπ−1) was calculated assuming that Ψπ−1 approaches zero when the RWC reaches 30% (i.e., Ψπ approaches infinity when the symplastic water content reaches zero), and Ψπ−1 at 100% RWC equaled the reciprocal of Ψπ,o measurements for each species. The Lp
and intercept values used in the model were obtained from actual measurements. The turgor loss point was simply the RWC or Ψ where Ψp reached zero, obtained by inspection of
the program output.
The program was run assuming relative flow rates (Jv,s/Jv,n)
of 0.2, 0.4, 0.6, 0.8 and 1.0. The Ψs required to maintain each
relative flow was calculated by Equation 6, and values of Ψp at
the respective Ψ in drought-stressed and nonstressed plants were calculated from separate runs of the model with corre-sponding parameters. The difference in turgor pressure be-tween drought-stressed and nonstressed plants (∆Ψp = Ψp,s−
Ψp,n) was calculated and plotted versus Ψs to examine the range
Results and discussion
Influence of drought stress on Lp, Ψπ,o and g
There were no significant effects of time of drought exposure on Lp or intercept for any species during the 20-day
measure-ment period (data not shown). Lack of correlation of Lp with
time suggests that the drought-induced change in Lp occurred
within 25 days of withholding water.
Drought stress caused a 2.5- to 4.2-fold reduction in Lp,
depending on species, but reduced intercept for citrumelo only (Table 1). In nonstressed plants, values of Lp were not
signifi-cantly different among species, but drought-stressed olive plants had significantly higher Lp than drought-stressed peach
or pistachio plants. Whether differences in Lp among
drought-stressed plants were due to genetic variation in drought re-sponse or to differing levels of drought stress experienced by each species is unclear. Although all plants reached similar minimum values of Ψ before rewatering, olive used water more slowly than the other species, and as a result, probably had a more favorable soil water status overall. The decrease in Lp in response to drought in whole root systems of intact plants
was similar to the response of Lp to drought obtained with
excised roots of desert succulents (Nobel and Huang 1992). Similar Lp values among nonstressed plants that differ
widely in drought adaptation support previous work with Prunus where it was found that Lp could not be used to
discriminate drought tolerance (Rieger and Duemmel 1992).
The lack of variation among species and the apparent sensitiv-ity of Lp to soil drying suggest that the environment modulates
Lp to a greater extent than genetics in tree crops.
After rewatering, leaf conductance was not significantly affected by previous drought stress in any of the species (Ta-ble 1). Reduced g after rewatering drought-stressed peach and citrumelo trees has been reported (Fereres et al. 1979, Tan and Buttery 1982); however, the severity of drought-stress imposed in this study (Ψmin ≈ −2.0 MPa) was less than that imposed in
previous studies (Ψmin ≈ −3.0 to −5.0 MPa).
Osmotic adjustment occurred only in mature leaves of citru-melo and expanding leaves of olive (Table 2). The difference in Ψπ,o between drought-stressed and nonstressed plants was
greater in olive than in citrumelo, i.e., 1.4 versus 0.34 MPa, respectively. Generally, olive leaves had lower Ψπ,o values than
those of other species, and citrumelo leaves had the highest Ψπ,o values regardless of stress treatment or leaf type. The
values of Ψπ,o reported here agree closely with those reported
by others for olive, citrus and peach (Abdel-Rahman and El-Sharkawi 1974, Syvertsen et al. 1981, Rieger 1992). Values of Ψπ,o for P. integerrima were 0.5 to 1.0 MPa higher than
osmotic potentials at the turgor loss point reported for Pistacia terebinthus L. (Duhme and Hinckley 1992). The magnitude of osmotic adjustment found for citrumelo (0.34 MPa) agrees with previous reports for tree crops (Jones et al. 1985) and herbaceous crops (Morgan 1984), and the magnitude of adjust-ment found for olive (1.4 MPa) was comparable to the seasonal
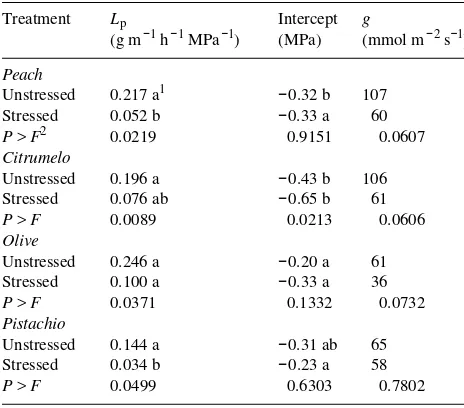
Table 1. Root hydraulic conductivity (Lp), the minimum water
poten-tial required for flow (intercept), and leaf conductance (g) for pre-viously drought-stressed and nonstressed ‘Swingle’ citrumelo, ‘Nemaguard’ peach, ‘Manzanillo’ olive and Pistacia integerrima seed-lings following a 25- to 45-day drought period. All measurements were made 12 to 24 h after rewatering drought-stressed plants.
Treatment Lp Intercept g
(g m−1 h−1 MPa−1) (MPa) (mmol m−2 s−1)
Peach
Unstressed 0.217 a1 −0.32 b 107 Stressed 0.052 b −0.33 a 60 P > F2 0.0219 0.9151 0.0607 Citrumelo
Unstressed 0.196 a −0.43 b 106 Stressed 0.076 ab −0.65 b 61 P > F 0.0089 0.0213 0.0606 Olive
Unstressed 0.246 a −0.20 a 61 Stressed 0.100 a −0.33 a 36 P > F 0.0371 0.1332 0.0732 Pistachio
Unstressed 0.144 a −0.31 ab 65 Stressed 0.034 b −0.23 a 58 P > F 0.0499 0.6303 0.7802
1 Means followed by the same letter are not significantly different
from those of other species within a stress treatment; Duncan’s multiple range test, 5% level.
2 Significance of the comparison of means between stress treatments
within a species.
Table 2. Osmotic potential at full hydration (Ψπ,o) of mature and expanding leaves of drought-stressed and nonstressed ‘Swingle’ citru-melo, ‘Nemaguard’ peach, ‘Manzanillo’ olive and Pistacia integer-rima seedlings 33 days after imposing drought-stress treatments.
Leaf type Treatment Ψπ,o (MPa) Significance1
Peach
Mature Unstressed −2.95 0.6399 Stressed −2.86
Expanding Unstressed −2.72 0.0639 Stressed −2.33
Citrumelo
Mature Unstressed −1.50 0.0034 Stressed −1.84
Expanding Unstressed −1.95 0.3972 Stressed −2.11
Olive
Mature Unstressed −3.46
--Stressed
--Expanding Unstressed −2.82 0.0067 Stressed −4.25
Pistachio
Mature Unstressed −2.71 0.3126 Stressed −2.41
Expanding Unstressed −2.78 0.1826 Stressed −3.02
1 Probability of a greater F value for the comparison of means
change in Ψπ,o reported by Duhme and Hinckley (1992).
A relative ranking of sensitivity to drought stress among the three parameters measured in this study arises from the data. In all species, Lp was reduced, yet Ψπ,o was reduced in only two
of the four species, and g (post-stress) was not significantly reduced for any species. If the changes in g were significant, the percent reductions would rank 60--76% for Lp, 23--50% for
Ψπ,o, and 11--44% for g. This is important in the subsequent
analysis because a decrease in Lp would be expected if osmotic
adjustment occurred in response to drought.
Analysis of offsetting effects of reduced Lp and osmotic
adjustment
Turgor pressures calculated by the model were sensitive to εmax
(data not shown). For example, a 50% reduction in εmax yielded
a 97% reduction in Ψ at the turgor loss point. In contrast, the model was relatively insensitive to changes in β and apoplastic water content (50% change in these parameters produced < 2% change in Ψ at the turgor loss point). As εmax was not measured
in this study, the quantities presented here are realistic only if there is close agreement between the assumed and actual εmax
values; however, the qualitative nature of the relationships described below was conserved at all values of εmax.
The output from the PV curve model compared favorably to published pressure--volume data. Values of Ψπ,o and Ψπ at the
turgor loss point for olive growing in Beskonak, Turkey, were
−2.98 and −3.57 MPa, respectively (Hinckley et al. 1980); the corresponding values from the model were −2.8 and −3.66 MPa, respectively. Also, data of Hinckley et al. (1980) show the turgor loss point at a RWC of about 77% for olive; the RWC at turgor loss from the model was 80%. Andersen and Brod-beck (1988) published Ψπ,o and Ψπ values at the turgor loss
point of −2.1 and −2.7 MPa, respectively, for expanded peach leaves, and −1.7 and −2.0 MPa, respectively, for expanding peach leaves. Using their Ψπ,o data, the model predicted a Ψπ
value at turgor loss of −2.74 MPa (1.5% error) for expanded peach leaves, and −2.14 MPa (7.0% error) for expanding peach leaves. Abrams (1988) compiled Ψπ,o and Ψπ values at the
turgor loss point from 37 North American tree species. Using his values of Ψπ,o for seven broad-leaved trees as input, the
model predicted the corresponding Ψπ at the turgor loss point with an average error of 11%.
The offsetting effects of decreased Lp and osmotic
adjust-ment are illustrated using data for citrumelo and olive (Fig-ures 1 and 2). The relationships in Fig(Fig-ures 1 and 2 do not extend to 0 MPa along the x-axis because both species have nonzero intercepts (Table 1), i.e., zero flow occurred at nonzero water potentials. For citrumelo, when water flow is the same for stressed and nonstressed plants, drought-stressed plants maintained higher Ψp than nonstressed plants
at Ψs values from −0.65 to ≈ −0.9 MPa (following line for
relative flow = 1.0 in Figure 1). At Ψs < −0.9 MPa,
drought-stressed plants would have lower Ψp than nonstressed plants,
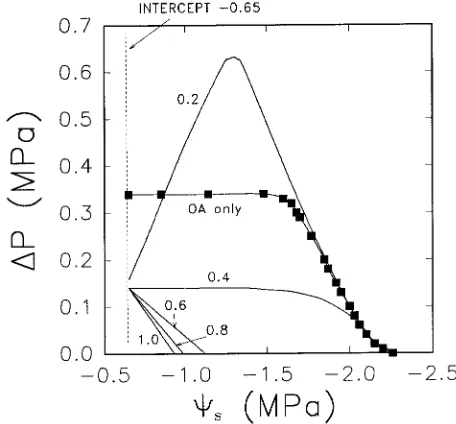
Figure 2. Relationships between ∆Ψp and Ψs for olive. The line
labeled ‘‘OA only’’ (osmotic adjustment only) shows the relationship when Ψ of drought-stressed and nonstressed leaves is the same, and Lp and intercept are not reduced in stressed plants, i.e., the effect of
osmotic adjustment alone. Line labels 1.0 through 0.2 indicate the relative flow rate of water in drought-stressed plants versus non-stressed plants (Jv,s/Jv,n); this simulates the effect of stomatal closure.
The ‘‘intercept’’ (indicated by the dotted vertical line) is the maximum water potential that previously stressed olive plants achieved when flow was zero and the soil was saturated with water.
Figure 1. The difference in turgor pressure (∆Ψp) between previously
drought-stressed and nonstressed leaves of citrumelo plotted as a function of water potential of previously drought-stressed leaves (Ψs).
The line labeled ‘‘OA only’’ (osmotic adjustment only) shows the relationship when Ψ of drought-stressed and nonstressed leaves is the same, and Lp and intercept are not reduced in stressed plants, i.e., the
effect of osmotic adjustment alone. Line labels 1.0 through 0.2 indi-cate the relative flow rate of water in drought-stressed plants versus nonstressed plants (Jv,s/Jv,n); this simulates the effect of stomatal
because the decrease in Lp would more than offset the decrease
in Ψπ,o in terms of turgor maintenance. As flow is reduced by
stomatal closure (relative flows of 0.8 to 0.2), the range of Ψs
over which a turgor advantage is maintained in drought-stressed plants increases, such that when ∆Ψp = 0, Ψs is moved
progressively toward the turgor loss point of Ψs = −2.3 MPa.
The line marked ‘‘OA only’’ in Figure 1 illustrates the effect of osmotic adjustment on ∆Ψp without a change in Lp or
intercept. Along this line, the Ψ values of drought-stressed and nonstressed plants are equal, and osmotic adjustment confers a turgor advantage at all Ψs values down to the turgor loss
point. The difference between the ‘‘OA only’’ line and lines representing relative flows of 1.0, 0.8, 0.6 or 0.4 at any given Ψs therefore represents the offsetting effect of reduced Lp and
intercept on osmotic adjustment. When relative flow in drought-stressed plants is reduced to 20% of that in non-stressed plants, the turgor advantage produced by osmotic adjustment increases above the ‘‘OA only’’ line. This results from the combined effects of two turgor-maintaining processes (stomatal closure and osmotic adjustment) over-compensating for the turgor-reducing effect of low Lp. Hence, ∆Ψp is greater
than would be predicted from inspection of the change in Ψπ,o
when the relative flow falls below about 0.4.
The analysis suggests that partial stomatal closure must accompany osmotic adjustment if a turgor advantage is to be maintained in drought-stressed citrumelo plants through their reported diurnal range of Ψ (0 to −1.5 MPa, Syvertsen et al. 1981). Because flow would have to be reduced by 40 to 60% in drought-stressed plants to allow Ψ to reach −1.5 MPa (Figure 1), a reduction in CO2 assimilation may also be
ex-pected. The reduction in g of ≈ 40% due to drought stress, although not statistically significant (P > 0.05) for citrumelo (Table 1), would not have reduced flow to the extent necessary to allow ∆Ψp to remain positive at all expected values of Ψs.
In olive, the response of ∆Ψp to Ψs was similar to that of
citrumelo (Figure 2). However, in the absence of stomatal closure, the large decrease in Ψπ,o would offset the 2.5-fold
decline in Lp at all Ψs values above ≈−3.0 MPa (see Figure 2
where relative flow = 1.0). Thus, unlike citrumelo, the turgor advantage due to osmotic adjustment would likely be main-tained in olive throughout the diurnal range of Ψ (−0.6 to−2.0 MPa, Larsen et al. 1989). However, this magnitude of osmotic adjustment (1.4 MPa) is uncharacteristically high for tree spe-cies and serves to illustrate an extreme rather than a typical case.
One factor not considered in this analysis is reduced axial conductance in the xylem due to cavitation and embolism during moderate drought stress (Tyree and Sperry 1988). The assumption was made that whole-plant hydraulic conductivity, L, was equal to Lp, when in reality, L also includes stem
conductivity. A reduction in stem conductivity would reduce the turgor advantage due to osmotic adjustment even more than predicted here. Therefore, the amount of stomatal closure required to counter-balance the reduction in plant conductivity would be greater than that shown in Figures 1 and 2.
I conclude that the turgor advantage conferred by osmotic adjustment is reduced by decreased Lp following drought
stress. Because Lp is more sensitive to drought than Ψπ,o, the
effect of osmotic adjustment on turgor maintenance is less than that estimated from pressure--volume analyses alone. The adaptive value of osmotic adjustment has also been questioned by others (see Munns 1988), because evidence suggests that growth must decrease for osmotic adjustment to occur. Al-though Ψp drives cell expansion and growth, cell wall
proper-ties such as yield threshold and extensibility may change in response to drought to negate an increase in Ψp (Van
Volken-burgh and Cleland 1984). Thus, the translation of osmotic adjustment into increased growth or physiological function is at best limited by Lp reduction, and at worst unobtainable as a
result of reduced Lp combined with other negative impacts of
drought stress.
References
Abdel-Rahman, A.A. and H.M. El-Sharkawi. 1974. Response of olive and almond orchards to partial irrigation under dry-farming prac-tices in semi-arid regions. II. Plant--soil water relations in olive during the growing season. Plant Soil 41:13--31.
Abrams, M.D. 1988. Sources of variation in osmotic potentials with special reference to North American tree species. For. Sci. 34:1030--1046.
Andersen, P.C. and B.V. Brodbeck. 1988. Water relations and net CO2 assimilation of peach leaves of different ages. J. Am. Soc. Hortic. Sci. 113:242--248.
Chandler, W.H. 1950. Evergreen orchards. Lea and Febiger, Philadel-phia, pp 128--129.
Cheung, Y.N.S., M.T. Tyree and J. Dainty. 1976. Some possible sources of error in determining bulk elastic moduli and other pa-rameters from pressure--volume curves of shoots and leaves. Can. J. Bot. 54:758--765.
Cosgrove, D. 1984. Hydraulic aspects of plant growth. What’s New in Plant Physiol. 15:5--8.
Duhme, F. and T.M. Hinckley. 1992. Daily and seasonal variation in water relations of macchia shrubs and trees in France (Montpellier) and Turkey (Antalya). Vegetatio 99:185--198.
Duke, J.A. 1989. CRC Handbook of nuts. CRC Press, Boca Raton, FL, pp 241--242.
Fereres, E., G. Cruz-Romero, G.J. Hoffman and S.L. Rawlins. 1979. Recovery of orange trees following severe water stress. J. Appl. Ecol. 16:833--842.
Hardegree, S.P. 1989. Derivation of plant cell wall water content by examination of water-holding capacity of membrane-disrupted tis-sues. J. Exp. Bot. 40:1099--1104.
Hinckley, T.M., F. Duhme, A.R. Hinckley and H. Richter. 1980. Water relations of drought hardy shrubs: osmotic potential and stomatal reactivity. Plant Cell Environ. 3:131--140.
Jones, H.G., A.N. Lakso and J.P. Syvertsen. 1985. Physiological con-trol of water status in temperate and subtropical fruit trees. Hortic. Rev. 7:301--344.
Kramer, P.J. 1983. Water relations of plants. Academic Press, New York, 203 p.
Larsen, F.E., S.S. Higgins and A. Al Wir. 1989. Diurnal water relations of apple, apricot, grape, olive and peach in an arid environment (Jordan). Sci. Hortic. 39:211--222.
Morgan, J.M. 1984. Osmoregulation and water stress in higher plants. Annu. Rev. Plant Physiol. 35:299--319.
Nobel, P.S. and B. Huang. 1992. Hydraulic and structural changes for lateral roots of two desert succulents in response to soil drying and rewetting. Int. J. Plant Sci. 153S:163--170.
Passioura, J.B. and R. Munns. 1984. Hydraulic resistance in plants. II. Effects of rooting medium and time of day in barley and lupin. Aust. J. Plant Physiol. 11:341--350.
Proebsting, E.L. and J.E. Middleton. 1980. The behavior of peach and pear trees under extreme drought stress. J. Am. Soc. Hortic. Sci. 105:380--385.
Rieger, M. 1992. Growth, gas exchange, water uptake, and drought response of seedling- and cutting-propagated peach and citrus root-stocks. J. Am. Soc. Hortic. Sci. 117:834--840.
Rieger, M. 1989. Pressure- and transpiration-induced flow methods for estimating hydraulic resistance in peach. HortScience 24:648--650.
Rieger, M. and M.J. Duemmel. 1992. Comparison of drought resis-tance among Prunus species from divergent habitats. Tree Physiol. 11:369--380.
Rieger, M. and A. Motisi. 1990. Estimation of root hydraulic conduc-tivity on intact peach and citrus rootstocks. HortScience 25:1631--1634.
Roberts, S.W., B.R. Strain and K.R. Knoerr. 1981. Seasonal variation of leaf tissue elasticity in four forest tree species. Physiol. Plant. 52:245--250.
Romano, E. 1977. Water--plant relationships in the olive tree. In Modern Olive Growing. Food and Agriculture Organization of the United Nations, Rome, Italy, pp 115--123.
Santakumari, M. and G.A. Berkowitz. 1989. Protoplast volume--water potential relationship and bound water fraction in spinach leaves. Plant Physiol. 91:13--18.
Syvertsen, J.P., M.L. Smith Jr. and J.C. Allen. 1981. Growth rate and water relations of citrus leaf flushes. Ann. Bot. 47:97--105. Tan, C.S. and B.R. Buttery. 1982. The effect of soil moisture stress to
various fractions of the root system on transpiration, photosynthe-sis, and internal water relations of peach seedlings. J. Am. Soc. Hortic. Sci. 107:845--849.
Tennant, D. 1975. A test of a modified line intersect method of estimating root length. J. Ecol. 63:995--1001.
Tyree, M.T. and J.S. Sperry. 1988. Do woody plants operate near the point of catastrophic xylem dysfunction caused by dynamic water stress? Plant Physiol. 88:574--580.
Van Volkenburgh, E. and R.E. Cleland. 1984. Control of leaf growth by changes in cell wall properties. What’s New in Plant Physiol. 15:25--28.