Summary Xylem sap flow and environmental variables were measured on seven consecutive midsummer days in a 130-year-old Larix gmelinii (Rupr.) Rupr. forest located 160 km south of Yakutsk in eastern Siberia, Russia (61° N, 128° E, 300 m asl). The site received 20 mm of rainfall during the 4 days before measurements, and soil samples indicated that the trees were well watered. The tree canopy was sparse with a one-sided leaf area index of 1.5 and a tree density of 1760 ha−1. On a clear day when air temperature ranged from 9 to 29 °C, and maxi-mum air saturation deficit was 3.4 kPa, daily xylem sap flux (F) among 13 trees varied by an order of magnitude from 7 l day−1 for subcanopy trees (representing 55% of trees in the forest) to 67 l day−1 for emergent trees (representing 18% of trees in the forest). However, when based on xylem sap flux density (F′), calculated by dividing F by projected tree crown area (a surrogate for the occupied ground area), there was only a fourfold range in variability among the 13 trees, from 1.0 to 4.4 mm day−1. The calculation of F′ also eliminated systematic and large differences in F among emergent, canopy and sub-canopy trees. Stand-level F′, estimated by combining half-hourly linear relationships between F and stem cross-sectional area with tree size distribution data, ranged between 1.8 ± 0.4 (standard deviation) and 2.3 ± 0.6 mm day−1. These stand-level F′ values are about 0.6--0.7 mm day−1 (30%) larger than daily tree canopy transpiration rates calculated from forest energy balance and understory evaporation measurements.
Maximum total tree conductance for water vapor transfer (Gtmax , including canopy and aerodynamic conductances), cal-culated from the ratio of F′ and the above-canopy air saturation deficit (D) for the eight trees with continuous data sets, was 9.9 ± 2.8 mm s−1. This is equivalent to a leaf-scale maximum stomatal conductance (gsmax ) of 6.1 mm s−1, when expressed on a one-sided leaf area basis, which is comparable to the published porometer data for Larix. Diurnal variation in total tree conductance (Gt) was related to changes in the
above-can-opy visible irradiance (Q) and D. A saturating upper-boundary function for the relationship between Gt and Q was defined as Gt = Gtmax (Q/[Q + Q50]), where Q50 = 164 ± 85 µmol m−2 s−1 when Gt = Gtmax /2. Accounting for Q by excluding data for Q < Q85 when Gt was at least 85% of Gtmax , the upper limit for the relationship between Gt and D was determined based on the function Gt = (a + blnD)2, where a and b are regression coefficients. The relationship between Gt and D was curvilin-ear, indicating that there was a proportional decrease in Gt with increasing D such that F was relatively constant throughout much of the day, even when D ranged between about 2 and 4 kPa, which may be interpreted as an adaption of the species to its continental climate. However, at given values of Q and D, Gt was generally higher in the morning than in the afternoon. The additional environmental constraints on Gt imposed by leaf nitrogen nutrition and afternoon water stress are discussed. Keywords: boreal forest, larch, stomatal conductance, transpi-ration.
Introduction
The eastern Siberian taiga is dominated by Larix gmelinii (Rupr.) Rupr. with a forested area of 1 × 10⁶ km2 (Shridenko and Nilssen 1994). The species forms pure stands regenerated by recurrent fire (Schulze et al. 1995). A common habitat feature of Larix is an extremely cold winter when physiologi-cal activity ceases (Gower and Richards 1990). The trees thus complete needle development, growth, flowering and seed development during relatively short summers. During the ap-proximately 90-day snow-free growing season, average rain-fall is only 110 mm. This is about half the annual precipitation of 210 mm, whereas the corresponding potential evaporation rate is 370 mm (Müller 1982), indicating that there must be severe environmental regulation of the forest evaporation rate.
Environmental regulation of xylem sap flow and total conductance of
Larix gmelinii trees in eastern Siberia
A. ARNETH,
1,2F. M. KELLIHER,
3G. BAUER,
1D. Y. HOLLINGER,
3,4J. N. BYERS,
3J. E. HUNT,
3T. M. M
CSEVENY,
3W. ZIEGLER,
5N. N. VYGODSKAYA,
6I. MILUKOVA,
6A. SOGACHOV,
6A. VARLAGIN
6and E.-D. SCHULZE
11
Universität Bayreuth, Lehrstuhl für Pflanzenökologie, Box 101251, 95440 Bayreuth, Germany 2
Present address: Lincoln University, Department of Soil Science, P.O. Box 84, Lincoln, New Zealand 3
Manaaki Whenua----Landcare Research, P.O. Box 69, Lincoln, New Zealand 4
Present address: U.S. Forest Service, P.O. Box 640, Durham, NH 03284, USA 5
Comenius University, Department of Biophysical and Chemical Physics, Mlynska Dolina F1, CS-842 15, Bratislava, Slovak Republic 6
V.N. Sukachov Laboratory of Biogeocenology, Russian Academy of Sciences, Leninsky Prospect 33, 117071 Moscow, Russia
Received March 28, 1995
However, despite the possible influence of this ecosystem’s energy balance on the regional and global climate (Shukla and Mintz 1982), we are not aware of any published research about Larix forest evaporation.
The objective of this paper was to examine the effects of environmental variables on xylem sap flow of L. gmelinii during a 7-day period in midsummer. We calculated total tree conductances for water vapor transfer (Gt) from xylem sap flux density and above-canopy air saturation deficit measurements, and developed a multiplicative environmental constraint Gt model for diagnosis, rather than strictly for prognosis (Granier and Loustau 1994). Adaptation of L. gmelinii to its continental climate is discussed.
Materials and methods
Site description
Measurements were made in a 130-year-old L. gmelinii forest located 160 km south of Yakutsk in the extreme continental part of eastern Siberia, Russia (61° N, 128° E, 300 m asl). Characteristics of the vegetation were determined by measure-ment and destructive sampling in a representative 0.5-ha plot (Schulze et al. 1995). Average tree height was 12 m, although some canopy emergents were nearly 20 m tall, average stem diameter was 110 mm, stand density was 1760 ha−1, and one-sided leaf area index was 1.5 (Schulze et al. 1995). The evergreen, broad-leaved understory vegetation was about 0.05 m tall with a one-sided leaf area index of 1.0. Understory plant species included Arctostaphlos uva ursi, Vaccinium vitis idaea and V. uliginosum.
According to the USDA taxonomic classification, the soil was an inceptisol known as Pergelic Cryochrept. There was a 30-mm deep leaf litter horizon, and the top 50-mm deep
mineral soil horizon was enriched with humus (carbon content = 10%). The texture of the underlying soil horizons was silt loam. Because of underlying permafrost, the soil temperature at a depth of 700 mm was only 1--2 °C. Soil water release measurements were made in the laboratory on undisturbed cores. Roots were generally confined to the upper 300 mm that had an available soil water storage capacity of about 45 mm.
Xylem sap flow measurements
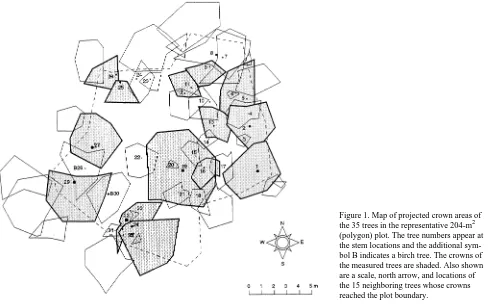
Xylem sap flow was measured at a height of 1.5 m in 13 trees on a second 204-m2 plot (Table 1). The plot was a polygon determined by connecting bisects of outer plot trees and their nearest neighboring trees outside the plot (Figure 1). Twenty small L. gmelinii and two Betula platyphyllos Sukachev trees were present in the polygon plot (Table 2). There was about twice as many large (> 160 mm diameter) trees on the polygon plot (23% of total) than on the representative 0.5-ha plot.
Mass flow rate of water through the xylem of trees (xylem sap flux, kg s−1, Fi) was estimated from half-hourly steady-state energy balances of undisturbed sapwood (to a depth of 50 mm) heated by electrodes to a constant 2 K (Th) above the temperature of unheated sapwood (Tu) (UP Umweltanalytis-che Produkte, Munich, Germany), located at the same height but 0.2 m away, as:
Fi=
kiPi
cw(Th−Tu)
, (1)
where Pi is the power input to tree i (W, for an average time of 30 min), cw is the specific heat of water, and ki = Ci /[d(e − 1)] with Ci, d and e being stem circumference of tree i, distance between electrodes and number of electrodes, respectively (Èermák et al. 1973, Pearcy et al. 1989). Power input is the difference between power supplied to the stem and losses
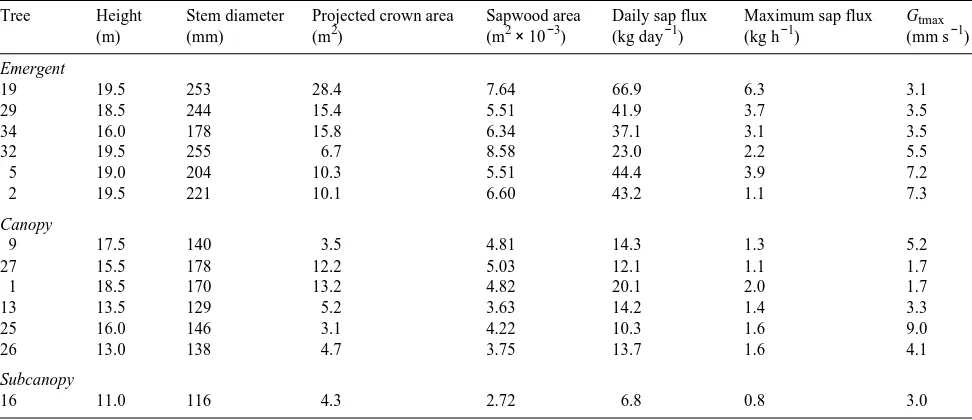
Table 1. Some dimensional characteristics of 13 Larix gmelinii trees, and their associated xylem sap fluxes and maximum total tree conductances (Gtmax ) on July 26, 1993, a clear summer day in eastern Siberia. Xylem sap flux densities may be calculated by dividing xylem sap fluxes by projected crown area or sapwood area. Tree social position is indicated by the canopy emergence class as emergent, canopy and subcanopy.
Tree Height Stem diameter Projected crown area Sapwood area Daily sap flux Maximum sap flux Gtmax
caused by convection by xylem sap flow and also by conduc-tion and radial heat loss to the surrounding air.
Conduction and radial heat losses were constant because of the constant heated--unheated temperature difference, and were equal to the minimum power input obtained during dark-ness. Forest evaporation, determined from micrometeorologi-cal measurements, was zero during the night (Kelliher et al. 1994). Heat losses, which were determined each night for every tree, were generally constant for each tree throughout the 2--5-day measurement period (see below). For a 1-m vertical band centered at the height of instrumentation, the stems of measured trees were surrounded by 200-mm thick fiberglass insulation and covered with aluminized mylar sheeting. The electrodes were inserted on branchless stem sections at about 1.5 m, facing west, north or east. This arrangement avoided possible sap flow irregularities caused by branches and direct sun exposure during most of the day.
Within 2 to 5 days after installation of a sap flow measure-ment system, resin production increased the resistance
be-tween electrodes such that we could not generate enough power to maintain (Th − Tu) = 2 K. Consequently, measurement systems were regularly shifted throughout the study. The num-ber of trees measured varied between 7 and 13.
Comparison of sap flow for trees differing in size requires normalization on an area basis (sap flux density, F′, kg m−2 s−1). We used a vertical projection of the crown perimeter for each tree, determined from anascope measurements (Figure 1), as an estimate of the tree’s occupied ground area. For compari-son with tree canopy evaporation, we estimated F′ for the polygon plot based on the tree size distribution data and the half-hourly relations between Fi and stem cross-sectional area. The relations were linear and passed through the origin with coefficients of determination (r2) ranging from 0.40 in the early morning before sap flow had started in all trees to 0.75 during the rest of the day.
Plot level F′ estimates were scrutinized by comparison with tree canopy transpiration rates (Et) determined from a combi-nation of energy balance and understory evaporation rate (Eu) Figure 1. Map of projected crown areas of the 35 trees in the representative 204-m2 (polygon) plot. The tree numbers appear at the stem locations and the additional sym-bol B indicates a birch tree. The crowns of the measured trees are shaded. Also shown are a scale, north arrow, and locations of the 15 neighboring trees whose crowns reached the plot boundary.
Table 2. Some average (± standard deviation) dimensional characteristics of the 33 Larix gmelinii trees in a representative 204-m2 plot in eastern Siberia. Tree social position refers to the canopy emergence class as emergent, canopy and subcanopy.
Social position Number of trees Height Stem area Projected crown area Crown depth
(m) (m2× 10−2) (m2) (m)
Emergent 6 18.2 ± 1.4 4.03 ± 1.03 14.5 ± 9.7 7.7 ± 2.9
Canopy 9 14.6 ± 3.2 1.59 ± 0.51 6.9 ± 6.2 5.0 ± 2.2
measurements described by Kelliher et al. (1994). Briefly, Et was estimated as (Ra − H − Eu), where Ra is the available energy, and H is the sensible heat flux density. We determined Ra from measurements of the above-canopy net radiation and ground heat flux after Kelliher et al. (1992). We measured H with a three-dimensional sonic anemometer. Five lysimeters, thin-walled plastic sleeves (370 × 370 × 150 mm deep) encasing undisturbed understory vegetation--forest-floor--soil cores, were weighed at 2-h intervals to determine Eu.
Estimating total tree conductance for water vapor transfer
Total tree conductance for water vapor transfer (Gt) was esti-mated from the ratio of F′i and air saturation deficit (D), measured above the forest at a height of 22.5 m with an ultraviolet absorption hygrometer (Model KH2O, Campbell Scientific, Logan, UT). When F′i and D are expressed in units of mm h−1 and kPa, respectively, Gt = k(F′i/D), where k is a weakly temperature-dependent conversion factor (= 38 at 20 °C; Köstner et al. 1992). The conductance Gt includes stomatal, leaf boundary layer (gb) and eddy diffusive aerody-namic (gaM ) conductance components because we are account-ing for conductances from the average height of stomata in the tree canopy to the height of a D measurement made above the forest (Thom 1972). The sonic anemometer measurements indicated gaM = 0.1u, where u is the wind speed above the canopy (Jarvis et al. 1976). Daytime wind speeds during the measurement period were generally low, between 1 and 2 m s−1, so gaM = 0.1--0.2 m s−1. We set gb = 0.17 m s−1, an average for several coniferous species given by Jarvis et al. (1976). For the tree canopy, we multiplied by the leaf area index to esti-mate an average gb = 0.26 m s−1. The series sum of gaM and gb is therefore at least 10 to 20 times larger than Gt. Consequently, Gt closely resembles the tree’s canopy conductance (Köstner et al. 1992).
We examined the optimal response of Gt to above-canopy visible irradiance (Q, measured with a calibrated galium-arsenide photodiode) and D by a combination of boundary-line analysis (e.g., Livingston and Black 1987) and a multiplicative constraint-function model (e.g., Granier and Loustau 1994). We first fitted a hyperbolic saturating function to the upper boundary of a plot of Gt and Q as Gt = Gtmax (Q/[Q + Q50]), where Q50 is the value of Q when Gt = Gtmax /2. We then examined the upper limit of the decrease in Gt with increasing D under nonirradiance-limiting conditions (Q > 85% of the saturating value) as Gt = (a + blnD)2, where a and b are regression coefficients.
We did not include the effects of soil water deficit in our Gt model. However, the site had 20 mm of rain in the 4 days preceding the study, and gravimetric forest floor and soil samples, which were collected daily to a depth of 700 mm, indicated that the trees were well watered throughout the study.
Results and discussion
Xylem sap flow rate
On a clear day (July 26, 1993) when air temperature ranged from 9 to 29 °C, and maximum air saturation deficit was
3.4 kPa, daily xylem sap flux (F) among 13 measured trees varied by an order of magnitude from 7 to 67 l day−1 (Table 1). The lowest value of F was for an 11-m tall subcanopy tree that was representative of 55% of the trees in the forest in terms of size, based on an inventory of 875 L. gmelinii trees in the 0.5-ha plot (data not shown). The highest daily xylem sap flux was for a 20-m tall emergent tree representing 18% of the plot trees. For emergent, canopy and subcanopy trees, respectively, average values of F could be normalized with respect to emer-gent tree values as 1.00, 0.33 and 0.16.
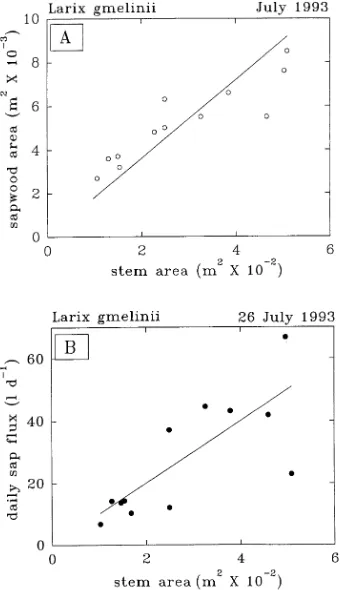
There was, however, substantial variation in the daily xylem sap flux and dimensional characteristics of trees within each of the three canopy emergence classes (Tables 1 and 2). Adopting a pipe model of xylem sap flow (Shinozaki et al. 1964) and assuming a constant depth of physiologically active sapwood, because of the generally small ring of sapwood (Table 1) and the adequate root water supply during measurements, we found a statistically significant linear relation between stem area and sapwood area (r2 = 0.4, Figure 2A), and between stem area and daily F (r2 = 0.6, Figure 2B). The slope was inter-preted to indicate the stem growth requirement for water trans-port (Köstner et al. 1992). Stem area increased by about 0.001 m2 for each additional liter of water transpired per day during the summer growing season.
When F was converted to xylem sap flux density (F′),
obtained by dividing F by projected tree crown area, there was only a fourfold range in variability among the 13 trees, from 1.0 to 4.4 mm day−1 (Figure 3, Table 1). Variation in F′ appeared to be normally distributed with a median (2.7 mm day−1) nearly equal to the mean (2.9 mm day−1) and a standard deviation (1.1 mm day−1) equivalent to about one third of the range. Conversion to F′ also significantly decreased the sys-tematic and large differences in F among emergent, canopy and subcanopy trees. Average values of F′ for the three canopy emergence classes were normalized as 1.00, 0.80 and 0.52, respectively.
Comparable F and F′ measurements were made in eight Picea abies (L.) Karst. trees in a Danish plantation (K. Schelde, 1995, personal communication). For these approxi-mately 20-m tall trees, F ranged from 11 to 37 l day−1 on a clear summer day. Calculation of F′, based on an estimation of projected crown area, reduced the variability to 1--1.8 mm day−1.
Measurements of F and calculations of F′ were also made for 14 representative trees in a vertically structured 36-m tall, natural broad-leaved forest with a leaf area index of 7 located near Maruia, New Zealand (Kelliher et al. 1992, Köstner et al.
1992). On a clear late-summer day, F′ ranged from 0.1 to 1.4 mm day−1. Approximately 50% of daily stand transpiration emanated from emergent trees representing only 3--4% of the tree population. Variation in F′ was not normally distributed in horizontal space because F′ depended on the location and size of neighboring trees. The low variability of F′ in our study probably reflects the relatively simple tree canopy architecture and low leaf area index in eastern Siberia.
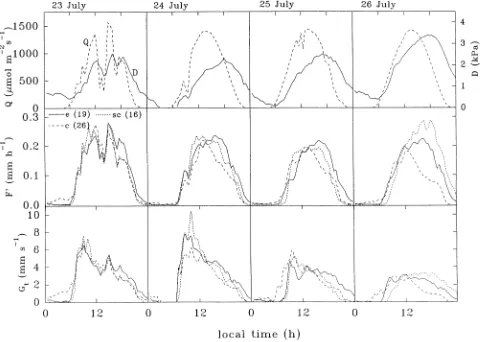
Xylem sap flow began at about 0600 h local time or approxi-mately 1 h after sunrise with little difference in the timing among trees of differing size or canopy emergence class (Fig-ure 3). On clear days, F′ varied sinusoidally reaching a broad 4-h long maximal plateau between the times of maximum irradiance and air saturation deficit. Although the magnitude of this plateau varied among trees of different sizes and some-times among canopy emergence classes (Table 1), a remark-ably similar diurnal variation in F′ occurred for all trees. However, F′ for a given irradiance or air saturation deficit, or combination of the two, was different in the morning and afternoon (Figure 4). These hystereses and the accompanying implications for modeling F′ are discussed in the next section. Nevertheless, there was a close correspondence between
changes in irradiance, air saturation deficit and xylem sap flow following the passage of a cloud at midday on July 23 (Fig-ure 3). There was less consistency in the time of xylem sap flow cessation which occurred between 2200 and 0100 h local time or up to 2 h after sunset. Although this might suggest some xylem refilling from stem water reservoirs, we believe that this would be incorrect because of the small sapwood thickness of 10 mm (Schulze et al. 1995). Xylem sap flow rates were generally negligible (< 0.1 l h−1) during hours of darkness.
Daily flux densities on the 204-m2 polygon plot
Daily plot-level F′ ranged from 1.8 ± 0.4 to 2.3 ± 0.6 mm day−1 (Table 3). These values were generally 0.6--0.7 mm day−1 (about 30%) larger than the energy balance and understory lysimeter estimates of tree canopy transpiration rate. However, ignoring sap flow from trees of stem area < 0.01 m2 (Figure 2), comprising 60% of the plot tree population (15% of the plot stem area), yielded daily F′ values only 5--10% larger than the Et values. Values from this second F′ calculation thus fell within the bounds of our sap flux/stem area data. This much better agreement with independent measurements of tree can-opy transpiration rate suggests that there may be a different relation between sap flux and stem area for the smallest trees in the plot.
Nevertheless, given the 10--20% coefficients of variation for F′ values and the likelihood of similar errors associated with (Ra − H − Eu) calculations, the differences between the two estimates of tree canopy transpiration rates are probably not statistically significant. Even so, it is clear that scaling up tree measurements and combining a series of micrometeorological and lysimeter measurements can be associated with some uncertainty. This may be especially important for the estima-tion of tree transpiraestima-tion rates for an entire growing season based on data obtained during intensive, short-term measure-ments.
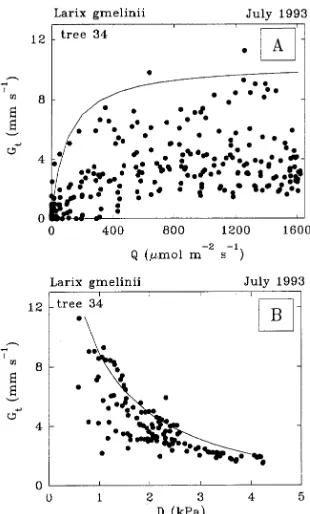
Figure 4. Daytime measurements of half-hourly xylem sap flux den-sity and above-canopy visible irradiance (Q, panel A) and air satura-tion deficit (D, panel B) for emergent Tree 19 on July 24, 1993, a clear summer day in eastern Siberia. Two data points are labeled with the local time of day (hour).
Table 3. Daily sap flux density of Larix gmelinii trees in a 204-m2 plot (F′) and estimates of tree canopy transpiration rate (Et) calculated from the difference between the available energy (Ra), sensible heat flux (H) and understory evaporation rate (Eu) (Et = Ra− H − Eu) on six clear summer days in eastern Siberia. All terms are expressed as water depth equivalents ± standard deviation.
July Ra Eu H Et F′
(mm day−1) (mm day−1) (mm day−1) (mm day−1)
21 6.1 1.1 ± 0.1 3.1 1.9± 0.10 2.1 ± 0.23
22 4.4 1.0 ± 0.1 2.0 1.4± 0.10 2.0 ± 0.20
23 4.2 1.0 ± 0.2 2.1 1.1± 0.20 2.3 ± 0.56
24 5.9 1.0 ± 0.3 3.3 1.6± 0.30 2.2 ± 0.44
25 5.4 1.0 ± 0.2 3.2 1.2± 0.20 1.8 ± 0.38
26 5.0 0.6 ± 0.1 2.9 1.5± 0.10 2.2 ± 0.43
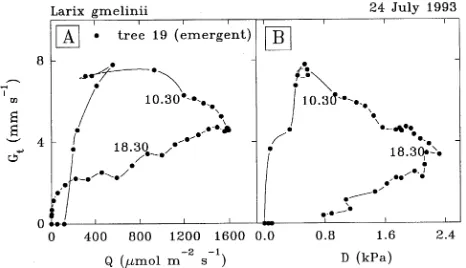
Table 4. Tree-dependent factors, describing the boundary function for the relationship between total conductance (Gt) and visible irradiance (Q): maximum total conductance (Gtmax ), Q when Gt was 50% of Gtmax (Q50) and 85% of Gtmax (Q85), and the coefficients a and b for the boundary function between Gt and air saturation deficit (D). Further explanation of the measurements and calculations is given in the text.
Tree July Gtmax Q50 Q85 a b
(mm s−1) (µmol m−2 s−1) (µmol m−2 s−1)
19 23--27 8.5 138 550 2.4 −0.6
32 23--27 10.7 99 550 2.9 −0.6
34 21--27 10.4 97 600 2.9 −1.1
26 21--27 15.6 304 920 3.4 −1.3
16 21--27 10.8 290 850 2.9 −1.1
27 21, 24--27 6.2 99 550 2.4 −0.9
9 23--27 9.9 125 800 3.0 −0.7
13 21, 22, 24--27 7.3 162 750 2.4 −0.4
Total tree conductance for water vapor transfer
The occurrence of maximum total tree conductance (Gtmax ) was generally around 0800--0930 h, at least 3 h after sunrise (Figure 3). Based on the eight trees with continuous data sets, the saturating upper-boundary function was Gt = Gtmax (Q/[Q + Q50]), where Q50 = 164 ± 85 µmol m−2 s−1 when Gt = Gtmax /2
and Gtmax = 9.9 ± 2.8 mm s−1 (Table 4, Figure 5A). Data for Q from 0 to 1400 µmol m−2 s−1 was divided into equal-sized steps, and maximum values of Gt in each step were used to calculate Q50 and Gtmax . The value of Q50 depends on plant species, plant nutrition and irradiance during growth (Kelliher et al. 1995). From comparable coniferous forest studies, Q50 was 25, 170 and 340 mmol m−2 s−1 for Pinus radiata D. Don, P. sylvestris L. and P. pinaster Ait., respectively (Kelliher et al. 1993).
The average value of stomatal conductance (gsmax ) for a tree canopy may be calculated by dividing Gt by the tree’s leaf area index (tree leaf area divided by projected crown area). For the eight trees for which there were continuous data sets, average calculated gsmax was 6.1 ± 3.3 mm s−1. A comparable average value of gsmax = 4.3 ± 1.5 mm s−1 for three other Larix species was derived from published leaf-scale porometer measure-ments (Table 5). The difference between these two averages was not statistically significant.
The gsmax data were further compared with two other esti-mates. First, we determined leaf nitrogen content for four of the 13 trees (emergent Trees 5 and 19, and canopy Trees 25 and 26; see Table 1) used in the xylem sap flow measurements. For these four trees, the average leaf N content was 14.6 ± 0.3 mg g−1 and, on July 26 (Table 1), the corresponding gsmax was 3.2 ± 1.6 mm s−1. This was within 27% of an independent estimate of gsmax = 4.4 mm s−1, calculated from the linear relationship between leaf N content and gsmax of slope 0.3 mm s−1 per mg N g−1 (Schulze et al. 1994). Finally, an average woody species value of gsmax = 5.5 mm s−1 from the comprehensive review of Körner (1994) was within 11% of our value for L. gmelinii.
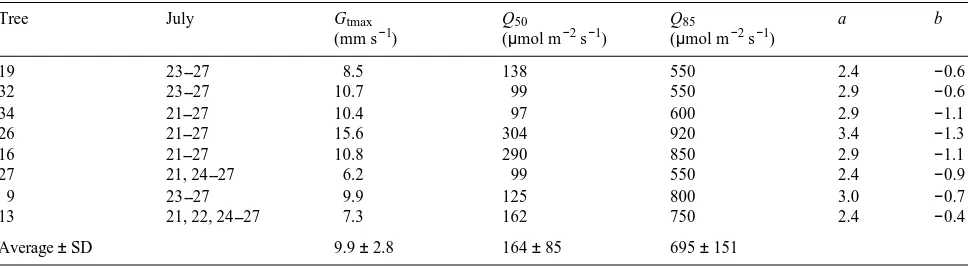
Accounting for Q by excluding data for Q < Q85 when Gt was at least 85% of Gtmax , the decrease in Gt with increasing D was determined using a similar approach as before; namely that the maximum values of Gt within each of 10 equal-sized D steps defined the upper-boundary function (Table 4, Figure 5B). The variability of Gt at low D values was substantial and probably precludes accurate model predictions (e.g., Kelliher et al. 1993, Leuning 1995). The variability in Gt increased signifi-cantly as D decreased below about 2 kPa, as has been observed elsewhere (Granier and Loustau 1994). In Siberia, this may have resulted from variable self-shading of tree crowns early Figure 5. The relationship between half-hourly total tree conductances
for water vapor transfer (Gt) and above-canopy visible irradiance (Q) (panel A) in eastern Siberia for emergent Tree 34 during seven con-secutive summer days, July 21--27, 1993. The line in panel A is fitted by the function Gtmax (Q/[Q + Q50]) for 10 equidistant maximum values, where Gtmax was the maximum value of Gt (10.4 mm s−1) and
Q50 = 97 µmol m−2 s−1 when Gt = Gtmax /2. Panel B shows the relationship between Gt and above-canopy air saturation deficit (D) for nonirradiance-limiting conditions when Q > 600 µmol m−2 s−1 (Q85), and when Gt = 85% of Gtmax in panel A. The line in panel B is fitted by the function Gt = (a + blnD)2 for 10 equidistant maximum values (see Table 4).
Table 5. Maximum stomatal conductances (gsmax , mm s−1, expressed on a one-sided leaf area basis) of four Larix species derived from measurements on field-grown trees. The value for this study is the mean (± standard deviation) obtained by dividing the maximum total conductance per tree in Table 4 by the tree’s leaf area index. Porometer data from the literature were converted from molar units (mmol m−2 s−1), by dividing by 40, and expressed on an all-surfaces leaf area basis by multiplying by 2.5 (the all-surfaces to one-sided leaf area ratio for Larix (Oren et al. 1986)).
Species Location gsmax Source
(mm s−1)
L. gmelinii Eastern Siberia 6.1 ± 3.3 This study
L. decidua Germany 3.6 Benecke et al. (1981)
L. decidua Austria 3.1 Benecke et al. (1981)
L. decidua New Zealand 4.4 Benecke et al. (1981)
L. decidua × leptolepis Germany 3.9 Schulze et al. (1985)
L. laricina Canada 3.5 Dang et al. (1991)
in the day when D tended to be lower. The data below the upper boundary of the Gt versus D curve indicate additional control of Gt by factors other than Q and D. For example, a higher Gt occurred at given values of Q and D in the morning than in the afternoon (Figure 6). Thus there was no recovery of Gt in the afternoon following the peak of D, when D decreased mainly because of decreasing irradiance and, in turn, (forest) surface sensible heat flux. Toward the end of the day, the decrease in Gt was probably mostly in response to decreasing irradiance. The gravimetric soil water measurements suggested an ab-sence of tree water stress at this time. It is a common, but inexplicable, problem for models to overestimate conductance in the afternoon (Lösch and Schulze 1994).
Earlier studies of Larix in Germany (Schulze et al. 1985) and New Zealand (Benecke et al. 1981) showed virtually linear relationships between gs and D. However, there was a much broader range of D in this study. The curvilinear nature of the relationship and the proportional decrease in Gt with increas-ing D meant that sap flow rate was relatively constant over much of the day even when D reached values as high as 4.3 kPa.
Conclusions
Xylem sap flux was extremely variable among the 130-year-old L. gmelinii trees in eastern Siberia during clear summer days. There was a linear relationship between xylem sap flux and stem cross-sectional area suggesting that about 0.001 m2 of stem area was used to transpire each liter of water per day.
Maximum total tree conductance for water vapor transfer was in agreement with data for other Larix species and with an estimate based on leaf nitrogen content. Additionally, func-tional relationships between Gt, Q and D were similar to those of other Larix and coniferous species growing in temperate climates. However, our data set includes values of D up to 4.3 kPa, and there was a substantial decrease in the sensitivity of Gt with D at D > 2 kPa. We conclude that L. gmelinii is able to transpire and, in turn, to assimilate carbon under the extreme
conditions that characterize its short, hot, dry summer growing season.
Acknowledgments
E.-D. Schulze acknowledges support of the German Bundesminister für Ernährung Landwirtschaft und Forsten and the Humboldt Founda-tion (Max-Planck Forschungspreis). The Manaaki Whenua----Land-care Research team was funded by a long-term grant for atmospheric research from the New Zealand Foundation for Research, Science and Technology. A travel grant for the journey from New Zealand to Germany was awarded to D.Y. Hollinger under the New Zealand/Fed-eral Republic of Germany Agreement for Scientific and Technological Cooperation. We also acknowledge the help of Herbert Koch, Kira Kobak, Vela Kuznetsova, Fyodor Tatarinov and Sascha Issajev with measurements. Finally, we express our sincere thanks to Rudolf Me-serth for his tremendous support during the preparation of the meas-urements and Inge Schulze for keeping us supplied with good food during our month living in a Siberian forest.
References
Benecke, U., E.-D. Schulze, R. Matyssek and W.M. Havranek. 1981. Environmental control of CO2-assimilation and leaf conductance in
Larix decidua Mill. Oecologia 50:54--61.
Èermák, J., M. Deml and M. Penka. 1973. A new method of sap-flow rate determination in trees. Biol. Plant.15:171--178.
Dang, Q.L., V.J. Lieffers, R.L. Rothwell and S.E. Macdonald. 1991. Diurnal variation and interrelations of ecophysiological parameters in three peatland woody species under different weather and soil moisture conditions. Oecologia 88:317--324.
Granier, A. and D. Loustau. 1994. Measuring and modelling the transpiration of a maritime pine canopy from sap-flow data. Agric. For. Meteorol.71:61--81.
Gower, S.T. and J.H. Richards. 1990. Larches: deciduous conifers in an evergreen world. BioScience 40:818--826.
Jarvis, P.G., G.B. James and J.J. Landsberg. 1976. Coniferous forests.
In Vegetation and the Atmosphere. Vol. 2. Ed. J.L. Monteith.
Aca-demic Press, London, pp 171--240.
Kelliher, F.M., R. Leuning and E.-D. Schulze. 1993. Evaporation and canopy characteristics of coniferous forests and grassland. Oecolo-gia 95:153--163.
Kelliher, F.M., R. Leuning, M.R. Raupach and E.-D. Schulze. 1995. Maximum conductances for evaporation from global vegetation types. Agric. For. Meteorol. 73:1--16.
Kelliher, F.M., D.Y. Hollinger, E.-D. Schulze, N.N. Vygodskaya, J.N. Byers, J.E. Hunt and T.M. McSeveney. 1994. Evaporation from a Siberian larch forest. In Proc. Int. Symp. For. Hydrol. Ed. T. Ohta. Int. Union For. Res. Organ., Hachioji, Tokyo, Japan, pp 123--130. Kelliher, F.M., B.M.M. Köstner, D.Y. Hollinger, J.N. Byers, J.E. Hunt,
T.M. McSeveny, R. Meserth, P.L. Weir and E.-D. Schulze. 1992. Evaporation, xylem sap flow, and tree transpiration in a New Zea-land broad-leaved forest. Agric. For. Meteorol. 62:53--73. Körner, Ch. 1994. Leaf diffusive conductances in the major vegetation
types of the globe. In Ecophysiology of Photosynthesis. Ecological Studies. Vol. 100. Eds. E.-D. Schulze and M.M. Caldwell. Springer, Heidelberg, pp 463--490.
Köstner, B.M.M., E.-D. Schulze, F.M. Kelliher, D.Y. Hollinger, J.N. Byers, J.E. Hunt, T.M. McSeveny, R. Meserth and P.L. Weir. 1992. Transpiration and canopy conductance in a pristine broad-leaved forest of Nothofagus: an analysis of xylem sap-flow and eddy correlation measurements. Oecologia 91:350--359.
Leuning, R. 1995. A critical appraisal of a combined stomatal-photo-synthesis model for C3 plants. Plant Cell Environ. 18:339--357 Figure 6. Daytime estimates of half-hourly total tree conductances for
Livingston, N.J. and T.A. Black. 1987. Stomatal characteristics and transpiration of three species of conifer seedlings planted on a high elevation south-facing clear-cut. Can. J. For. Res. 17:1273--1282. Lösch, R. and E.-D. Schulze. 1994. Internal coordination of plant
responses to drought and evaporative demand. In Ecophysiology of Photosynthesis. Ecological Studies. Vol. 100. Eds. E.-D. Schulze and M.M. Caldwell. Springer, Heidelberg, pp 185--204.
Müller, M. 1982. Selected climatic data for a global set of standard stations for vegetation science. Dr. W. Junk Publishers, The Hague, 306 p.
Oren, R., E.-D. Schulze, R. Matyssek and R. Zimmermann. 1986. Estimating photosynthetic rate and annual carbon gain in conifers from specific leaf weight and leaf biomass. Oecologia 70:187--193. Pearcy, R.W., E.-D. Schulze and R. Zimmermann. 1989. Measurement of transpiration and leaf conductance. In Plant Physiological Ecol-ogy: Field Methods and Instrumentation. Eds. R.W. Pearcy, J.R. Ehleringer, H.A. Mooney and P.W. Rundel. Chapman and Hall, London, pp 137--160.
Schulze, E.-D., F.M. Kelliher, C. Körner, J. Lloyd and R. Leuning. 1994. Relationships between maximum stomatal conductance, eco-system surface conductance, carbon assimilation rate and plant nitrogen nutrition: a global ecology scaling exercise. Annu. Rev. Ecol. Syst. 25:629--660.
Schulze, E.-D., J. Èermák, R. Matyssek, M. Penka, R. Zimmermann, F. Vasicek, W. Gries and J. Kuèera. 1985. Canopy transpiration and water fluxes in the xylem of the trunk of Larix and Picea trees----a comparison of xylem flow, porometer and cuvette measurements. Oecologia 66:475--483.
Schulze, E.-D., W. Schulze, F.M. Kelliher, N.N. Vygodskaya, W. Ziegler, K.I. Kobak, H. Koch, A. Arneth, W.A. Kusnetzova, A. Sogatchev, A. Issajev, G. Bauer and D.Y. Hollinger. 1995. Above-ground biomass and nitrogen nutrition in a chronosequence of pristine Dahurian Larix stands in eastern Siberia. Can. J. For. Res. 25:943--960.
Shinozaki, K., K. Yoda, K. Hozumi and T. Kira. 1964. A quantitative analysis of plant form----the pipe model theory. I. Basic analysis. Jpn. J. Ecol.14:97--105.
Shukla, J. and Y. Mintz. 1982. Influence of land-surface evapotranspi-ration on the earth’s climate. Science 215:1498--1500.
Shridenko, A. and S. Nilsson. 1994. What do we know about the Siberian forests? Ambio 23:396--404.