Original
Article
Access this article online Quick Response Code:
Website: www.ijcm.org.in
DOI:
10.4103/0970-0218.205216
of over 1344 all-cause mortalities[8] and Desai et al[9]
reported an excess of over 6 deaths per day when heat index crossed 54°C during the summer season.
Global warming might change the temporo-spatial pattern of all-cause mortality due to extreme temperature, especially heat waves. Coastal cities may be different from climate change perspective and Surat is one of them. Surat Municipal Corporation (SMC) installed 10 weather
Introduction
Global Public Health scenario is changing because of remarkable burden of diseases and mortality due to climate change, especially extreme temperatures.[1,2] Studies have shown that heat waves are most signiicant weather-related cause of mortality throughout the world.[3-4]
Evidence based information from all over the globe revealed that climate change has augmented the threat of temperature related morbidity and mortality especially for urban areas.[5-6] Indian cities also experienced heat waves with a signiicant mortality rate.[7-9] Ahmedabad
city heat wave in May 2010 was responsible for an excess
Address for correspondence:
Dr. Suresh K Rathi, Vadodara, Gujarat, India. E-mail: [email protected]
Received: 04-07-16,Accepted: 26-12-16
Summer Temperature and Spatial Variability of
all-Cause Mortality in Surat City, India
SK. Rathi, VK. Desai, P. Jariwala, H. Desai1, A. Naik1, A. Joseph1
Urban Health and Climate Resilience Centre, Surat, 1Health Department, Surat Municipal Corporation, Surat, Gujarat, India
ABSTRACT
Background: Ample information is available on extreme heat associated mortality for few Indian cities, but scant literature is available on effect of temperature on spatial variability of all-cause mortality for coastal cities. Objective: To assess the effect of daily maximum temperature, relative humidity and heat index on spatial variability of all-cause mortality for summer months (March to May) from 2014 to 2015 for the urban population of Surat (coastal) city. Materials and Methods: Retrospective analysis of the all-cause mortality data with temperature and humidity was performed on a total of 9,237 deaths for 184 summer days (2014-2015). Climatic and all-cause mortality data were obtained through Tutiempo website and Surat Municipal Corporation respectively. Bivariate analysis performed through SPSS. Observations: Mean daily mortality was estimated at 50.2 ± 8.5 for the study period with a rise of 20% all-cause mortality at temperature ≥ 40°C and rise of 10% deaths per day during extreme danger level (HI: > 54°C) days. Spatial (Zone wise) analysis revealed rise of 61% all-cause mortality for Southeast and 30% for East zones at temperature ≥ 40°C. Conclusions: All-cause mortality increased on high summer temperature days. Presence of spatial variation in all-cause mortality provided the evidence for high risk zones. Findings may be helpful in designing the interventions at micro level.
Keywords: Heat Index, humidity, mortality, spatial variability, Surat, temperature
This is an open access article distributed under the terms of the Creative Commons Attribution-Non Commercial-Share Alike 3.0 License, which allows others to remix, tweak, and build upon the work non-commercially, as long as the author is credited and the new creations are licensed under the identical terms.
For reprints contact:[email protected]
Cite this article as: Rathi SK, Desai VK, Jariwala P, Desai H, Naik A, Joseph A. Summer temperature and spatial variability of all-cause mortality in Surat
stations in all 7 administrative zones almost covering all directions of the city. The preliminary analysis of these weather stations shows that East and Southeast zones are around 3°C-4°C warmer than other zones on the same day. However, there is a scarcity of data on temperature and spatial variability of all-cause mortality for Surat.
This paper reports the effect of daily maximum temperature, relative humidity and Heat Index (HI) on spatial variability of all-cause mortality for summer months (March to May) from 2014 to 2015 for urban population of the coastal city of Surat, India.
Materials and Methods
Study setting
Surat is the 2nd largest city of Gujarat State and is divided
into seven administrative zones. Surat’s temperature ranges between 38 to 44.5°C during summer.[10] The city’s
wind direction is predominately South-west.
Study Design
Retrospective analysis of all-cause mortality data, with temperature and humidity.
Data Collection and Analysis
Temperature and relative humidity data accessed
through Tutiempo Network, S.L website.[11] Daily
maximum temperature and relative humidity data were used in the calculation of the Heat Index (HI). The HI was classiied into Extreme Danger: > 54°C; Danger: 41°C-54°C; Extreme Caution: 32°C-41°C and Caution: 27°C-32°C.[12] Birth and Death Registration Department
of the SMC was approached for all-cause mortality (death) data. City deaths were sorted out through place of residence of deceased persons. SPSS version (16.0) was used for descriptive and bivariate analysis.
Analysis of variance (ANOVA) and Student t-test were used for testing the signiicance of differences between the mean death values at maximum temperature of < 35°C, 35-39°C and ≥ 40°C and up to danger level risk days versus extreme danger level days at zone and city level. Tukey’s multiple comparison post hoc test was used to compare the mean deaths among temperature groups at zone level. Pearson correlation analysis is used to determine the relationship between the maximum temperature and all-cause mortality for lag time effect. The probability (p) level of < 0.05 was considered signiicant.
Results
A total of 9,237 all-cause mortality for 184 summer days for the year 2014 and 2015 was analysed with relation to temperature and relative humidity.
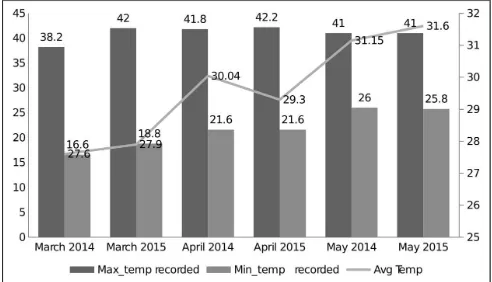
Figure 1 shows the average humidity, mean, minimum and maximum temperature for the years 2014 and 2015, and Figure 2 shows the temperature comparison of summer months for the years 2014 and 2015.
Mean maximum temperature during summer was 35.4°C ± 2.8°C for the year 2014-2015. Of 184 summer days, 147 days had humidity ≥ 50%, temperature ≥ 40ºC for 14 days and HI > 54ºC for 38 days. Mean daily all-cause mortality was estimated at 50.2±8.5 for the study period.
Population density is highest in Central zone, followed by Southeast and East zones. The decadal growth rate is highest 88% for Southeast zone and 60% for East zone. Proportional summer all-cause mortality is higher than the total zonal all-cause mortality for East and Southeast zones [Table 1].
The mean number of deaths per day at daily maximum temperature of < 35°C was 48.0 ± 7.7 which increased to 57.3 ± 7.2 during the daily maximum temperature of ≥ 40°C. This shows that 9.3 (20%) deaths per day increased when the temperature reached ≥ 40°C. Mean daily all-cause mortality shows a signiicant association with daily maximum temperature (p < 0.001) and HI for extreme danger risk days (p < 0.001) [Table 2].
Figure 2: Temperature comparison for summer months of 2014 and 2015
Mean number of deaths per day at daily maximum temperature of < 35°C was 3.6 which increased to 5.8 during daily maximum temperature of ≥ 40°C
for Southeast zone. This means that 2.2 (61%) deaths per day increased at the temperature of ≥ 40°C for Southeast zone. This is followed by East zone where
Table-2: All-cause Mortality with temperature, humidity and HI (summer 2014 and 2015) Factor No. of Days
(Summer)
> 54 Extreme danger
146
Total 184 9237 50.20 ± 8.5
Table-3: Maximum temperature and zone wise All-Cause Mortality of summer 2014-2015 Zone Maximum Temperature (oC) Deaths
Mean ± SD
Table-1: Zone wise population density and all-cause mortality-Surat City
Zone SWZ WZ SZ CZ NZ SEZ EZ
Population (%) 347,080 (7.70) 424,986 (9.43)
695,028 (15.43)
408,760 (9.07) 705,161 (15.65)
788,304 (17.49) 1137,136 (25.23)
Area Sq.KM 111.9 51.3 61.8 8.2 36.4 19.5 37.5
Population Density per sq/km 3,101 8,288 11,253 49,971 19,392 40,442 30,303
Residential Area (%) 32 48 30 81 44 72 52
Industrial Area (%) <1 <1 15 0 8 <1 6
Agricultural Area (%) 17 25 27 0 8 <1 17
Decadal Growth Rate (%) 2001-2011
43 48 70 -1 70 88 60
All-Cause Mortality-2014 and 2015 (%)
highest population density, predominantly migrant population due to more slums and death registration may be up to 80%. The all-cause mortality is high in Southwest and Central zones as compared to total zonal population. This may be due to high old age population and almost 100% death registration. In brief, there is a deadly combination of population density, industries, and slums with migrant population for Southeast and East zones and hence, are more vulnerable to all-cause mortality due to high temperature.
Conclusions
This study demonstrated the rise of 20% all-cause mortality at temperature ≥ 40°C. Study also concluded the spatial variation of all-cause mortality at zonal level with temperature. East and Southeast zones emerged as high risk zones. Hence, this study is very crucial for designing the speciic interventions like temperature forecast, early warning system through short service messages (SMS) at micro level.
Acknowledgement
Authors would like to acknowledge the Health Department of Surat Municipal Corporation for providing the All-Cause Mortality data. We are grateful to TARU Leading Edge as hand holder for UHCRC.
Financial support and sponsorship
We received funding support from the Asian Cities Climate Change Resilience Network (ACCCRN-III) for Urban Health and Climate Resilience Centre.
Conlicts of interest
There are no conlicts of interest.
References:
1. Haines A, Kovats RS, Cambell-Lendrum D, Corvalan C. Climate change and human health: Impacts, vulnerability and public health. Public Health 2006;120:585-96.
2. Bush KF, Luber G, Kotha SR, Dhaliwal RS, Kapil V, et al. Impacts of climate change on public health in India: future research directions. Environ Health Perspect 2011;119:765-70.
3. Baccini M, Biggeri A, Accetta G, Kosatsky T, Katsouyanni K, Analitis A, et al. Heat effects on mortality in 15 European cities. Epidemiology 2008;19:711-9.
4. Basu R. High ambient temperature and mortality: A review of epidemiologic studies from 2001 to 2008. Environ Health 2009;8:40.
5. Barriopedro D, Fischer EM, Luterbacher J, Trigo RM, Garcia-Herrera R. The hot summer of 2010: Redrawing the Temperature Record Map of Europe. Science 2011;332:220-4.
there is a rise of 30% (10.4 to 13.5) deaths per day during the temperature of ≥ 40°C. The per day mean difference of all-cause mortality for all 7 zones is signiicant (t = 5.623, p 0.001) for the temperature < 35°C vs ≥ 40°C. Tukey’s post hoc test showed that there is a signiicant difference for mean deaths at temperature < 35°C, 35-39°C and ≥ 40°C for Southeast and East zones [Table 3]. The lag effect of extreme heat on mortality is at a peak period (r = 0.241) on same day of the maximum temperature but continues up to four days [Table 4].
Discussion
The impact on all-cause mortality due to heat waves has been explored and documented by public health experts, climatologists.[13] Generally, the linkages between heat
and all-cause mortality are studied at broader scales which are less likely to be relevant at the local (city) level. Within the city; geography of the zone (sector), river or sea nearby zone, number of industrial units, population density and slum population might redistribute the temporo-spatial pattern of all-cause mortality in relation to high temperature. However, spatial variation of all-cause mortality with summer temperature has not been the focus of attention. This work, to our knowledge, is the irst of its kind for spatial variation among urban population of Surat city.
We found increasing mortality with relation to rising temperature and conclude that temperature is an important factor affecting all-cause mortality for Surat city. This also augments the previous indings and is consistent with results obtained in other areas.[9,14]
All-cause mortality is also correlated with the heat index consistent with various studies.[9,14] High humidity (≥ 50%) for 147 summer days, temperature ≥ 40ºC for 14 days and HI > 54ºC for 38 days can pose threat for excess all-cause mortality is consistent with previous results.[9]
East zone of Surat shows high percentage of summer all-cause mortality as compared to total zonal deaths. This can well explained by; 1) high population density, 2) more distance from the sea as wind low is from the South west which has a cooling affect, 3) more heat wave days (42 out of 184 summer days) having temperature ≥ 40°C, and 4) more settled migrant population. In spite of very high decadal population growth rate (88%) between 2001 and 2011, the deaths are less in Southeast zone but are signiicantly associated with temperature. A possible explanation may be that this zone has the
Table-4:Lag time correlation between temperature and All-Cause Mortality (2014 and 2015)
Pearson Correlation Coeficient No Lag One day lag Two day lag Three day lag Four day lag
Maximum Temperature (oC) 0.241** 0.231** 0.192** 0.193** 0.167*
Environ Monit Assess 2013;185:3313-25.
11. http://www.tutiempo.net/en/Climate/SURAT/428400.htm [Last accessed on 2016 March 15].
12. Desai VK, Patel U, Rathi SK, Wagle S, Desai HS. Temperature and humidity variability for Surat (coastal) city, India. Int J Environ Sci 2015;5:935-46.doi: 10.6088/ijes.2014050100088.
13. Vandentorren S, Suzan F, Medina S, Pascal M, Maulpoix A, Cohen JC, et al. Mortality in 13 French cities during the August 2003 heat wave. Am J Public Health 2004;94:1518.https://www. ncbi.nlm.nih.gov/pubmed/15333306
14. Harlan SL, Chowell G, Yang S, Petitti DB, Butler EJM, Rudell
BL, et al. Heat-related deaths in hot cities: Estimates of human
tolerance to high temperature thresholds. Int. J. Environ. Res. Public Health 2014;11:3304-26.
6. Gasparrini A, Armstrong B. The Impact of Heat Waves on
Mortality. Epidemiology 2011;22:68-73.
7. De US, Mukhopadhyay RK. Severe heat wave over the Indian subcontinent in 1998, in perspective of global climate change. Curr. Sci. 1998;75:1308-11.
8. Azhar GS, Mavalankar D, Nori-Sarma A, Rajiva A, Dutta P, Jaiswal A, et al. Heat-Related Mortality in India: Excess All-Cause Mortality Associated with the 2010 Ahmedabad Heat Wave. PLoS One 2014;9:e91831-https://www.ncbi.nlm.nih.gov/ pubmed/24633076
9. Desai VK, Wagle S, Rathi SK, Patel U, Desai HS, Khatri K. Effect of ambient heat on all cause mortality in Surat City. Curr. Sci. 2015;109:1680-6.
10. Sharma R, Gosh A, Joshi PW. Spatio-temporal footprints of urbanisation in Surat, the Diamond City of India (1990-2009).
Attention Life Members
In pursuance of agenda item no. 11/1-2, minutes of general body meeting (GBM) held at Kolkata on 11/2/2017, Chief Editor, IJCM was assigned to look into and give suggestions for the amendment in the existing constitution of IAPSM, at the GBM to be held during the next annual national conference at Pune.
Current constitution is uploaded on the IAPSM website (http://iapsm.org/constitution.html). All life members of IAPSM are invited to go through it and email their valuable suggestions, if any, to chiefeditorijcm@yahoo. com, taking care of the following:
1. Email shall have a subject line of Constitutional Amendment. Also include your IAPSM life membership no. in the body
2. Send your mail latest by 31st August 2017. Mails received later will not be taken up for the consideration.
3. For every suggestion, give the current status of constitution and your comments “what to be replaced with what”
4. Any new item can be be suggested, but with a clear title - NEW ITEM.