online ISSN: 2247 - 806X; p-ISSN: 2247 – 8051; ISSN - L = 2247 - 8051 © JPES
Original Article
Longitudinal study on the effectiveness of game actions during the Olympic
Games men's handball (2004-2016)
FLORIN V. LEUCIUC
Ştefan cel Mare University of Suceava, Suceava, ROMANIA Published online: June 30, 2017
(Accepted for publication June 17, 2017)
DOI:10.7752/jpes.2017.02108
Abstract:
This study may lead to the identification of the elements that indicate trends of men's handball for the period 2004-2016, thus creating the conditions for determining the principles for achieving training and participation in high level competitions. As a result of comparing the data obtained from the performed analysis, there should be reconsidered margins actions efficiency benchmarks monitored in order to be useful in training and competition, by requiring reconsideration model performance of handball game at senior level. Given that the survey covers the four editions of the Olympic Games and the analyzed data showed high degree of veridicity, we notice which parts may be used for the following competitions.
Key words: handball, efficiency, performance, Olympic Games.
Introduction
Men's handball was present for the first time, as a demonstrative sport, in the Olympic program at the 1936 edition in Berlin, when six teams were participating. Next appearance is held at O.G. Munich 1972, time then remaining constant in the Olympic Games program. It was the edition with most teams participating, 16 in number; at the next edition decreases the number of teams to 11, and from 1980 to the present, the number of participating teams is 12. Designation of participating teams is as follows: the host team, World Cup finalists, winners of continental championships to which there are added the first 2 ranked each of the 3 qualifier tournaments.
In the form with 12 participating teams, the number of games played by each team varies between 5 and 8, depending on the place in the rankings: places 1-8 - 6-8 games, places 9-12 - 5 games.
The measurement and assessment of the game actions play an important role in planning the training process and competition (Bilge, 2012).
The handball players must have a lot of motor skills enabling them to execute a wide range of techniques, with and without the ball, in terms of speed and strength in relationships with teammates and in opposition with the other team. Practicing handball at performance level requires a specific and sustained effort to meet the rigors of competition (Ghervan, 2006).
In the performance handball at the senior level the teams carry over 60 offensive and as many defensive actions. The net duration of the game is around 42 minutes, so at every game there are lost 18 minutes. Offensive and defensive actions made during the game differ in terms of content, duration and purpose. The average duration of an attack is about 25 seconds. In performance handball 50% of actions are completed in a goal, in 30% of cases there are missed shots, and in 20% of the actions the ball is lost before the shot (Taborsky, 2001).
The effort in the game of handball is characterized by the alternation of a large number of short and explosive actions (over 300) interrupted by periods of active break (lasting up to 30 seconds). The fast actions have as average a duration of 2-3 seconds and represent approximately 20% of the time. This type of effort is the main determinant of performance, and this is what makes the difference in the game (Leuciuc, 2012).
To meet the requirements of efficiency required by the contemporary handball, the game became fast and dynamic, which requires the players a good physical preparation, namely a high level of strength and speed development, along with the execution of techniques with efficiency in game conditions and the increasing importance of the relationship 1 to 1. The tactical plan required a flexible transition to various forms of attack and defense throughout the game to embarrass the opponents (Sevim and Bilge, 2005).
Material & methods
Determination of the effectiveness of the teams participating at the Olympic Games may be a reference to the revaluation of the game model at senior level in high performance handball.
---In carrying out the study, the main research methods used were bibliographical and statistics (mean, standard deviation, ANOVA). Bibliographic method was used for this study having as a strating point the analyzes conducted by EHF and IHF lecturers. Statistical method was used to process the data supplied by IHF for Olympic Games (http://ihf.info/IHFCompetitions/OlympicGames/, accessed 15th November 2016) after deployment and game actions quantified, we used them in the study.
Results
The game actions that provided the statistical analysis are: shots efficiency (6m, wing, 9m, 7m, fast break), goalkeepers efficiency, interception and blocked shots. For these actions the analysis was performed as follows: for all the participating teams (12), places 1-4, places 1-8 (table 1). I have used the following statistical parameters: arithmetic mean, standard deviation, Anova.
Table 1 Game actions efficiency
Teams Statistical parameters
/ Game actions
Shots efficiency (%) Shots efficiency
The average shots efficiency was 55.83±3.14% (minimum-53.33%, maximum-60.42%) for all the participating teams; for places 1-8 it was 58±3.13% (minimum-54.88%, maximum-62.25%) and places 1-4 registered the best efficiency - 59.75±3.65% (minimum-56%, maximum-64.75%). For the shots from the 6m line there were recorded the following average values 66.50±3.45% (all teams), 67.72±3.16% (places 1-8), 69.88±3.82% (places 1-4). For the wing shots the best efficiency was for teams ranked in places 1-4 (60.81±5.03%), followed by the places 1-8 (59.57±5.21%) and then the average of the all participating teams (57.50±5.87%). For 9m shots the efficiency stemmed by the occupied place thus: places 1-4 - 41.44±5.15%, places 1-8 - 40.47±3.52%, all teams - 39±2.18% (figure 1).
53.33
2004 2008 2012 2016 mean
All teams Places 1-4
Fig. 1. Shots efficiency (%)
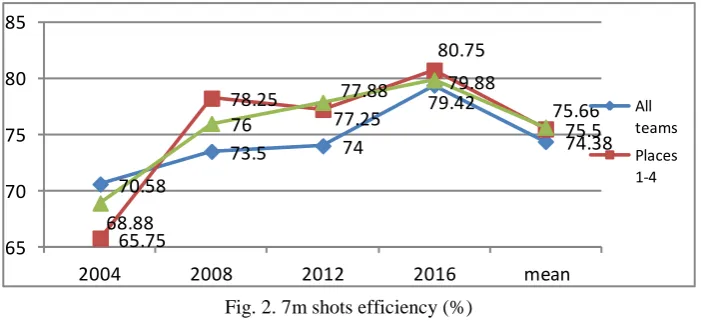
At 7m shots the best efficiency was registered for teams ranked at places 1-8 (75.66±4.79%), followed by places 1-4 (75.50±6.66%) and finally all the teams (74.38±3.69%) (figure 2).
70.58
2004 2008 2012 2016 mean
All
teams
Places
1-4
--- 719 It highlights the effectiveness of fast break opportunity to score goals quickly, and at this indicator the teams ranked 1-4 had an efficiency of 79±3.79%, those placed 1-8 - 77.50±3.72% and the average value of all teams it was 74.69±3.73% (figure 3).
75.58
70.5
73.33
79.33
74.69 79.5
73.5
81.25 81.75
79 78.63
72.38
77.75
81.25
77.5
70 75 80 85
2004 2008 2012 2016 mean
All teams
Places 1-4
Places 1-8
Fig. 3. Fastbreak efficiency (%)
Goalkeepers efficiency is an indicator that was in inverse relationship with the shots efficiency, and the best average had goalkeepers of the teams in the first 4 places (34.04±3.59%), followed by those of teams in 1-8 places ( 33.15±3.54%) and for all teams the average was 31.75±2.62% (figure 4).
33.17
32.83
33.18
27.83
31.75 36
33
37.67
29.5
34.04 35.25
33.25 35.96
28.13
33.15
25 30 35 40
2004 2008 2012 2016 mean
All
teams
Places
1-4
Fig. 4. Goalkeepers efficiency (%)
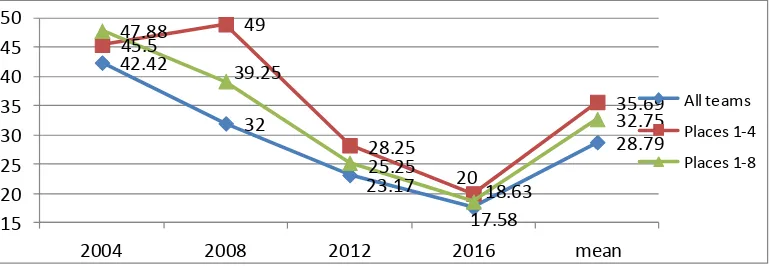
Because performing interception results in achieving fast break and marking easy goals, this indicator was expected to dominate the top teams, their average being 35.59 interception or 5.1 interception per game, followed by teams finishing 1-8 places (32.75 interception or 4.7 per game); the average of all teams was 28.79 interception or 4.8 per game (figure 5).
42.42
32
23.17
17.58
28.79 45.5
49
28.25
20
35.69 47.88
39.25
25.25
18.63
32.75
15 20 25 30 35 40 45 50
2004 2008 2012 2016 mean
All teams
Places 1-4
Places 1-8
---The number of shots blocked by defenders contributed to increase defense efficiency, the best average was for the top 4 teams (32 or 4.6 per game), then the places 1-8 (26.1 or 3.7 per game ) and then fot all the participating teams (21.19 or 3.5 per game) (figure 6).
24.83 26.17
2004 2008 2012 2016 mean
All teams
Places 1-4
Fig. 6. The evolution of the blocked shots (average number)
Most indicators are relevant because the average values of variation coefficient which are between 2 and 7% (high homogeneity), the exception being the interceptions which are between 10.85% - 13.84%, indicating medium homogeneity of the group.
There was no statistical difference between the Olympic tournaments for game actions analyzed on this three categories (all teams, places 1-4, places 1-8), because the values of the teams and players were very close (F(2,9)=4,256, p>0.05). It should be noted that the best 12 teams in the world participated in this competition.
Conclusions
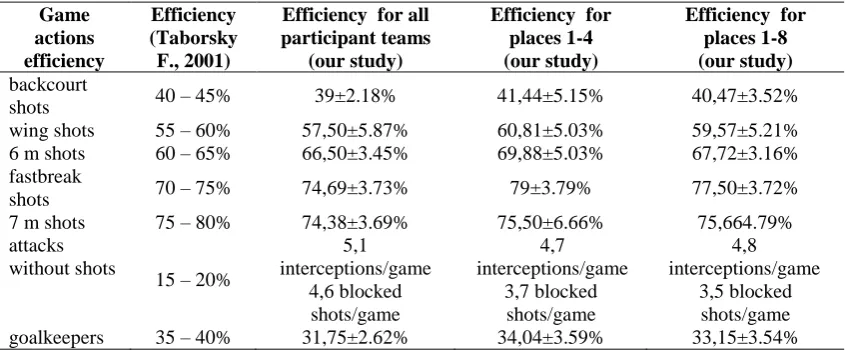
In specialized literature there are made recommendations on minimum efficiency of the game actions (Taborsky, 2001), so we considered them benchmarks for the conducted study (table 2).
Table 2. The efficiency of game actions in our study compared with those form the special literature
Game
Efficiency for all participant teams (39±2.18%), while for the other two analyzed categories there are allowed margins (places 1-4 – 41.44±5.15%; places 1-8 – 40.47±3.52%).
The efficiency for 6m shots passing of 66%, so with 6% higher than the minimum allowable, which is why we consider that the minimum should be raised to 65%.
At wing shots for the 3 analyzed categories, the requirements are in the upper half of the recommendations (from 57.5 to 60.81%).
For 7m shots there were recorded values below the minimum average (75%) for all teams (74.38%) and in the parameters at the other two categories: 75.50% (places 1-4), 75.66 % (places 1-8).
In the case of goalkeepers the efficiency was under optimum level in all categories (35-40%): the first 4 ranked (34.04%), places 1-8 (33.15%) and all teams (31.75%). Based on these benchmarks, for 6m shots the minimum level should be increased by 5% (to 65%) because all categories exceeded the upper margin.
For the other indicators there is recommended to maintain the actual margins.
--- 721 At the shots (9m, 7m) which have not reached the minimum level or are close to it there is recommended that in training, there should be used more often concrete situations of the game that must be solved and where to focus to increase the efficiency of shots. In the same context, the efficiency of the goalkeepers must increase.
There are differences between the winners and the losing teams in term of efficiency in different game situations, but results are quite close; and this facts can determine the victory in a game (Guttierez Aguilar, 2011). At O.G. Beijing 2008, in the male handball tournament there were three indicators of team playing performance (shooting efficiency, attacks terminated by mistake, attacks efficiency), decisive for establishing the final hierarchy (Taborski, 2008). This statement is valid for all 4 editions of the analyzed O.G., if we add the goalkeepers efficiency.
In the analyses carried out previously for E.C. and W.C., I have noticed the same trends of differentiation between categories analyzed and for the teams seeking a qualification at the O.G. it is recommended that game action efficiency be placed in the margins of the places 1-8 from table 1 in the context of the playing games with teams that constantly qualify for the final tournament. Teams that aspire to win the competition or medals need to exceed average requirements for places 1-4 (table 1) (Leuciuc and Pricop, 2015a,b). The work must be applied under fatigue and by participation in friendly competitions where they have a way similar to the official ones (a number of 5-8 games). In according with these requirements, it should have effect for the following competitions, and then it should be settled a reassessment to see if those problems have been corrected.
As a result of comparing the data obtained from the performed analysis there should be reconsidered margins actions efficiency benchmarks monitored to be useful in training and competition, by requiring reconsideration game model in elite handball at senior level. Given that the survey covers the four editions of the Olympic Games and the analyzed data showed high degree of veridicity, we notice which parts may be used for the following competitions.
References
Bilge M., (2012). Game Analysis of Olympic, World and European Championships in Men’s Handball. J Hum
Kinet, 35, 109–118.
Ghervan P., (2006). Handbal - teorie, metodică şi practică. Suceava: editura Universităţii “Ştefan cel Mare”. Gutierrez Aguilar O., (2011), Discriminant Analysis between Winners & Losers in the ASOBAL League
2008-2009. Eurohandball Web Periodical, 1-6.
http://home.eurohandball.com/ehf_files/Publikation/WP_Discriminant%20Analysis%20Winners%20Loser%20 ASOBAL%202008-2009%20.pdf
Kovacs, P., (2014). Women's European Championship 2014, Croatia/Hungary Qualitative analysis. Eurohandball Web Periodical, 20.
http://home.eurohandball.com/ehf_files/specificHBI/ECh_Analyses/2014/HUN/3/3.1.%20Qualitative%20Analy sis_W%20EURO%202014.pdf
Leuciuc F.V., (2012). Aprofundare într-o ramură sportivă: handbal. Suceava: editura Universităţii “Ştefan cel Mare”.
Leuciuc F. and Pricop G., (2015a). Longitudinal study on the effectiveness of the game actions at the World Men's Handball Championship seniors (2005-2015). The annals of “Dunarea de Jos” University of Galati, fascicle XV, 2, 27-32.
Leuciuc F. and Pricop G., (2015b), Longitudinal study on the effectiveness of the game actions at the European men's handball championship seniors (1998-2014), The annals of “Dunarea de Jos” University of Galati, fascicle XV, 1, 42-48.
Sevim Y. and Bilge M., (2005), The comparison of the last Olympic, World and European Men Handball Championships and the current developments in World Handball. Eurohandball Web Periodical, 1-10. http://home.eurohandball.com/ehf_files/Publikation/WP%20-20Sevim%20050905.pdf
Taborsky, F., (2001), Game performance in handball. Eurohandball Periodical, 2, 23-26.
Taborsky F., Cumulative Indicators of Team Playing Performance in Handball (Olympic Games Tournaments 2008). Eurohandball Web Periodical, 1-10.
http://home.eurohandball.com/ehf_files/Publikation/WP_Taborsky_OCGChina.pdf
Official results book, handball, 14-29 august, Atena 2004, 208-468. http://www.ihf.info/files/Uploads/Documents/8294_HB.pdf - accessed 21.10.2014
Official results book, handball, 9-24 august, Beijing 2008, 273-509. http://ihf.info/upload/HB%20Results%20Book.pdf - accessed 26.10.2014 Official results book, handball, 28 July-12 august, London 2012, 294-551.
http://www.ihf.info/files/Uploads/Documents/11388_Handball%20%20HB%20Results%20Book%20V1[1].pdf- accessed 03.11.2014
Official results book, handball, 6-21 august, Rio de Janeiro 2016, 312-570.