National report
Indonesia
The cover design of this report was inspired by the Global Study on Child Poverty and Disparities, a
multi-country initiative to leverage evidence, analysis, policy and partnership in support of child rights.
The overlapping, multi-coloured frames symbolize the national, regional and global contributions to
the Global Study, which form the basis for exchanging experiences and sharing knowledge on child
poverty.
The design encapsulates three central tenets of the Global Study: ownership, multidimensionality and
interconnectedness.
Ownership
: Although children’s rights are universal, every country participating in the study has its own history, culture and sense of responsibility for its citizens. The analyses aim to stimulate discussionand provide evidence on how best to realize child rights in each country.
Multidimensionality
: No single measure can fully reflect the poverty that children experience. A multidimensional approach is therefore imperative to effectively understand and measure children’swell-being and the various forms of poverty that they experience.
Interconnectedness
: Today’s world is increasingly interconnected through economic, social, technological, environmental, epidemiological, cultural and knowledge exchanges. These exchangeshave important implications for child poverty – and can also help provide avenues for its reduction.
Equity
: The Analyses aim to influence policies that reduce disparities, in order to protect the future of children living in poor, vulnerable households, unsafe circumstances, and/or disadvantagedcommunities.
Research Team
National
Widjajanti Isdijoso (Coordinator), Armand Arif Sim, Deswanto Marbun, Hariyanti Sadaly, Hastuti, Justin Sodo, Rachma Indah Nurbani, Rahmitha, Umbu Reku Raya, Vita Febriani, Yudi Fajar
East Sumba:
Hastuti, R.Justin Sodo, Parkit Handono, Tony Umbu Sunga, Maria Helena, Klaudia T. Sorywutun
North Jakarta:
Rachma Indah Nurbani, Yudi Fajar, Deswanto Marbun, Ratna Dewi, Ronald Sendjaya, Chrissanty Widya, Nur Aini Talib, Hariyanti Sadaly, Novita Maizir
English Editors:
CHILD POVERTY AND DISPARITIES IN INDONESIA:
CHALLENGES FOR INCLUSIVE GROWTH
Foreword
A nation comprising around 81.3 million children, Indonesia has made substantial advances towards putting children at the centre of the country’s development agenda. Progress on some of the Millennium Development Goals (MDGs) such as those on reduction of extreme poverty, attaining universal primary education and gender equality has been positive. Some of this success can be attributed to the series of political reforms undertaken by the nation, such as the decentralization agenda, supported by the strong economic recovery Indonesia witnessed in the last decades.
Notwithstanding the success, huge inter-provincial, rural-urban and wealth disparities continue to exist. The face of poverty in Indonesia is predominantly that of children, with nearly 13.8 million children living below the national poverty line. Within individual provinces, the inter-district variations in child poverty rates are remarkably pronounced, especially within the provinces of Papua, West Papua, Aceh, North Sumatra, West Sumatra and Maluku. On wealth disparities, it appears that there is a correlation between income poverty in children and aspects such as the size of households, gender of the
household head, educational levels of the household head and a household’s geographical (urban/rural) location. And while deprivation suffered by children in rural areas is more severe than those living in urban areas, there is an alarmingly high growth of urban poor.
There are key dilemmas and contradictions attached to tackling disparities in Indonesia. For instance, evidence shows that children in the eastern region of Indonesia are proportionately at a disadvantage when compared to children from the western region of Indonesia. However, when we observe the concentration of population, the highest numbers of poor and vulnerable children are found in Java. It is here that the importance of achieving the MDGs with equity becomes critical to ensure that the rights of every Indonesian child are protected. And this will require the sustained and collaborative efforts of all government and non-government stakeholders and development partners in Indonesia towards reducing existing disparities, improving necessary legal and policy frameworks, and expanding the scope of the poverty reduction and social protection frameworks in the country.
Thus to move forward on an evidence-based understanding of the multi-dimensional nature of child poverty in Indonesia, this study was conducted under the leadership of BAPPENAS with UNICEF’s technical and financial support and SMERU as the implementing organization. The study is an adaptation of the Global Child Poverty research methodology that has been supported by UNICEF worldwide across many other countries. The process of undertaking this study has been a comprehensive and arduous one, and has involved several rounds of consultations and discussions with researchers and other stakeholders before reaching its completion.
We are confident that the data and insight present in this study will contribute towards better understanding of the nature of inequities that are impeding the nation’s progress on the MDGs, particularly on the complex issue of child poverty and deprivation. We also hope that the information contained in this report will aid the government and its development partners as well as the media and civil society organizations in their efforts on planning, decision-making and implementation of programmes that will advance the rights of all Indonesian children.
Dra. Nina Sardjunani, MA Angela Kearney
Acknowledgement
This report is an outcome of the study conducted by the team from the SMERU Research Institute with extensive support from the Government of Indonesia – particularly the National Development Planning Agency (BAPPENAS), Statistics Indonesia (BPS), and other relevant ministries, and UNICEF Indonesia.
The research team is immensely indebted to various government and nongovernmental institutions that have provided information and data during the course of the study, revisions and finalization of this report. In particular, we are thankful for the contributions received from the participants of the research design workshops held in 2010:
- BAPPENAS, Ministry of Finance, Ministry of Health, Ministry of Home Affairs, Ministry of Women Empowerment and Child Protection, Ministry of Education, and Ministry of Social Affairs.
- Yayasan Cinta Anak Bangsa (YCAB), Yayasan Pemantau Hak Anak (YPHA), Yayasan Inklusi dan Pendidikan Non Diskriminasi, Yayasan Aulia, Pusat Pendidikan Anak Merdeka Perkumpulan Keluarga Peduli Pendidikan (PPAM Kerlip), Plan-International Indonesia, Yayasan Bina Anak Pertiwi (YBAP), Jaringan Lembaga Swadaya Masyarakat Penanggulangan Pekerja Anak (Jarak), Yayasan Kesejahteraan Anak Indonesia (YKAI), Mercy Corps, Kelompok Peduli Penghapusan Tindak Kekerasan terhadap Perempuan dan Anak (KePPak Perempuan), Yayasan Indonesian Street Children Organization (ISCO), and Komisi Perlindungan Anak Indonesia (KPAI). - Statistics Indonesia and Demographic Institute – University of Indonesia (LD-UI).
We would like to extend our appreciation to the communities, NGOs, and government officials in the four villages included in the study for providing their precious time and generous information. We are also thankful to the Government of Kabupaten Sumba Timur and the Government of Jakarta Utara for facilitating the research implementation at the local government levels.
We would like to express appreciation to various ministries, NGOs, all programme units within UNICEF Indonesia, UNICEF Regional Office in Bangkok, and UNICEF New York for the unstinted support provided during the revision and finalization of the study. Special thanks are extended to Qimti
Paienjton and Martin C. Evans for reviewing and providing comments, remarks and suggestions on the draft report.
Finally we are thankful to all staff in the BAPPENAS and the staff of the SMERU Research Institute for the steady and sincere support provided throughout the study.
Contents
Foreword ...
Acknowledgement ...
Contents ...
List of tables ...
List of figures ...
List of boxes ...
List of appendices ...
List of abbreviations ...
Executive summary ...
1. Children and development ...
1.1 Introduction ...1.2 Methods ...
1.3 Children in Indonesia: Demographic context ...
1.4 The political context: Democratization and decentralization in Indonesia ...
1.5 Economic growth, poverty and inequality ...
1.6 Macroeconomic policy and budget allocation ...
2. Children and poverty ...
2.1 Child poverty ...2.2 Children experiencing multiple deprivations ...
2.3 Child deprivation in shelter, water and sanitation dimensions ...
2.4 Non-material deprivation ...
3. Health and nutrition ...
3.1 National laws, regulations and programmes ...3.2 The institutional setting and provision of health services ...
3.3 Health and nutrition budgets ...
ii
iii
v
viii
xi
xiv
xv
xvi
1
17
1720
21
25
31
40
45
4652
56
61
73
7380
3.4 Children’s health and nutrition outcomes ...
3.4.1 Child mortality in children under the age of five ...
3.4.2. Child mortality in all children under the age of 18 ...
3.4.3 Child survival rates ...
3.4.4 Maternal mortality ...
3.4.5 Reducing child mortality and maternal mortality with nutrition
supplementation for mothers and children ...
3.4.6 Child nutritional status: Underweight, wasting, stunting and overweight ...
3.5 Recommendations ...
4. Education ...
4.1 Laws and policies on education ...4.2 Key national education programmes ...
4.3 Education system and institutional setting ...
4.4 Budget for education ...
4.5 Educational outcomes, disparities and gender inequality ...
4.6 Recommendations ...
5. Child protection ...
5.1 General policies and approaches to child protection ...5.2 Birth registration ...
5.2.1 Regulatory framework, policies and programmes ...
5.2.2 Institutional setting and budget ...
5.2.3 Outcomes regarding birth registration ...
5.2.4 Recommendations ...
5.3 Working children and child labour ...
5.3.1 Regulatory framework, policies and programmes ...
5.3.2 Institutional setting and budget ...
5.3.3 Outcomes regarding working children and child labour ...
5.3.4 Recommendations ...
5.4 Violence against children ...
5.4.1 Regulatory framework, policies and programmes ...
5.4.2 Institutional setting and budget ...
5.4.3 Outcomes regarding protecting children from violence ...
5.4.4 Recommendations ...
5.5 Children outside of parental care ...
5.5.1 Regulatory framework, policies and programmes ...
5.5.2 Institutional setting and budget ... 90
90
94
96
98
100
105
110
113
113114
118
121
122
135
137
137140
140
141
142
145
145
145
149
151
155
156
156
158
161
163
164
164
5.5.3 Outcomes in the provision of institutional childcare ...
5.5.4 Recommendations ...
6. Social protection ...
6.1 National laws and policies ...6.2 Major household income support programmes ...
6.2.1 Rice for the poor households (Raksin) ...
6.2.2 Unconditional (or direct) cash transfers ...
6.2.3 Conditional cash transfers ...
6.2.4 Overall programme performance ...
6.3 Benefits of social protection programmes for households and children ...
6.4 Recommendations ...
7. Addressing child poverty and disparities ...
7.1 Introduction ...7.2 The extent and state of child poverty in Indonesia ...
7.3 Reducing child poverty and disparities: How can we achieve this? ...
Appendices
List of References
170
173
175
175178
178
179
179
180
183
186
189
189191
List of tables
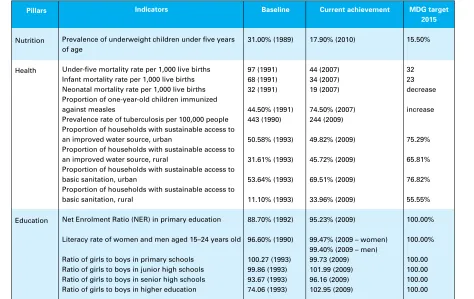
Table 1.1 Progress on key MDG indicators related to child well-being 18
Table 1.2 List of provinces in Indonesia 19
Table 1.3 Distribution of population by major island, 1971–2010 (%) 23
Table 1.4 Households by number of children, 2009 (%) 24
Table 1.5 Composition of Indonesian households by relationship to the head of household,
2009 (%) 24
Table 1.6 Quarterly gross domestic product (GDP) growth by sector, 2008–2010 35
Table 1.7 Allocation of central government expenditure by function, 2005–2010 44
Table 2.1 Declining poverty rates, 2003–2009 47
Table 2.2 Child (income) poverty rate by household characteristics, 2009 50
Table 2.3 Selected indicators for each dimension of child deprivation 54
Table 2.4 Children suffering multiple deprivations, 2009 54
Table 2.5 Correlations across dimensions of child poverty deprivation 55
Table 2.6 Children deprived in each dimension by household income quintiles, 2009 (%) 56
Table 2.7 Children suffering multiple deprivations by household income quintiles, 2009 (%) 56
Table 2.8 Children suffering shelter, sanitation and water deprivations, 2003–2009 (%) 57
Table 2.9 Children deprived of shelter, sanitation and water by household characteristics, 2009 (%) 59
Table 2.10 Child marriage and correlates, 2009 64
Table 2.11 Problems and situations that contribute to a sense of deprivation in children 65
Table 2.12 Events during the year that affect children, and their feelings about the events 69
Table 3.1 National Medium-Term Development Plan (RPJMN) health targets, 2009 and 2014 74
Table 3.2 MoH Strategic Plan targets for maternal and child health improvements, 2009 and 2014 75
Table 3.3 MoH Strategic Plan targets for community nutrition improvement, 2009 and 2014 75
Table 3.4 Objectives of the National Action Plan on Food and Nutrition 2006–2010 76
Table 3.5 Numbers of hospitals of different types, 2004–2008 81
Table 3.6 Number and facility-to-population ratio of community health centres (puskesmas) in
Indonesia, 2005–2009 81
Table 3.7 Budget allocated for health in 39 sampled districts and cities, 2007–2009 87
Table 3.8 Budget allocation for poor people in hospitals and community health centres
(puskesmas), 2006–2010 88
Table 3.9 Budget allocation for improving maternal and child health, 2006-2010 88
Table 3.10 Allocation of the budget for the Community Nutrition Improvement Programme,
2006–2010 90
Table 3.12 Treatment of diarrhoea, 2002 and 2007 (%) 93
Table 3.13 Child mortality by demographic characteristics and type of obstetric services, 2007 93
Table 3.14 Main causes of mortality by age group, 2007 95
Table 3.15 Child deprivations in a variety of health dimensions, 2003–2009 96
Table 3.16 Children aged 12- to 23-months obtaining primary immunization by respondent
characteristics, 2007 (%) 97
Table 3.17 Children deprived in the health dimension, by household characteristics (%) 98
Table 3.18 Coverage of nutrition intervention by urban/rural location and household expenditure,
2007 and 2010 (%) 101
Table 4.1 Strategic objectives of national education policy, 2010–2014 114
Table 4.2 School operational assistance (BOS) funding allocation and budget developments,
2005−2009 115
Table 4.3 Coverage and cost of the scholarship for poor students programme, 2008–2009 116
Table 4.4 New schools and classrooms built, 2006–2009 117
Table 4.5 Indonesia’s formal education system 118
Table 4.6 Number of schools and madrasah, 2008/2009 118
Table 4.7 Availability of and accessibility of schools in urban and rural areas, 2005 and 2008 119
Table 4.8 Progress in children’s access to formal education, 2003 and 2009 (%) 124
Table 4.9 Children deprived of education, by household characteristics, 2009 (%) 133
Table 5.1 Budget for child protection in ministries responsible for major child protection issues,
2010 139
Table 5.2 Budget for population related programmes and departments, 2006–2010 (in million IDR) 142
Table 5.3 Objectives, strategies and programmes of the National Action Plan for the Elimination
of the Worst Forms of Child Labour (NAP-WFCL), Stages I and II 147
Table 5.4 Cross-sectoral action plan on child protection, National Medium-Term Development
Plan 2010–2014 150
Table 5.5 Estimated number of child labourers by category and gender, 2009 152
Table 5.6 Working activities of children aged 10–17 years, 2003 and 2009 (%) 152
Table 5.7 Working children by characteristics, 2009 (%) 154
Table 5.8 Budget for protection of children from acts of violence, 2006–2009 160
Table 5.9 Child victims of criminal acts, 2007 and 2009 161
Table 5.10 Performance indicators for childcare institutions 167
Table 5.11 Budget for social welfare programmes for children, 2010–2011 167
Table 5.12 Social and rehabilitation budget allocations for children, 2009 and 2010 169
Table 6.1 Budget allocation for clusters I, II and III of the poverty reduction programmes,
2008–2010 178
Table 6.2 Rice for Poor Households; Numbers of households, rice ceiling and budgets, 2005–2010 179
Table 6.4 Number of poor households and number of target and recipient households for Rice
for Poor Households (Raskin), and unconditional and conditional cash transfers (BLT
and PKH), 2005–2010 181
Table 6.5 Distribution of Rice for Poor Households (Raskin) recipients by household wealth
quintile, 2002–2009 (%) 182
Table 6.6 Distribution of recipients of unconditional cash transfers (BLT) 2005/2006 based on
2007 data on household wealth quintile (%) 183
Table 6.7 Coverage by any form of social protection programme by household characteristics,
2009 (%) 184
Table 6.8 Children living in households that received various forms of government assistance (%) 185
Table 6.9 Use of unconditional cash transfer (BLT) funds, 2005 and 2008 (%) 185
Table 7.1 Indicators of economic strength and children’s well-being in Indonesia compared with
selected developing countries 190
Table 7.2 Summary of progress in reducing various dimensions of child poverty in Indonesia,
List of figures
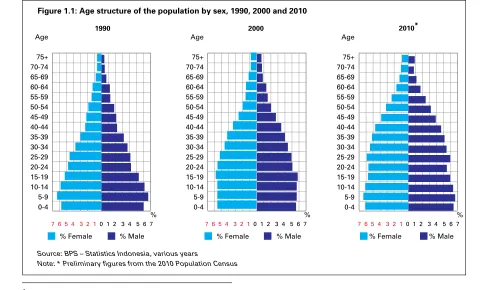
Figure 1.1 Age structure of the population by sex, 1990, 2000 and 2010 21
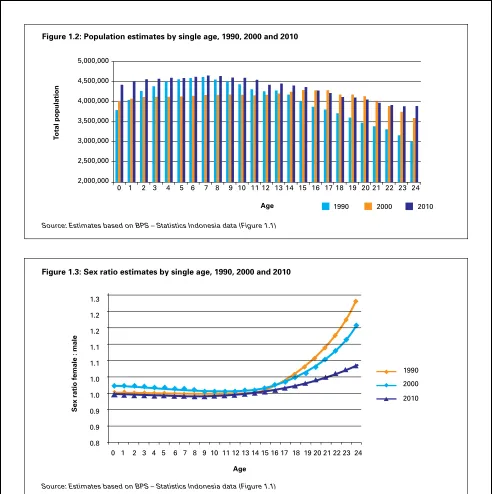
Figure 1.2 Population estimates by single age, 1990, 2000 and 2010 22
Figure 1.3 Sex ratio estimates by single age, 1990, 2000 and 2010 22
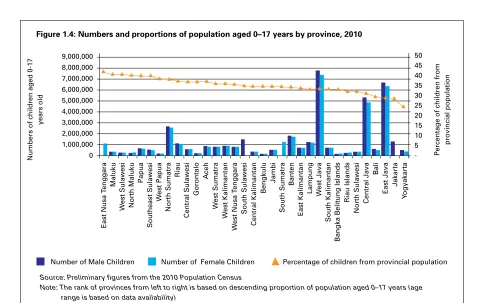
Figure 1.4 Numbers and proportions of population aged 0–19 years by province, 2010 23
Figure 1.5 Central government transfers to the regions, 2005–2010 30
Figure 1.6 Specific allocation funds by sector, 2006–2008 30
Figure 1.7 Composition of Indonesia’s gross domestic product (GDP) by sector of origin,
1960–2009 32
Figure 1.8 Participation of the population aged over 15 years in the labour market, and
unemployment rates, 2004–2010 33
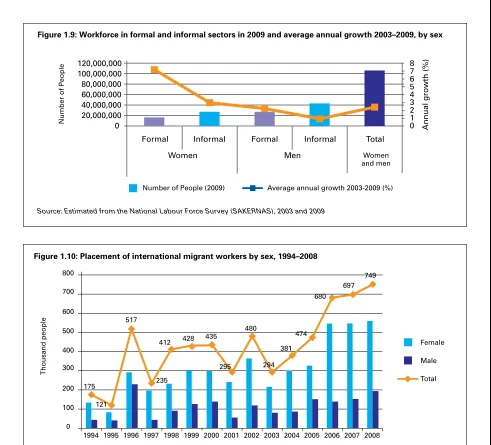
Figure 1.9 Workforce in formal and informal sectors in 2009 and average annual growth
2003–2009, by sex 34
Figure 1.10 Placement of international migrant workers by sex, 1994–2008 34
Figure 1.11 Gross domestic product (GDP) growth, poverty rate and number of poor people in
Indonesia, 1980–2009 36
Figure 1.12 People living below $1 PPP and $2 PPP per capita per day, 1990–2008 (%) 36
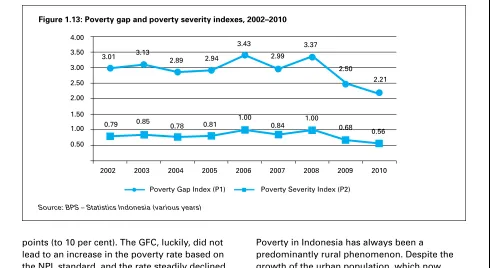
Figure 1.13 Poverty gap and poverty severity indexes, 2002–2010 37
Figure 1.14 Share of urban and rural poor as a proportion of the national poor, 1976–2010 37
Figure 1.15 Urban and rural poverty rates and Gini ratios, 1996–2010 38
Figure 1.16 Numbers of poor people and poverty rates by province, 2010 39
Figure 1.17 Progress in poverty reduction and economic development by province, 2005–2010 39
Figure 1.18 Annual inflation in Indonesia and neighbouring countries, 2000–2010 40
Figure 1.19 Changes in exchange rates in Indonesia and neighbouring countries, 2000–2010
(year 2000=100) 41
Figure 1.20 Central government revenues, expenditures and deficits, 2005–2010 41
Figure 1.21 Levels of government external debt and debt-service payments, 2004–2009 42
Figure 1.22 Indonesia’s external debt burden indicators, 2004–2009 42
Figure 1.23 Allocation of central government expenditure, 2005–2010 43
Figure 1.24 Components of the subsidy expenditures, 2005–2009 43
Figure 2.1 Distribution of children by per capita household expenditure quintiles, 2009 46
Figure 2.2 Child poverty and overall poverty using international poverty line (IPL) and national
poverty line (NPL) definitions, 2003 and 2009 47
Figure 2.3 Urban and rural child poverty rates and number of (income) poor children, 2009 48
Figure 2.4 Child poverty rates and shares by province, 2009 49
Figure 2.6 Children deprived of shelter by province, 2009 (%) 58
Figure 2.7 Children deprived of sanitation and water by province, 2009 (%) 58
Figure 2.8 Children not spending time with their parents in various types of activity, 2009 62
Figure 2.9 Frequency of children meeting with both parents, 2000 and 2007 63 Figure 2.10 Child marriage, pregnancy and childbirth among population aged 10–24 years, 2010 63 Figure 2.11 Children’s sources of well-being (material and non-material) revealed during FGDs with secondary school-aged boys in urban and rural areas 70 Figure 2.12 Children’s sources of well-being (material and non-material) revealed during FGDs with secondary school-aged girls in urban and rural areas 71 Figure 3.1 Health management structure 80
Figure 3.2 Number of community health centres (puskesmas) per 100,000 population by province, 2005 and 2009 82
Figure 3.3 Average number of village maternity clinic (polindes) per village, 2005 and 2008 83 Figure 3.4 Average number of integrated health services posts (posyandu) per village, 2005 and 2009 84
Figure 3.5 Central government health expenditure as a proportion of total expenditure, 2006–2010 86
Figure 3.6 Allocation of central government’s budget for health programmes, 2006 and 2010 87 Figure 3.7 Budget for the Community Nutrition Improvement Programme, 2006–2010 89 Figure 3.8 Infant and under-five mortality rates, 1971–2007 91 Figure 3.9 Housing conditions of the poor in the study areas of East Sumba (left) and North Jakarta (right) 95
Figure 3.10 Coverage of Universal Child Immunization (UCI), 2002–2009 97 Figure 3.11 Indonesia’s maternal mortality rate,1990–2015 100
Figure 3.12 Coverage of micronutrient intervention, by province (%) 102
Figure 3.13 Coverage macronutrient intervention, by province, 2007 (%) 103
Figure 3.14 Infant feeding practices, 2007 104
Figure 3.15 Exclusively breastfed babies aged 0–5 months, by urban/rural location, gender and household expenditure, 2010 (%) 104
Figure 3.16 Factors causing malnutrition 106
Figure 3.17 Anthropometrics of nutrition 106
Figure 3.18 Nutritional status of children under age five years, 2007 and 2010 107
Figure 3.19 Prevalence of underweight children under age five by urban/rural location and household expenditure, 2007 and 2010 108
Figure 3.20 Prevalence of stunting among children under age five by urban/rural location and household expenditure, 2007 and 2010 108
Figure 3.22 Prevalence of overweight children by urban/rural location and household
expenditure, 2007 109
Figure 3.23 Prevalence of unhealthy food consumption among children aged 10–14 years, 2007 110
Figure 4.1 Average number of senior secondary schools per village/precinct, 2005 and 2008 120
Figure 4.2 Central government budget for education as a proportion of total government
expenditure and of nominal GDP, 2005–2011 (%) 121
Figure 4.3 Central government education budget allocated directly to children, 2006–2010 (%) 122
Figure 4.4 Progress of school enrolment rates among girls and boys, in urban and rural areas,
and from the poorest and richest household quintiles, 2003 and 2009 125
Figure 4.5 Participation in school and work of the population under the age of 30 years, 2009 126
Figure 4.6 Reasons for the discontinuation by junior secondary school graduates aged 16–18
who did not enroll in senior secondary school, 2009 (%) 127
Figure 4.7 School enrolment rates by province, 2009 129
Figure 4.8 Twenty districts/cities with the lowest senior secondary school enrolment rates, 2009 130
Figure 4.9 Percentage of senior secondary school students failing to pass the national exam
threshold by province, 2009/2010 131
Figure 4.10 Distribution of teachers by region, 2009 132
Figure 5.1 Children under age five deprived of the right to have a birth certificate, by wealth
quintile and urban/rural location, 2007 and 2010 (%) 143
Figure 5.2 Children under age five without birth certificates by province, 2009 (%) 143
Figure 5.3 Reasons for not registering birth by wealth quintile and total, 2007 144
Figure 5.4 Type of work among all working children in urban and rural areas, 2009 (%) 153
Figure 5.5 Proportion of children aged 10–17 years who are working, by province, 2009 155
Figure 5.6 Reported human trafficking cases in Indonesia, 2004–2009 162
Figure 5.7 The childcare system in Indonesia 165
Figure 5.8 Budget allocations for social rehabilitation, 2009 168
Figure 5.9 Disadvantaged children receiving social assistance, 2006–2009 169
Figure 5.10 Disadvantaged children served by residential social care, 2006–2009 169
Figure 5.11 Parental status of children living in childcare institutions, 2007 170
Figure 6.1 Clusters of poverty reduction programmes 177
Figure 7.1 Selected indicators of child deprivation showing disparities among households by
wealth quintiles, 2009 193
Figure 7.2 Disparities in various dimensions of child deprivation across provinces and between
children in urban and rural areas, 2009 194
Figure 7.3 Deprivations in shelter, sanitation, water and school enrolment among children by
List of boxes
Box 2.1 Impacts of external shock to the poor and near poor in urban and rural settings 51
Box 2.2 Living conditions of poor children 60
Box 2.3 Daily activities that children do not like 68
Box 3.1 Factors influencing immunization coverage among poor children in urban and rural areas 99
Box 4.1 The causes of drop out and school discontinuation among poor children aged 13 and
above 128
Box 4.2 Education of poor children living in female-headed households and with parents with
low education levels 134
List of appendices
Appendix 1 Methodology 200
Appendix 2 Profiles of case study locations 218
Appendix 3 Number of children by province, 2009 229
Appendix 4 Monetary child poverty by province, 2009 230
Appendix 5 Child shelter deprivation by province, 2009 231
Appendix 6 Child deprivation in terms of safe water and health by province, 2009 232
Appendix 7 Child educational deprivation by province, 2009 233
Appendix 8 Child labour by province, 2009 234
Appendix 9 Children deprivation in access to a birth certificate by province, 2009 235
Appendix 10 Number of children and child income poverty by district, 2009 236
Appendix 11 Child deprivation in shelter, sanitation and water dimensions by district, 2009 248
List of abbreviations
ABPP
ADB
AFC
ANC
APBD
APBN
ARI
ART
ASEAN
Askes
Askeskin
BAPPENAS
BCG
BI
BKKBN
BLM-KIP
BLT
BMI
BNP2TKI
BOS
BPS
BSM
BULOG
BUMN
CCT
CPI
CRC
CSO
CWI
Anggaran Belanja Pemerintah Pusat
Anggaran Pendapatan dan Belanja Daerah
Anggaran Pendapatan dan Belanja Negara
Asuransi Kesehatan
Asuransi Kesehatan Masyarakat Miskin
Badan Perencanaan Pembangunan Nasional
Bank Indonesia
Badan Koordinasi Keluarga Berencana
Nasional
Bantuan Langsung Masyarakat-Keringanan
Investasi Pertanian
Bantuan Langsung Tunai
Badan Nasional Penempatan dan
Perlindungan Tenaga Kerja Indonesia
Bantuan Operasional Sekolah
Badan Pusat Statistik
Bantuan Siswa Miskin
Badan Urusan Logistik
Badan Usaha Milik Negara
Central Government Budget Expenditure
Asian Development Bank
Asian financial crisis
Antenatal care
The Provincial/District Revenue and
Expenditure Budget
The National Revenue and Expenditure
Budget
Acute respiratory infection
Antiretroviral therapy
Association of Southeast Asian Nations
Health Insurance
Health Insurance for the Poor
National Development Planning Agency
Bacillus Calmette-Guérin (antituberculosis
vaccine)
Indonesia Central Bank
National Family Planning Coordinating
Board
Direct Community Financial Assistance for
Agricultural Investment
Unconditional Cash Transfer
Body Mass Index
The National Agency for Placement and
Protection of Indonesian Migrant Workers
School Operational Assistance
Statistics Indonesia
Scholarship for Poor Students
The National Food Logistics Agency
State-owned enterprise
Conditional Cash Transfer
Corruption Perception Index
Convention on the Rights of the Child
Civil Society Organization
DAK
DAU
DOD
DPD
DPR
DPT
DSR
DT
Ebtanas
ECE
FGD
FITRA
GDP
GER
GFC
GNI
GoI
GSC
HB
HIV/AIDS
ICLS
IDAI
IDHS
IDR
IFLS
ILO
IMCI
IMR
INAC
IOM-Indonesia
IPL
IYCF
Jamkesda
Jamkesmas
Dana Alokasi Khusus
Dana Alokasi Umum
Dewan Perwakilan Daerah
Dewan Perwakilan Rakyat
Evaluasi Belajar Tahap Akhir Nasional
Forum Indonesia untuk Transparansi
Anggaran
Generasi Sehat dan Cerdas
Ikatan Dokter Anak Indonesia
Jaminan Kesehatan Daerah
Jaminan Kesehatan Masyarakat
Specific Allocation Funds
General Allocation Fund
Dropout Or Discontinuation
Regional Representative Council
People’s Representative Council
Diphtheria, pertussis, tetanus
Debt-to-Service Ratio
Diphtheria and tetanus
National Final Examination
Early Childhood Education
Focus Group Discussion
The Indonesian Forum for Budget
Transparency
Gross Domestic Product
Gross Enrolment Rate
Global financial crisis
Gross National Income
Government of Indonesia
Healthy and Smart Generation
Hepatitis B
Human Immunodeficiency Virus/Acquired
Immune Deficiency Syndrome
Indonesian Child Labour Survey
The Indonesian Pediatric Association
Indonesia Demographic and Health Survey
Indonesian rupiah
Indonesian Family Life Survey
International Labour Organization
Integrated Management of Childhood
Illness
Infant Mortality Rate
Indonesia National AIDS Commission
International Organization for Migration –
Indonesia
International poverty line
Infant and Young Child Feeding
Local Government funded Health Insurance
for the Poor
Jampersal
JURIM
KIA
KK
KMS
Komnas
HAM
KPAI
KPAN
KTP
KUR
LKSA
MA
MDG
MI
MoH
MoHA
MoNE
MoSA
MoWE&CP
MP-ASI
MPS
MR
MTs
NAC
NAC-WFCL
NAD
NAP-WFCL
NER
NGO
NICE
NPL
NTB
Jaminan Persalinan
Juru Imunisasi
Kartu Ibu dan Anak
Kartu Keluarga
Kartu Menuju Sehat
Komisi Nasional Hak Asasi Manusia
Komisi Perlindungan Anak Indonesia
Komisi Penanggulangan AIDS Nasional
Kartu Tanda Penduduk
Kredit Usaha Rakyat
Lembaga Kesejahteraan Sosial Anak
Madrasah Ahliyah
Madrasah Ibtidaiyah
Makanan Pendamping Air Susu Ibu
Madrasah Tsanawiyah
Nanggroe Aceh Darussalam
Nusa Tenggara Barat
Birth delivery Insurance Scheme
Vaccination staff
Mother and Child Health Card
Family Cards
Child’s Road to Health Card
Indonesian National Commission On
Human Rights
Indonesian Commission for Child Protection
Indonesian National AIDS Commission
(INAC)
(Residential) Identity card
Loan for small business
Children’s social welfare institution
Islamic senior high school
Millennium Development Goal
Islamic primary school
Ministry of Health
Ministry of Home Affairs
Ministry of National Education
Ministry of Social Affairs
Ministry of Women’s Empowerment and
Child Protection
Complementary food to mother’s milk
Making pregnancy safer
Mortality rate
Islamic junior high school
National AIDS Commission
National Action Committee for the
Elimination of the Worst Forms of Child
Labour
Aceh Province
National Action Plan for the Elimination of
the Worst Forms of Child Labour
Net enrolment rate
Nongovernmental organization
Nutrition Improvement through Community
Empowerment
National poverty line
NTT
OPK
P2DTK
P2KP
P2TP2A
P4K
PAUD
PAMSIMAS
PCR
PD3I
PHBS
PIN
PISEW
PKBM
PKH
PKK
PKSA
PLHA
PMTCT
PNBAI
PNPM
POLDA
Polindes
POLRES
Poskesdes
Posyandu
PPH
Nusa Tenggara Timur
Operasi Pasar Khusus
Program Percepatan Pembangunan Daerah
Tertinggal dan Khusus
Program Penanggulangan Kemiskinan di
Perkotaan
Pusat Pelayanan Terpadu Pemberdayaan
Perempuan dan Anak
Program Perencanaan Persalinan dan
Pencegahan Komplikasi
Pendidikan Anak Usia Dini
Penyediaan Air Minum dan Sanitasi
Berbasis Masyarakat
Penyakit Yang Dapat Dicegah Dengan
Imunisasi
Perilaku Hidup Bersih dan Sehat
Pekan Imunisasi Nasional
Program Infrastruktur Sosial Ekonomi
Wilayah
Pusat Kegiatan Belajar Masyarakat
Program Keluarga Harapan
Pembinaan Kesejahteraan Keluarga
Program Kesejahteraan Sosial Anak
Program Nasional Bagi Anak Indonesia
Program Nasional Pemberdayaan
Masyarakat
Kepolisian Daerah
Pondok Bersalin Desa
Kepolisian Resor
Pos Kesehatan Desa
Pos Pelayanan Terpadu
Pola Pangan Harapan
East Nusa Tenggara Province
Special Market Operation
The Development Acceleration Programme
for Disadvantaged and Special Regions
Urban Poverty Reduction Programme
Integrated Services Centre for Women and
Children Empowerment
Birth Preparedness and Complication
Prevention Programme
Early Childhood Education (ECE)
Community-based sanitation and drinking
water provision
Polymerase Chain Reaction
Diseases preventable by immunization
Clean and healthy lifestyle behaviours
National Immunization Week
Regional Socio-economic Infrastructure
Development Programme
Community Learning Centre
Household CCT
Movement for Family Empowerment and
Welfare
Social Welfare Programme for Children
People living with HIV/AIDS
Preventing Mother-to-Child Transmission of
HIV
National Programme for Indonesian
Children
National Programme for Community
Empowerment
Regional police station
Village maternity clinic
District level police office
Village health post
Integrated health services post
PPIP
PPKn
PPL
PPP
PPT/PKT
PUAP
Puska PA
Puskesmas
Puskesmas
keliling
Pustu
RA
RAN
RAN-P3A
RAN-PESKA
RAN-PG
Raskin
Renstra
RISKESDAS
RKP
RPJMN
RPK
RPSA
RPTC
RT
RTSM
RW
SAKERNAS
Satpol PP
SBI
SD
SDC
SDO
Seknas
Program Pembangunan Infrastruktur
Perdesaan
Pendidikan Pancasila dan Kewarganegaraan
Pusat Pelayanan Terpadu/Pusat Krisis
Terpadu
Pengembangan Usaha Agribisnis Perdesaan
Pusat Kajian Perlindungan Anak
Pusat Kesehatan Masyarakat
Puskesmas Pembantu
Raudatul Athfal
Rencana Aksi Nasional
Rencana Aksi Nasional Pemberantasan
Perdagangan Perempuan dan Anak
Rencana Aksi Nasional Pemberantasan
Eksploitasi Sosial Anak
Rencana Aksi Nasional Pangan Dan Gizi
Beras Untuk Rumah Tangga Miskin
Rencana Strategis
Riset Kesehatan Dasar
Rencana Kerja Pemerintah
Rencana Pembangunan Jangka Menengah
Nasional
Ruang Pelayanan Khusus
Rumah Perlindungan Sosial Anak
Rumah Perlindungan Trauma Center
Rukun Tetangga
Rumah Tangga Sangat Miskin
Rukun Warga
Survei Angkatan Kerja Nasional
Satuan Polisi Pamong Praja
Sekolah Berstandar Internasional
Sekolah Dasar
Subsidi Daerah Otonom
Sekretaris Nasional
Rural Infrastructure Development
Programme
Pancasila morality and citizenship education
Provincial poverty line
Purchasing power parity
Integrated services centre/Integrated crisis
centre
Development of rural agribusiness
Centre for Child Protection Studies
Community health centre
Mobile health centre
Village health post
Islamic kindergarten
National Action Plan
National Plan of Action for the Elimination
of Trafficking of Children and Women
National Plan of Action for the Elimination
of Sexual Exploitation of Children
National Action Plan for Food and Nutrition
Rice for Poor Households
Strategic plan
Basic Health Research
Government Work-Plan
National Medium-Term Development Plan
Special services rooms
Social protection homes for children
Trauma and healing centres
Neighbourhood units
Very poor households
Unit of local administration consisting of
several RT
National Labour Force Survey
Civil service police unit
International-standard school
Primary school
Social Development Centres
Subsidy for Autonomous Regions
SER
SITAN
SKTM
SMA
SMK
SMP
SPM
SSN
SUPAS
SUSENAS
TB
TESA 129
TIMMS
TK
TKPK
TNP2K
TT
U4
U4MR
U5
U5MR
UAN/UN
UC
UCI
UNDP
UNICEF
Unit PPA/
UPPA
UPT
UPTD
UU
UUD 1945
VCT
WFC
WFCL
WHO
Surat Keterangan Tidak Mampu
Sekolah Menengah Atas
Sekolah Menengah Kejuruan
Sekolah Menengah Pertama
Standar Pelayanan Minimum
Survei Penduduk Antarsensus
Survei Sosial Ekonomi Nasional
Telepon Sahabat Anak 129
Taman Kanak-kanak
Tim Koordinasi Penanggulangan
Kemiskinan
Tim Nasional Percepatan Penanggulangan
Kemiskinan
Ujian (Akhir) Nasional
Unit Pelayanan Perempuan dan Anak
Unit Pelaksana Teknis
Unit Pelaksana Teknis Daerah
Undang-Undang
Undang-Undang Dasar 1945
School enrolment rate
Situation Analysis
Relief letter for the poor to get access to
health care at hospitals
Senior high school
Vocational high school
Junior high school
Minimum service standards
Social safety net
Intercensal Population Survey
National Socio-Economic Survey
Tuberculosis
Child Helpline 129
Trends in International Mathematics and
Science Study
Kindergarten
Coordinating Team For Poverty Reduction
National Team for Accelerating Poverty
Reduction
Tetanus toxoid
Under-four
Under-four mortality rate
Under-five
Under-five mortality rate
National examination system
Universal coverage
Universal child immunization
United Nations Development Programme
United Nations Children’s Fund
Women’s and Children’s Service Unit
Technical Implementation Unit
Regional Technical Implementation Unit
Law
The Indonesian Constitution
Voluntary Counseling and Testing
World Fit for Children
Worst forms of child labour
CHILD POVERTY
AND DISPARITIES
IN INDONESIA:
THE CHALLENGE
FOR INCLUSIVE
GROWTH
Executive Summary
T
his report deliberates the multiple dimensions of poverty and disparities faced by children in Indonesia. This report also advocates for poverty reduction policies and programmes that are more child-focused. These analyses and recommendations are aimed at supporting the realization of the rights of all children in Indonesia, as formally guaranteed by the Indonesian Constitution (Undang-Undang Dasar 1945, UUD 1945). This report specifically addresses the problem of a inequalities that persist despite progress at the aggregate or national level. There have been intensified efforts and new policies, plans and programmes aimed at fulfilling the rights of children without discrimination during the last decade in Indonesia. But in spite of this, the size of the country, the unequal distribution of natural resources and infrastructure facilities, the decentralized government and political system it adopts, and the poverty problem have all created inequalities and challenges for the fulfilment of child rights in Indonesia.
The analysis presented in this report is based mainly on data available from the 2010 national data sets, which include the 2003 and 2009 National Socio-Economic Survey (SUSENAS), the 2002/2003 Indonesian Demographic and Health Surveys (IDHS), the 2007 and 2010 Basic
Health Research (RISKESDAS) surveys, the 2004 and 2009 National Labour Force Survey (SAKERNAS) and the 2009 Indonesia Child Labour Survey (ICLS). In addition, data were sourced as needed from the official statistics of relevant line ministries and non-government organizations, relevant official documents related to the government’s policies and programmes, and relevant studies and assessments. Finally, small qualitative case studies were carried out in two kelurahan (urban precincts) in Jakarta Utara (North Jakarta) and two rural villages in Sumba Timur (East Sumba), between July 2010 and May 2011. The approach and methods used for this study of child poverty and disparities follow the UNICEF Global Study on Child Poverty and Disparities 2007–2008 Guide (UNICEF, 2008), with some modification to adjust for data availability and the Indonesian context.
Children and development
the total population of approximately 237.6 million people in 2010,1 about 81.3 million are children aged under 18 years, including 39.5 million girls and 41.9 million boys. Indeed, the proportion of children in Indonesia decreased from 43 per cent in 1990 to 34 per cent in 2010. Regional distribution is an important issue as children (and the population in general) are not distributed evenly across the country; more than half (54 per cent) live in Java, the country’s most densely populated island. Also, approximately 54 per cent of all children live in rural areas,
Box A: Children in Indonesia –
Basic Statistics
Number of children (aged below 18 years): 81.3 million (2010)
• Residencearea:rural54%;urban46% • Sexratio(female:male):94.6:100
Distributionofpopulationaged0–19years
(2010):
• Provinceswiththelargestnumberof children:WestJava(16.4million),EastJava (12.2million),CentralJava(11.2million) • Provinceswiththesmallestnumberof
children:WestPapua(329thousand), Gorontalo(436thousand),BangkaBelitung Islands(463thousand)
Proportionofhouseholds(2009):
• Withchildren:72%(urban70%,rural74%) • Numberofchildren:1–2(55%),3–4(15%),5+
(3%)
Statusinrelationtohouseholdhead(2009): Children(83.9%),grandchildren(12.8%), relatives(2.7%),domesticworkers(0.2%), householdheadandspouse(0.12%),son/ daughterinlaw(0.09%)
Source:EstimatedfromSUSENAS(2009)and PopulationCensus(2010)
which is slightly larger than the 52 per cent of the overall population living in rural areas (2009 data). The trend shows increasing urbanization of children, however, as the proportion of urban children increased from 40 per cent in 1990 to 46 per cent in 2009.
Children have always been at the centre of Indonesia’s development agenda, and the efforts towards fulfilling the rights of children without discrimination have been intensified since 200 with the democratization reform process. The past ten years have been marked with the enactment of various laws and regulations pertaining to children’s rights. The development of children’s well-being has also been one of the priorities of the Government of Indonesia (GoI) in the last two National Medium-Term Development Plans (RPJMN), and the rights of children are now included among the issues to be mainstreamed into the development priorities of the 2010–2014 RPJMN, with emphasis on the areas of education, health and poverty reduction.
The development process for children in Indonesia is clearly influenced by the country’s political, economic and social contexts as well as macroeconomic policies. The major national processes and challenges that influence the efforts to fulfill the rights of all children include:
1. A decade of democratization and decentralization reforms in Indonesia that saw a series of amendments to the Indonesian Constitution during 1999–2002. These amendments laid very clear and strong foundations for the promotion and protection of human rights, including the rights of children, as inserted in Article 28B (clause 2) of the Constitution. In general, the democratic reforms are intended to increase the checks and balances in both policymaking and programme implementation. The reforms were also meant to lay the foundation for a more inclusive and equitable development process, including those aspects pertaining to children. In addition, the amended Constitution also rendered a far-reaching
devolution of most government functions to district governments (kabupaten/ kota) and provided special autonomy for the provinces of Aceh and Papua. This places on the shoulders of the district governments the responsibility for delivering most public services, including health, education and culture, social welfare and labour force development. Along with the devolution of government functions, the central government has also increased the transference of funds to regional governments – from 13 per cent of central government expenditure in 2000 (before decentralization) to around 30 per cent in 2010.
2. Indonesia has achieved rather limited progress in the rule of law and good governance, despite the major decentralization and democratization reforms aimed at better governance. The existing political institutions are weak, the intergovernmental division of functions is unclear, the capacity of most regional governments is poor, and the capacity of non-government organizations is also lacking. These weaknesses have hindered the realization of good governance and good public service delivery. Governments at the national and local levels often fail to provide the services they are supposed to, especially services to the poor or those targeted at poverty reduction, despite the substantial weight of programmes being allocated specifically for this purpose. This has been further weakened by the widespread movement for provinces and districts to split, which led to the formation of 7 new provinces and 156 new districts between 2001 and 2010, each requiring its own government, and most facing a serious lack of infrastructure, financial and human resources.
3. Good economic progress has been made, but limited capacity in providing adequate job opportunities persists. Indonesia has moved to be one of the lower-middle income countries in 2010 with per capita gross national income (GNI) around US$2,963 (Indonesia Central Bank, 2010). It has also proven resilient, surviving the pressures of the 2008/2009 global financial crisis (GFC). This economic progress has been accompanied by growth in the manufacturing and service sectors, which now account for a larger share of the economy. However, the provision of sufficient job opportunities is still
problematic. Although unemployment rates have been kept low, at around 7 per cent in 2010, almost 70 per cent of the employed are working in the informal sector. The proportion of the workforce employed in agriculture is still greater than the proportion involved in manufacturing. And while more women are entering the labour market,
BoxB:Incomepovertyin
Indonesia
Percentagesofpeoplelivingbelow: Internationalpoveryline(IPL): • IPL$1PPP/capita/day:5.9%(2008) • IPL$2PPP/capita/day:42.6%(2008) Nationalpovertyline(NPL):14.2%(2009) NumberofpeoplelivingbelowNPL: approximately32.5millionpeople(2009) Povertyindexes:
• Povertygapindex(P1):2.5% • Povertyseverityindex(P2):0.68% Urban:
• Povertyrate(belowNPL):10.72% • Giniratio:0.362
Rural:
• Povertyrate(belowNPL):17.35% • Giniratio:0.288
Provinceswiththehighestnumbersofpoor
people:
EastJava(6.2million),CentralJava(5.7 million),WestJava(5.0million)
Provinceswiththehighestpovertyrates: Papua(37.5%),WestPapua(35.7%),Maluku (28.2%)
BoxC:Childreninincomepoverty
inIndonesia(2009)
Distribution of children by household
expenditurequintiles:Q1(poorest)28%;Q2 23%;Q320%;Q417%;Q5(richest)13%
Numbersofchildrenlivingbelow: • IPL$2PPP/capita/day:44.3million • NPL:13.8million
• IPL$1PPP/capitaperday:8.4million
2003–2009trendsin%ofchildrenlivingbelow: • IPL$1PPP/capita/day:declinedfrom12.75%
to10.63%
• NPL:declinedfrom23.44%to17.35% • IPL$2PPP/capita/day:declinedfrom63.5%to
55.78%
Disparities:
• Morethan50%ofpoorchildrenresideinJava
and Bali
• Provinceswheremorethan25%ofchildren liveinextremepoverty(belowIPL$1PPP/ capita/day):EastNusaTenggara(36.2%)and Gorontalo(32.2%)
• 20%ofchildreninhouseholdswherethe
household head did not complete primary
schoolwereinextremepoverty,comparedto just2.8%ofchildreninhouseholdsheadedby peoplewhoinishedseniorsecondaryschool, and0.5%ofchildreninhouseholdsheaded bysomeonewithauniversity/collegediploma • 15.8%ofchildreninruralareawerein
extremepoverty,comparedto4.6%of
children in urban areas
• 13%ofchildreninfemale-headedhouseholds wasinextremepoverty,comparedto10%of childreninmale-headedhouseholds
Source:EstimatedfromSUSENAS,2003and 2009
they are mostly absorbed by the informal sectors. The number of international migrant workers, who are mostly women with limited skills, is also increasing.
4. Indonesia has made good progress in reducing income poverty, but many people are still vulnerable to falling into poverty. At the national level, the number one MDG target of reducing extreme poverty has been achieved. However, more than 40 per cent of the population still lives below the international poverty line (IPL) of US$2 purchasing power parity (PPP) per capita per day and are thus vulnerable to economic shocks which could cause them to fall deeper into poverty. Poverty in Indonesia remains a predominantly rural phenomenon, despite the increasing urban population and the higher income inequality within urban populations. Income poverty also varies across provinces. Although most of the poor are living in the most densely populated island of Java, the poverty rates in the provinces of eastern Indonesia remain among the highest. The provincial performance in terms of reduction in poverty rates also varies considerably and there appears to be no clear correlation between progress in reducing poverty and economic growth at the province level.
Children in income-poor households
On average, the number of children in a poor household is higher than in a wealthier household; or in other words, children form a larger proportion of all household members in poor households. Also, the proportion of all Indonesian children who live in income-poor households is higher than the proportion of poor people in the general population, indicating that children suffer disproportionately from poverty in Indonesia. This analysis is based on household level expenditure data, such that the income poverty status of a child is attached to that of the household. The poverty rates that result from this method (see Box C) may slightly underestimate the real level of income poverty among children in Indonesia because a tiny fraction of children living in relatively wealthy households are domestic workers and also SUSENAS data do not include children living on the street or in childcare institutions.
The proportion of children living in income poverty declined between 2003 and 2009, by all poverty benchmarks, i.e., the international poverty lines (IPL) below US$1 and $2 PPP per capita per day (extreme poverty and decent life standard), and the national poverty line (NPL). The rate of reduction of children living below IPL $1, however, was less sensitive to the reduction of extreme poverty in general. Despite the decreasing rate, it was estimated that in 2009 around 44.3 million children were living on less than the equivalent of $2 per capita per day, of which 13.8 million lived below the NPL and 8.4 million children lived in extreme poverty (below $1 per capita per day). Efforts to address income poverty among Indonesian children invariably raise a geographical dilemma because the largest number of poor children (more than 50 per cent of Indonesia’s poor children) resides in Java, while the provinces in the eastern part of Indonesia have the highest rates of poverty, including child poverty, but smaller populations. The variations in child poverty rates across districts within provinces are even more pronounced. Inequalities were particularly high within the provinces of Papua, West Papua, Aceh, North Sumatra, West Sumatra and Maluku.
The prevalence of income poverty in children correlates with household size, gender of the household head, educational background of the household head and urban/rural location. Child poverty rates tend to increase with household size. Around one out of every four children, who live in households that have four or more children per adult, or that have elderly dependents aged 70 years or more, fell below the NPL in 2009. Poor children are more likely to be found within female-headed households. Notably, girls are less likely than boys to live in income-poor households. The educational background of the head of household is also positively associated with improved status of household members with regard to poverty, including children. The child poverty rates were higher in rural areas than in urban areas. The urban/rural poverty gap is more pronounced in terms of child poverty than it is when one looks at overall population poverty rates.
Children experiencing multiple
deprivations
The analysis of the multiple dimensions of deprivation among children – education, labour participation, health, shelter, sanitation, and water – uncovers an even more challenging picture. An analysis using 2009 SUSENAS data shows that only approximately 18.3 per cent of Indonesian children were free from all six deprivation dimensions. Approximately 30.6 per cent of children were deprived in one dimension, 29.1 per cent in two dimensions, 18.5 per cent in three dimensions, 6.6 per cent in four dimensions, 1.3 per cent in five dimensions, and 0.07 per cent deprived in six dimensions. The most common type of deprivation suffered was being deprived of sanitation followed by clean water.
children aged 7–17 years who are not enrolled in formal primary or secondary school. The labour participation component measures children performing economic work but not going to school and children performing economic work and also attending school. The health dimension is measured from self-reported work/school disruption due to ill health, and self-reported diarrhea and/or asthma. The shelter indicator is measured by assessing the numbers of children living in a house with a floor area less than 8 square meters per person, children living in a house with an earth floor, and children living in a house without access to electricity. The sanitation dimension is measured by the number of children without access to a proper toilet. The water dimension is measured by the number of children without access to clean water.
The analysis on the proportion of children deprived in each dimension by household income quintiles confirms the link between monetary and non monetary poverty. The proportion of children deprived in any dimension decreases as the household income level
increases (from children in the poorest quintiles (Q1) to children in the richest quintiles (Q5)). Furthermore, the proportion of children who were free from any deprivation increased along with the quintiles of households’ income. There were only 4.95 per cent of children in quintile 1 who were free from any deprivation, while in contrast there were 39.76 per cent of children in quintile five who were free from any of deprivation.
Deprivation in shelter, water and
sanitation
Considerable progress has been made in
children’s access to proper shelter and sanitation, but not in terms of access to improved and protected water sources. During the period from 2003 to 2009, the percentage of children deprived of adequate shelter has steadily declined:
earth-floor houses (-8.6 per cent), inadequate house area (-28.7 per cent), and lack of electric connection (-51.7 per cent). Similarly, in the same period, the proportion of children living in houses without proper toilets decreased by 33.7 per
BoxD:Childdeprivationinshelter,
sanitation and water
Trends(2003–2009):
• Liveinhouse<8m2/person:declinedfrom 25.15%to23.9%
• Liveinhousewithearthloor:declinedfrom 15.09%to10.76%
• Noelectricity:declinedfrom15.5%to7.49% • Nopropertoilet:declinedfrom53.67%to
35.6%
• Withoutaccesstoimprovedandprotected watersources:increasedfrom29.3%to35.1%
Disparitiesacrossprovinces:
• Liveinhouse<8m2/person:66.5%(Papua)– 7.3%(CentralJava)
• Liveinhousewithearthloor:38.6%(NTT)– 1.18%(BangkaBelitung)
• Noelectricity:53%(Papua)–0.11%(Jakarta) • Nopropertoilet:63%(WestSulawesi)–5.5%
(Jakarta)
• Noaccesstocleanwater:85%(West Kalimantan)–23%(Jakarta)
Source:EstimatedfromSUSENAS2003and 2009
cent. The proportion of children living in houses without access to improved and protected water sources increased by approximately 19.9 per cent. Indeed, around one out of three children in Indonesia has no access to proper sanitation or a safe source of water.
Deprivation in shelter, sanitation and water were all strongly associated with: (1) the economic status of the household; (2) the urban/rural gap; (3) the education level of the household head; and (4) the household size. The gender of the household head was not significantly associated. The gap between the poorest and richest
quintiles was the most obvious. More than half of the children in the poorest welfare quintile lived in inadequate shelter and had no access to sanitation, while only 10 per cent of children in the richest quintile suffered from shelter deprivation, and 5 per cent had no access to proper sanitation. An urban/rural disparity also persisted, particularly in regard to sanitation. The poor children living in urban areas, however, are also severely deprived, almost to the same extent as those living in rural areas. Meanwhile, the differences between deprivation among children from households headed by graduates from university/college and those from
households headed by less educated people were also quite striking. On the other hand, household size did not seem to affect deprivation in terms of sanitation and access to improved and protected water sources.
Non-material deprivation
Non-material well-being represents an important aspect of children’s rights and Indonesia’s 2003 Child Protection Law asserts that children are entitled to adequate rest and leisure time, to play with their peers, to have recreation time, and be creative in accordance with their interests, talents and capacity, in order to grow up well (Article 11, Clause 3). Unfortunately, few indicators of non-material dimension are captured in the available national data sets. An aspect of deprivation that is available in the SUSENAS data is the interaction between children and parents. The 2009 SUSENAS data revealed that the most frequent activities conducted by children with their parents are watching television and eating, followed by studying and playing. In addition, the IFLS captures the frequency of children meeting with both parents and other means they use to communicate (if not face to face). The IFLS data for 2000 and 2007 shows that only a small proportion (around 10 per cent) of children met with both of their parents on a daily basis, while
around 20 per cent of children did not meet at all with either of their parents. In rural areas, the percentage of children who met with both parents only once a year increased from 23.6 per cent in 2000 to 31.9 per cent in 2007. This might be related to increasing numbers of domestic workers and international migrant workers from Indonesia, causing many Indonesian children living in rural areas to be separated from their parents.
Some aspects of non-material deprivation can be inferred from other available dimensions, such as child engagement in paid and unpaid labour, children who are victims of criminal acts, and child marriage. Child marriage can be considered as a form of non-material deprivation since marriage will entail new responsibilities and limit a child’s opportunity to enjoy many aspects of their childhood rights. The 2010 RISKESDAS data reveal the following interesting facts: around 7.4 per cent of girls aged 10–14 and around 15.8 per cent of girls aged 15–19 were pregnant at the time of the survey (2010); 0.1 per cent of boys and 0.2 per cent of girls aged 10–14 years were already married; and at the age of 15–19 years, 1.6 per cent of the boys and 11.7 per cent of the girls were also married. The age group disaggregated data show a decreasing proportion of married girls amongst younger age groups. The prevalence of child marriage seems to correlate with household economic background. The proportions of women from the poorest quintile who were married before the ages of 15 and 18 years were double the proportions in the richest quintile; and a larger proportion of child marriage was found in households with at least one child labourer and in single-parent households.
poor services due to the limited or lack of public facilities. Poor children in the rural study area (East Sumba) experienced more material problems than poor children in the urban area (North Jakarta) due to inadequate basic facilities (education, health care, etc.) and their remote locations. Even so, some aspects of non-material deprivation are generated from other material deprivation, such as the lack of physical access to education and health facilities. Overall, in both East Sumba and North Jakarta, the most prominent non-material deprivations facing poor children were related to inadequate leisure time and vulnerability to potential violence from their parents, elder siblings, teachers or community members. The children’s feelings of happiness and discontent also varied across seasons and events. The non-material components of well-being are more varied than the material components. Among the non-material components, affection from their parents and good relations with their extended family are quite dominant, followed by achievement in and outside of school, and recognition for this.
Health and nutrition
Indonesia has made some considerable achievements in improving the health status of children. The infant mortality rate (IMR) and under-five mortality rate (U5MR) in Indonesia have significantly declined and are on track to achieve the 2015 MDG targets. However, efforts to further reduce these rates are likely to be more challenging since the speed of the reduction has been decelerating: the IMR reduction slowed down from an annual average of 3.9 per cent during 1990–1999 to 0.5 per cent during 1999– 2007; and the U5MR annual average reduction declined from 4.4 per cent during 1990–1999 to 2.8 per cent during 1999–2007. In addition, the reductions are not evenly shared across regions. Out of the 33 provinces in Indonesia, 26 provinces had IMR and U5MR higher than the national level. In addition, the rates were also higher among lower income groups and among rural children.
Improved child survival has been supported by improvements in immunization coverage. Yet still around 44 per cent of children did not
BoxE:Childsurvivalandhealth
Trends:
• IMR(1990–2007):declinedfrom71to34(per 1,000livebirths)
• U5MR(1990–2007):declinedfrom99to44 (per1,000livebirths)
• Infants<6monthsnotexclusivelybreastfed (2002/2003–2007):increasedfrom60.5%to 67.6%
• Childrenwithoutcompleteimmunization (2002/2003–2007):declinedfrom48.5%to 41.4%
• Childrenaged12–24monthswithoutmeasles immunization(2007–2010):increasedfrom 18.4%to25.5%
• Under-ivessufferfromstunting(2007–2010): declinedfrom38.8%to35.6%
• Under-ivessufferfromwasting(2007–2010): declinedfrom13.6%to13.3%
Disparityacrossprovinces:
• IMR(2007):74(WestSulawesi)–19
(Yogyakarta)
• U5MR(2007):96(WestSulawesi)–24
(Yogyakarta)
• Measlesimmunizationcoverage(2010): 47.4%(Papua)–96.4%(Yogyakarta)
Genderdisparity(2007):
• NeonatalMR:19(girls)–24(boys) • Post-neonatalMR:16(girls)–19(boys) • U5MR:46(girls)–59(boys)
Source:IDHS2002/2003;RISKESDAS2007and
2010