Document # 15034858 v01 Page 1
Human mtDNA D-loop Hypervariable
Region
For the Illumina Sequencing Platform IMPORTANT NOTICE
This document provides information for an application for Illumina technology that has been
demonstrated internally and may be of interest to customers. This information is provided as‐is and is not an Illumina product and is not accompanied by any rights or warranties. Customers using or adapting this information should obtain any licenses required and materials from authorized vendors. Illumina products mentioned herein are for research use only unless marked otherwise, and are subject to any and all applicable terms and conditions of use. While customer feedback is welcomed, not all components of this application are supported by Illumina Technical Support and Field Application Scientists.
Revision History 1
Introduction 3
Workflow 5
Perform First Amplification 6
Perform First DNA Clean Up 9
Quantify DNA 11
Tagment Input DNA 13
Perform Second Amplification 15
Perform Second DNA Clean Up 18
Bead‐based Normalization 20
Pool Bead‐Based Normalized Libraries 22
Bioanalyzer‐based Normalization 23
Pool Bioanalyzer Normalized Libraries 25
Next Steps for Sequencing and Analysis 26
mtDNA Variant Processor BaseSpace App 27
mtDNA Variant Analyzer BaseSpace App 36
MiSeq Reporter 44
Revision History
Document Date Description of Change
Document #
15034858 v01 February2016 For the first PCR amplification, corrected the volume of MgClsolution per sample from 20 µl to 1.5 µl per sample, the volume2 for primer pairs in the PCR master mix from 4 µl to 2 µl, and the volume of nuclease‐free water in the PCR master mix from 34.7 µl to 34.2 µl.
For the first PCR amplification, removed the step to dilute primers A and B, and added that each PCR primer is 100 µM in 1xTE, pH 8.0.
Updated drying times for the first DNA cleanup from 15 minutes to 2 minutes.
Added a safe stopping point after quantification.
Removed the Dual Indexing Principle section and Low Plexity Pooling Guidelines section.
Updated PCR conditions and the Edit Manfiest section. Clarified analysis requirements.
Added directions for using the BaseSpace mtDNA Processor App and the BaseSpace mtDNA Variant Analyizer App.
Added tips and techniques section.
For the Perform Second DNA Clean Up, replaced midi plate labeled LNP with TCY plate labeled CAN for the final transfer step and also added directions to transfer supernatent from CAA to CAN plate.
Added the following to the consumables and equipment list: • MiSeq FGx
• MiSeq Reagent Kit v3 • MiSeq FGx Reagent Kit v3
• Nextera XT DNA Library Prep v2 kits • Optional microplate shakers
Revised legal notice.
For Bead‐based Normalization:
• Added midi plate to user‐supplied Consumables and Equipment List
• Added instructions to label midi plate LNP Added MiSeq Reagent Kit v3 and updated index kits. Removed dual indexing section.
Updated incubation times for PCR clean up. Updated design of workflow diagram.
Renamed and combined some procedures as needed to improve continuity.
Simplified consumables information at the beginning of each section.
Revised step‐by‐step instructions to be more succinct.
Removed dilute and denature procedures. See theMiSeq System Denature and Dilute Libraries Guide (document # 15039740)and follow the instructions for bead‐based normalization and Nextera XT.
Document Date Description of Change
Part # 15034858
Rev. B October2013 Added Nextera XT DNA Sample Preparation Kit (96 samples) andNextera XT DNA Sample Preparation Index Kits to the consumables list.
Part # 15034858
Rev. A September2013 Initial release.
Introduction
This protocol explains how to prepare, sequence, and analyze the human mitochondrial DNA (mtDNA) D‐loop hypervariable region from DNA samples, including difficult samples, such as blood, saliva, hair, and bone. During sample preparation, the mtDNA D‐loop hypervariable regions are amplified in 4 PCRs that generate 4 overlapping fragments spanning the hypervariable regions. The amplicons are quantified and pooled before library preparation. Subsequent library sequencing on the MiSeq is followed by data analysis.
NOTE
The protocols described in this guide assume that you have reviewed theSupporting Information, on page53and obtained all the required consumables and equipment.
Tips and Techniques
Unless a safe stopping point is specified in the protocol, proceed immediately to the next step.
Avoiding Cross‐Contamination
• When adding or transferring samples, change tips betweeneach sample.
• When adding adapters or primers, change tips betweeneach rowandeach column. • Remove unused index adapter tubes from the working area.
Sealing the Plate
• Always seal the 96‐well plate before the following steps in the protocol: • Shaking steps
• Vortexing steps • Centrifuge steps • Thermal cycling steps
• Apply the adhesive seal to cover the plate and seal with a rubber roller.
• Microseal 'B' adhesive seals are effective at ‐40°C to 110°C, and suitable for skirted or semiskirted PCR plates. Use Microseal 'B' for shaking, centrifuging, and long‐term storage.
• Microseal 'A' adhesive film is effective for thermal cycling and easy to cut when using fewer than 96 wells.
Plate Transfers
• When transferring volumes between plates, transfer the specified volume from each well of a plate to the corresponding well of the other plate.
Centrifugation
• Centrifuge at any step in the procedure to consolidate liquid or beads in the bottom of the well, and to prevent sample loss.
Handling Beads
• Pipette bead suspension slowly. Introduction
• When mixing, mix thoroughly.
• If beads are aspirated into the pipette tips, dispense back to the plate on the magnetic stand and wait until the liquid is clear (~2 minutes).
• When washing beads:
• Use the appropriate magnet for the plate.
• Dispense liquid so that beads on the side of the wells are wetted. • Keep the plate on the magnet until the instructions specify to remove it.
• Do not agitate the plate while on the magnetic stand. Do not disturb the bead pellet.
Prepare for Pooling
If you plan to pool libraries, record information about your samples before beginning library prep. Different methods are available depending on the sequencing instrument you are using. See the Nextera XT Sample Preparation support page for more information.
Workflow
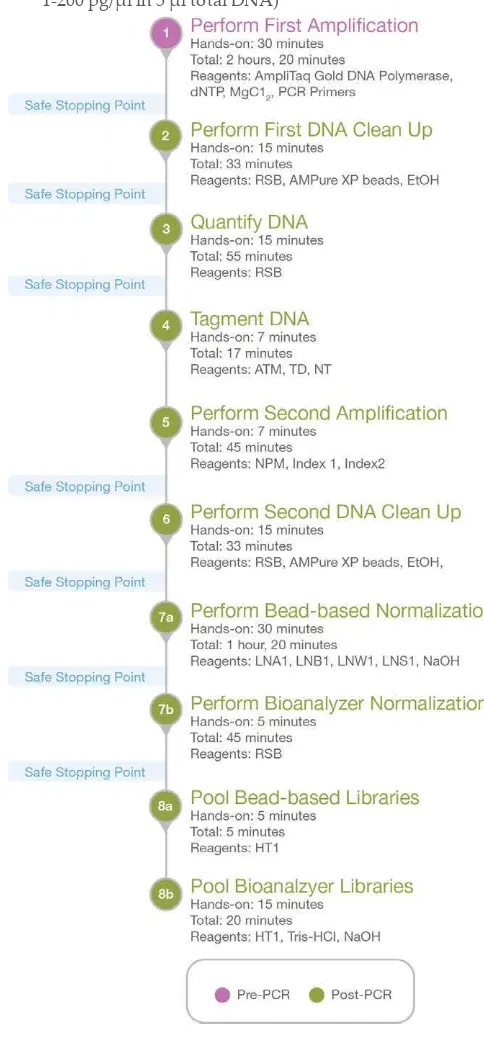
The following figure illustrates the Human mtDNA D‐Loop Hypervariable Region workflow. Figure 1 Human mtDNA D‐Loop Hypervariable Region Workflow (for 12 reactions,
1‐200 pg/µl in 5 µl total DNA) Workflow
Perform First Amplification
This step generates 4 partially overlapping PCR amplicons (~350 bp) spanning the mtDNA D‐loop hypervariable regions. The procedure is for 12 samples (48 reactions).
NOTE
For degraded, difficult samples such as DNA extracted from bones, the DNA must be purified using a column‐based purification system utilizing chaotropic salts, such as DNA Clean and Concentrator‐5 or ‐25 columns before amplification.
NOTE
Twelve samples are used as an example for calculating 1 full column in a 96‐well plate. However, the Agilent High Sensitivity DNA Kit, used during quantification, supports 11 samples.
Consumables
• 96‐well 0.3 ml PCR plate
• AmpliTaq Gold DNA Polymerase (4 µl per sample) • Premixed dNTP Solutions (0.32 µl per sample)
• 25 mM Magnesium chloride solution (MgCl2) (1.5 µl per sample) • Microseal ‘B’ Adhesive Seal
• Nuclease‐free water
• The following PCR Primers (Each primer at 100 µM in 1xTE, pH 8.0)
• (29‐A 29‐B, 172‐A, 172‐B, 285‐A, 285‐B, 408‐A, 408‐B, 15997‐A, 15997‐B, 16159‐A, 16159‐B, 16236‐A, 16236‐B, 16401‐A, 16401‐B)
• Purified Human DNA (1–200 pg/µl) • 1.7 ml microfuge tubes (8)
Preparation
1 Prepare the following consumables.
Item Storage Instructions
AmpliTaq Gold DNA Polymerase ‐25°C to ‐15°C Remove from storage. Keep on ice.
Premixed dNTP Solutions ‐25°C to ‐15°C Thaw at room temperature. 25 mM Magnesium chloride solution (MgCl2) 2°C to 8°C Bring to room temperature. PCR Primers
(29‐A, 29‐B, 172‐A, 172‐B, 285‐A, 285‐B, 408‐A, 408‐B, 15997‐A, 15997‐B, 16159‐A, 16159‐B, 16236‐A, 16236‐B, 16401‐A, 16401‐B)
‐25°C to ‐15°C Thaw at room temperature.
Purified Human DNA ‐25°C to ‐15°C Thaw at room temperature. Perform First Amplification
2 Program a thermal cycler with the following program and save asmt D-loop PCR: • Choose the preheat lid option and set to 100°C
• 96°C for 8 minutes • 10 cycles of:
• 95°C for 30 seconds • 56°C for 25 seconds • 72°C for 40 seconds • 25 cycles of:
• 95°C for 30 seconds • 62°C for 30 seconds • 72°C for 40 seconds • 72°C for 5 minutes
1 In each tube, combine the following and pipette to mix. See table below. • Primer A (25 µl)
• Primer B (25 µl)
• Nuclease‐free water (450 µl)
Tube Label Primer A Primer B
29 29‐A 29‐B
Table 1 PCR Primer A and B Combinations
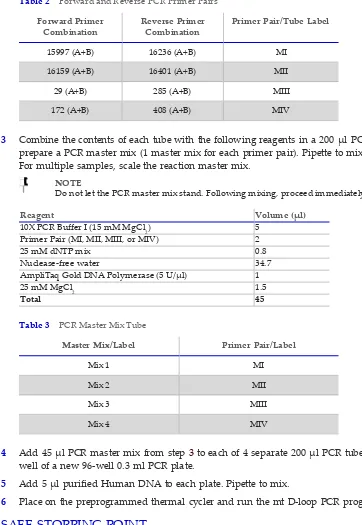
2 Transfer 50 ul from each of the 8 tubes to 4 200 ul PCR tubes to create the following 4 combinations as shown in the table below. Pipette to mix.
Forward Primer
Combination Reverse PrimerCombination Primer Pair/Tube Label
15997 (A+B) 16236 (A+B) MI
16159 (A+B) 16401 (A+B) MII
29 (A+B) 285 (A+B) MIII
172 (A+B) 408 (A+B) MIV
Table 2 Forward and Reverse PCR Primer Pairs
3 Combine the contents of each tube with the following reagents in a 200 µl PCR tube to prepare a PCR master mix (1 master mix for each primer pair). Pipette to mix.
For multiple samples, scale the reaction master mix.
NOTE
Do not let the PCR master mix stand. Following mixing, proceed immediately to step4.
Reagent Volume (µl)
10X PCR Buffer I (15 mM MgCl2) 5 Primer Pair (MI, MII, MIII, or MIV) 2
25 mM dNTP mix 0.8
Nuclease‐free water 34.7
AmpliTaq Gold DNA Polymerase (5 U/µl) 1
25 mM MgCl2 1.5
Total 45
Master Mix/Label Primer Pair/Label
Mix 1 MI
Mix 2 MII
Mix 3 MIII
Mix 4 MIV
Table 3 PCR Master Mix Tube
4 Add 45 µl PCR master mix from step3 to each of 4 separate 200 µl PCR tubes or each well of a new 96‐well 0.3 ml PCR plate.
5 Add 5 µl purified Human DNA to each plate. Pipette to mix.
6 Place on the preprogrammed thermal cycler and run the mt D‐loop PCR program.
SAFE STOPPING POINT
If you are stopping, seal the plate and store at ‐25°C to ‐15°C for up to 7 days.
Perform First DNA Clean Up
This step uses AMPure XP beads to purify the library DNA from the other reaction components.
NOTE
Perform this and all subsequent procedures in a post‐PCR lab.
Consumables
• RSB (Resuspension Buffer) • AMPure XP beads
• Freshly prepared 80% ethanol (EtOH) • 90‐well 0.3 ml PCR plate
About Reagents
• Vortex AMPure XP beads before each use.
• Vortex AMPure XP beads frequently to make sure that beads are evenly distributed. • Always prepare fresh 80% ethanol for wash steps. Ethanol can absorb water from the air
impacting your results.
Preparation
1 Prepare the following consumables:
Item Storage Instructions
RSB ‐25°C to ‐15°C Thaw at room temperature.
RSB can be stored at 2°C to 8°C after the initial thaw. AMPure XP Beads 2°C to 8°C Let stand for 30 minutes to bring to room temperature. 2 Prepare 400 µl per sample fresh 80% ethanol from absolute ethanol.
Procedure
1 Add 50 µl AMPure XP beads to the plate well containing 50 µl PCR amplified library. Pipette to mix.
2 Incubate at room temperature for 5 minutes.
3 Place on a magnetic stand and wait until the liquid is clear (~5 minutes). 4 Remove and discard 90 µl supernatant from each well.
5 Wash 2 times as follows.
a Add 200 µl fresh 80% EtOH to each well. b Incubate on the magnetic stand for 30 seconds. c Remove and discard all supernatant from each well. 6 Air‐dry on the magnetic stand for 2 minutes.
7 Remove from the magnetic stand. Perform First DNA Clean Up
8 Add 27.5 µl RSB to each well. Pipette to mix.
9 Incubate the plate at room temperature for 2 minutes.
10 Place on a magnetic stand and wait until the liquid is clear (~5 minutes).
11 Transfer 25 µl supernatant from each well containing the sample to corresponding wells of a new 96‐well 0.3 ml PCR plate.
SAFE STOPPING POINT
If you are stopping, seal the plate and store at 2°C to 8°C overnight or at ‐25°C to ‐15°C for up to 30 days.
Quantify DNA
This step determines the quantity of the mitochondrial amplicons (MI, MII, MIII, and MIV) available for library preparation.
Consumables
• RSB (Resuspension Buffer) • 2 ml microcentrifuge tubes (4) • 96‐well 0.3 ml PCR plate
• Agilent High Sensitivity DNA Kit
Preparation
1 Prepare the following consumables:
Item Storage Instructions
RSB ‐25°C to ‐15°C Thaw at room temperature.
Agilent High Sensitivity DNA Kit 2°C to 8°C Bring to room temperature.
Procedure
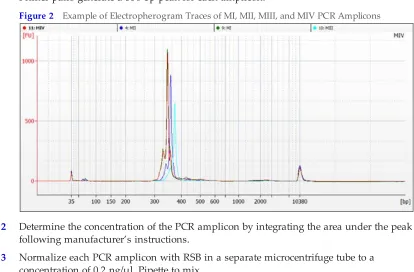
1 Load 1 µl aliquot of each PCR amplicon on an Agilent Technology 2100 Bioanalyzer using a High Sensitivity DNA LabChip.
Primer pairs generate a 350 bp peak for each amplicon.
Figure 2 Example of Electropherogram Traces of MI, MII, MIII, and MIV PCR Amplicons
2 Determine the concentration of the PCR amplicon by integrating the area under the peak following manufacturer’s instructions.
3 Normalize each PCR amplicon with RSB in a separate microcentrifuge tube to a concentration of 0.2 ng/µl. Pipette to mix.
4 Transfer an equal volume of 20 µl each PCR amplicon to 1 well of a new 0.3 ml PCR plate for each sample. Pipette to mix.
SAFE STOPPING POINT
If you are stopping, seal the plate and store at ‐25°C to ‐15°C for up to 16 hours.
Tagment Input DNA
This step uses the Nextera XT Sample Prep transposome to tagment input DNA, which is a process that fragments DNA and then tags the DNA with an adapter sequence in a single step.
Consumables
• ATM (Amplicon Tagment Mix) • TD (Tagment DNA Buffer) • NT (Neutralize Tagment Buffer) • 96‐well hard shell TCY plate • Input DNA (0.2 ng/µl)
• Microseal 'B' adhesive seals (2) • PCR 8‐tube strip with caps (3)
Preparation
1 Prepare the following consumables:
Item Storage Instructions
Input
DNA ‐25°C to ‐15°C Thaw on ice. Gently invert the thawed tubes 3–5 times, and thencentrifuge briefly. ATM ‐25°C to ‐15°C Thaw on ice. Gently invert the thawed tubes 3–5 times, and then
centrifuge briefly.
TD ‐25°C to ‐15°C Thaw on ice. Gently invert the thawed tubes 3–5 times, and then centrifuge briefly.
NT 15°C to 30°C Check for precipitates. If present, vortex until all particulates are resuspended.
2 Save the following tagmentation program on the thermal cycler: • Choose the preheat lid option
• 55°C for 5 minutes • Hold at 10°C
3 Calculate the total volume of ATM for all reactions and divide the volume equally among the wells of a PCR 8‐tube strip.
4 Use a pen to label a new 96‐well TCY plate NTA.
Procedure
1 Add the following items in the order listed to each well of the NTA plate. Pipette to mix.
Item Volume (µl)
TD 10
gDNA (1 ng total) 5
2 Add 5 µl ATM to each well. Pipette to mix. 3 Centrifuge at 280 × g at 20°C for 1 minute. Tagment Input DNA
4 Place on the programmed thermal cycler and run the tagmentation program.
5 When the sample reached 10°C, immediately add 5 µl NT to each well. Pipette to mix. 6 Centrifuge at 280 × g at 20°C for 1 minute.
7 Incubate at room temperature for 5 minutes.
Perform Second Amplification
This step amplifies the tagmented DNA using a limited‐cycle PCR program. The PCR step also adds index 1 (i7) adapters and index 2 (i5) adapters and sequences required for cluster formation. Use the full amount of recommended input DNA. To ensure libraries produce high‐quality sequencing results, use the specified number of PCR cycles.
Consumables
• NPM (Nextera PCR Master Mix) • Index 1 primers (N7XX)
• Index 2 primers (S5XX) • TruSeq Index Plate Fixture • Microseal 'A' film
Preparation
1 Prepare the following consumables.
Item Storage Instructions
Index adapters (i5 and i7) ‐25°C to ‐15°C Thaw at room temperature for 20 minutes. NPM ‐25°C to ‐15°C Thaw at room temperature for 20 minutes. 2 Save the following program on a thermal cycler:
• 72°C for 3 minutes • 95°C for 30 seconds • 12 cycles of:
• 95°C for 1 seconds • 55°C for 30 seconds • 72°C for 30 seconds • 72°C for 5 minutes • Hold at 10°C
3 Calculate the total volume of NPM for all reactions and divide the volume equally among the wells of a PCR 8‐tube strip.
Procedure
1 [24 libraries]Arrange the index primers in the TruSeq Index Plate Fixture as follows. • Arrange Index 1 (i7) adapters in columns 1–6 of the TruSeq Index Plate Fixture. • Arrange Index 2 (i5) adapter in rows A–D of the TruSeq Index Plate Fixture. Perform Second Amplification
Figure 3 TruSeq Index Plate Fixture Arrangement (24 libraries)
A Rows A–D: Index 2 (i5) adapters (white caps) B Columns 1–6: Index 1 (i7) adapters (orange caps) C NTA plate
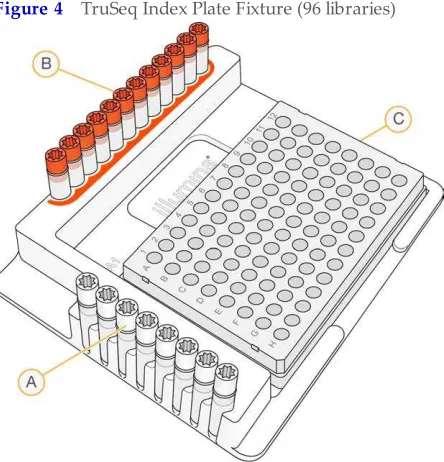
2 [96 libraries]Arrange the index primers in the TruSeq Index Plate Fixture as follows. • Arrange Index 1 (i7) adapters in columns 1–12 of the TruSeq Index Plate Fixture. • Arrange Index 2 (i5) adapter in rows A–H of the TruSeq Index Plate Fixture. Figure 4 TruSeq Index Plate Fixture (96 libraries)
D Rows A–H: Index 2 (i5) adapters (white caps) E Columns 1–12: Index 1 (i7) adapters (orange caps) F NTA plate
3 Use a multichannel pipette to add 5 µl of each Index 1 (i7) adapter down each column. Replace the cap on each i7 adapter tube with a new orange cap.
4 Use a multichannel pipette to add 5 µl of each Index 2 (i5) adapter across each row. Replace the cap on each i5 adapter tube with a new white cap.
5 Add 15 µl NPM to each well containing index adapters. Pipette to mix. 6 Centrifuge at 280 × g at 20°C for 1 minute.
7 Place on the preprogrammed thermal cycler and run the PCR program.
SAFE STOPPING POINT
If you are stopping, seal the plate and store at 2°C to 8°C for up to 2 days. Alternatively, leave on the thermal cycler overnight.
Perform Second DNA Clean Up
This step uses AMPure XP beads to purify the library DNA and provides a size selection step that removes short library fragments.
Consumables
• RSB (Resuspension Buffer) • AMPure XP beads
• Freshly prepared 80% ethanol • 96‐well midi plates (2) • 96‐well TCY plate • Nuclease‐free water
About Reagents
• Vortex AMPure XP beads before each use.
• Vortex AMPure XP beads frequently to make sure that beads are evenly distributed. • Always prepare fresh 80% ethanol for wash steps. Ethanol can absorb water from the air
impacting your results.
Preparation
1 Prepare the following consumables:
Item Storage Instructions
RSB ‐25°C to ‐15°C Thaw at room temperature.
AMPure XP Beads 2°C to 8°C Let stand for 30 minutes to bring to room temperature. 2 Prepare fresh 80% ethanol from absolute ethanol.
3 Use a pen to label a new midi plate CAA (Clean Amplified Plate). 4 Use a pen to label a new midi plate LNP (Library Normalization Plate). 5 Use a pen to label a new TCY plate CAN (Clean Amplified NTA Plate).
Procedure
1 Centrifuge at 280 × g at 20°C for 1 minute.
2 Transfer 50 µl PCR product from each well of the NTA plate to corresponding wells of the CAA plate.
3 Add 90 µl AMPure XP beads to each well of the CAA plate. 4 Pipette to mix or shake at 1800 rpm for 2 minutes.
5 Incubate at room temperature for 5 minutes.
6 Place on a magnetic stand and wait until the liquid is clear (~2 minutes). 7 Remove and discard all supernatant from each well.
8 Wash 2 times as follows.
a Add 200 µl fresh 80% EtOH to each well. b Incubate on the magnetic stand for 30 seconds. c Remove and discard all supernatant from each well.
9 Using a 20 µl pipette, remove residual 80% EtOH from each well. 10 Air‐dry on the magnetic stand for 5 minutes.
11 Remove from the magnetic stand. 12 Add 52.5 µl RSB to each well.
13 Pipette to mix or shake at 1800 rpm for 2 minutes. 14 Incubate at room temperature for 2 minutes.
15 Place on a magnetic stand and wait until the liquid is clear (~2 minutes). 16 Transfer 50 µl supernatant from the CAA plate to the CAN plate.
SAFE STOPPING POINT
If you are stopping, seal the plate and store at ‐25°C to ‐15°C for up to 7 days. Perform Second DNA Clean Up
Bead‐based Normalization
This step uses beads to normalize the quantity of each library, which ensures more equal library representation in your pooled sample.
NOTE
Manually normalize libraries when the final library yield is less than 10–15 nM. Bead‐based normalization on low yield libraries can result in overly diluted samples and low sequencing yields. See Manually Normalizing Libraries: Best Practices on MyIllumina.com.
Consumables
• LNA1 (Library Normalization Additives 1) • LNB1 (Library Normalization Beads 1)
• LNW1 (Library Normalization Wash 1) (2 tubes) • LNS1 (Library Normalization Storage Buffer 1)
• 0.1 N NaOH (fewer than 7 days old) (3 ml per 96 samples) • 96‐well midi plate
• 96‐well TCY plate • 15 ml conical tube
• Microseal 'B' adhesive seals (5)
About Reagents
• Vortex LNA1 vigorously to make sure that all precipitates have dissolved. Inspect in front of a light.
• Vortex LNB1 vigorously, with intermittent inversion (at least 1 minute). Repeat until all beads are resuspended and no beads are present at the bottom of the tube when it is inverted.
• Use only the P1000 pipette set to 1000 µl even if you are using less than full tubes. Never use a P200 pipette to handle LNB1. Mix only the required amounts of LNA1 and LNB1 for the current experiment. Store the remaining LNA1 and LNB1 separately at their recommended temperatures.
• Aspirate and dispense beads slowly due to the viscosity of the solution.
WARNING
This set of reagents contains formamide, an aliphatic amide that is a probable
reproductive toxin. Personal injury can occur through inhalation, ingestion, skin contact, and eye contact. Wear protective equipment, including eye protection, gloves, and laboratory coat. Handle used reagents as chemical waste and discard in accordance with the governmental safety standards for your region.For environmental, health, and safety information, see the SDS for this kit atsupport.illumina.com/sds.html.
Preparation
1 Prepare the following consumables:
Item Storage Instructions
LNA1 ‐25°C to ‐15°C Prepare under a fume hood.
Bring to room temperature. Use a 20°C to 25°C water bath as needed. LNB1 2°C to 8°C Bring to room temperature. Use a 20°C to 25°C water bath as needed. LNW1 2°C to 8°C Bring to room temperature. Use a 20°C to 25°C water bath as needed. LNS1 Room temperature Bring to room temperature.
2 Label a new 96‐well TCY plate as SGP (Storage Plate).
3 Label a new 96‐well midi plate as LNP (Library Normalization Plate).
Procedure
1 Transfer 20 µl supernatant from the TCY plate to a new midi plate. 2 [96 samples]Add 4.4 ml LNA1 to a new 15 ml conical tube. 3 Thoroughly resuspend LNB1. Pipette to mix.
4 Transfer 800 µl LNB1 to the 15 ml conical tube containing LNA1. Invert to mix. 5 Pour the bead mixture into a trough and add 45 µl combined LNA1/LNB1 to each well
containing libraries.
6 Shake at 1800 rpm for 30 minutes.
7 Place on a magnetic stand and wait until the liquid is clear (~2 minutes). 8 Remove and discard all supernatant from each well.
9 Wash 2 times as follows.
a Add 45 µl LNW1 to each well. b Shake at 1800 rpm for 5 minutes.
c Place on a magnetic stand and wait until the liquid is clear (~2 minutes). d Remove and discard all supernatant from each well.
10 Add 30 µl 0.1 N NaOH to each well. 11 Shake at 1800 rpm for 5 minutes.
12 Add 30 µl LNS1 to each well of the SGP plate. Set aside.
13 After the 5 minute elution, make sure that all samples in the midi plate are resuspended. Pipette to mix or lightly tap the plate on the bench.
14 Shake at 1800 rpm for 5 minutes.
15 Place on a magnetic stand and wait until the liquid is clear (~2 minutes). 16 Transfer the supernatant from the midi plate to the SGP plate.
17 Centrifuge at 1000 × g for 1 minute.
NOTE
Use qPCR for quality control, if desired. For more information, see theSequencing Library qPCR Quantification Guide (part # 11322363).
SAFE STOPPING POINT
If you are stopping, seal the plate and store at ‐25°C to ‐15°C for up to 3 days. Bead-based Normalization
Pool Bead‐Based Normalized Libraries
This step combines equal volumes of bead‐based normalized libraries in a single tube. After pooling, dilute and heat‐denature the library pool before loading libraries for the sequencing run.
Consumables
• MiSeq reagent cartridge (MiSeq Reagent Kit contents) • Eppendorf tubes with screw caps (2)
• PCR 8‐tube strip
Preparation
1 To prepare for the sequencing run, begin thawing the reagent cartridge according to the instructions for your MiSeq sequencing instrument.
2 If the SGP plate was stored frozen at ‐25°C to ‐15°C, thaw at room temperature. Pipette to mix.
Procedure
1 Centrifuge SGP plate at 1000 × g at 20°C for 1 minute.
2 Transfer 5 µl of each library from the SGP plate to a new PCR 8‐tube strip. 3 Use a pen to label a new Eppendorf tube PAL.
4 Transfer the contents of the PCR 8‐tube strip to the PAL tube. Invert to mix.
5 Dilute pooled libraries to the loading concentration. See theMiSeq System Denature and Dilute Libraries Guide (document # 15039740)and follow the instructions for bead‐based normalization and Nextera XT.
6 Store unused pooled libraries in the PAL tube and PCR plate at ‐25°C to ‐15°C for up to 7 days.
7 Sequence your library using a 2 x 151‐cycle run with 2 index reads on the MiSeq system, and then perform analysis. SeeNext Steps for Sequencing and Analysis, on page26.
Bioanalyzer‐based Normalization
As an alternative to bead‐based normalization, this step uses a bioanalyzer to determine the molarities from the sample region for normalization of the library.
Consumables
• Agilent DNA 1000 Kit • PCR 8‐tube strip
• RSB (Resuspension Buffer)
Preparation
1 Prepare the following consumables:
Item Storage Instructions
RSB ‐25°C to ‐15°C Thaw at room temperature.
Agilent DNA 1000 Kit 2°C to 8°C Bring to room temperature.
Procedure
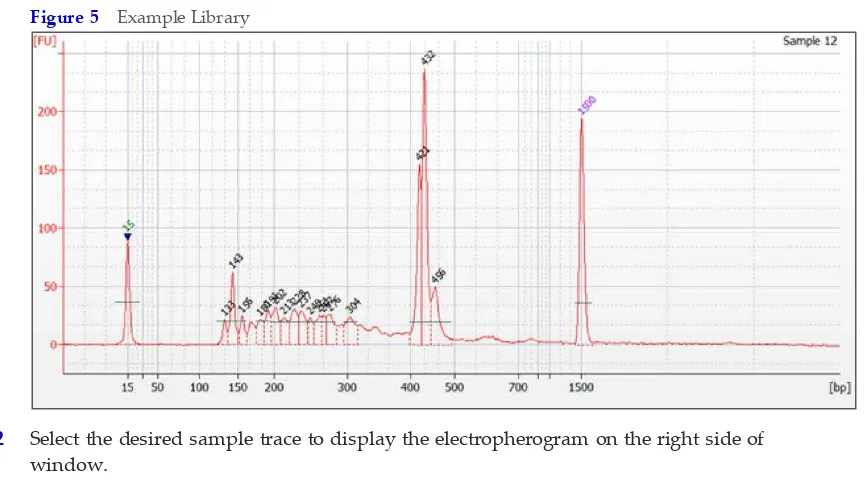
1 Analyze 1 µl of each PCR on the Bioanalyzer with a DNA 1000 Chip by following manufacturer instructions.
Figure 5 Example Library
2 Select the desired sample trace to display the electropherogram on the right side of window.
3 Select theRegion Tabletab.
4 Right‐click the electropherogram, and then selectAdd Region. Bioanalyzer-based Normalization
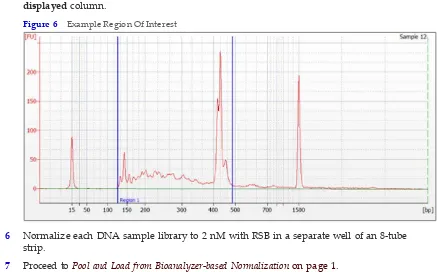
5 Click and drag the blue region lines to capture the entire DNA library range as shown. Molarity appears in the table below the electropherogram. If it does not appear, right‐ click the table, and click the configure columns. Make sure that molarity appears in the displayedcolumn.
Figure 6 Example Region Of Interest
6 Normalize each DNA sample library to 2 nM with RSB in a separate well of an 8‐tube strip.
7 Proceed toPool and Load from Bioanalyzer-based Normalizationon page 1.
SAFE STOPPING POINT
If you are stopping, seal the plate and store at ‐25°C to ‐15°C for up to 3 days.
Pool Bioanalyzer Normalized Libraries
If you normalized your libraries with a bioanalyzer, this step combines equal volumes of Bioanalyzer normalized libraries in a single tube. After pooling, dilute and heat‐denature the library pool before loading libraries for the sequencing run.
Consumables
• HT1 (Hybridization buffer) (Nextera XT DNA Library Prep Kit contents) • MiSeq reagent cartridge (MiSeq Reagent Kit contents)
• Freshly diluted 0.2 N NaOH (5 µl) • Microcentrifuge tubes (3)
• PhiX Control v3
• Tris‐HCl, pH 8.5 with 0.1% Tween 20
Preparation
1 Remove HT1 and MiSeq reagent cartridge from ‐25°C to ‐15°C storage and thaw at room temperature.
Procedure
1 Add 5 µl of each 2 nM normalized library to 1 microcentrifuge tube.
2 Dilute pooled libraries to the loading concentration. See theMiSeq System Denature and Dilute Libraries Guide (document # 15039740).
3 Sequence your library using a 2 x 151‐cycle run with 2 index reads on the MiSeq system. SeeNext Steps for Sequencing and Analysis, on page26.
Next Steps for Sequencing and Analysis
After the denaturation and dilution of DNA, load sample libraries into the MiSeq reagent cartridge and perform a sequencing run on the MiSeq or MiSeq FGx instrument. See the guide for your MiSeq instrument for complete information.
BaseSpace software is recommended for analysis. If you use BaseSpace, select the BaseSpace option when setting up the sequencing run on the MiSeq.
In BaseSpace, the BaseSpace mtDNA Variant Processor App performs the alignment and variant calling of samples. The BaseSpace mtDNA Variant Analyzer App then interrogates the results from the variant processor to analyze mitochondrial DNA. SeemtDNA Variant Processor BaseSpace App, on page27andmtDNA Variant Analyzer BaseSpace App, on page36.
As an alternative, analysis of samples from the sequencing run can be performed using the mtDNA MiSeq Reporter Plug‐In with a compatible version of the MiSeq Reporter software and the mtDNA Variant Analyzer application. Note that the mtDNA Variant Analyzer is not the same as the BaseSpace mtDNA Variant Analyzer App. SeeMiSeq Reporter, on page 44.
mtDNA Variant Processor BaseSpace App
The BaseSpace®Variant Processor BaseSpace App performs alignment and variant calling of samples against a reference mitochondrial DNA (mtDNA) genome. The app can analyze any part of the full circular genome using quality and coverage thresholds information. The app produces BAM and VCF output files. You can use the BAM files for alignment research with third party tools. You can view the analysis results of the VCF files in the mtDNA Variant Analyzer App.
See themtDNA Variant Processor App Guide (document# 1000000007931)for complete information on the application.
Compatible Libraries
See the BaseSpace support page for a list of library types that are compatible with the Analysis App.
Versions
The following components are used in the Analysis App.
Software Version
Isas (Analysis Software) 2.6.7.4
BWA-MEM (Aligner) 0.7.9
Workflow Requirements
• Supports up to 96 samples per alignment.
• Requires alignment to the Revised Cambridge Reference Sequence (rCRS)
• Supports data from samples prepared with the Human mtDNA D‐Loop Hypervariable Region Guide (document# 15034858) and Human mtDNA Genome Region Guide (document# 15037958).
Reference Genomes
The genome for alignment is the Revised Cambridge Reference Sequence (rCRS), a mtDNA genome used by the Forensic Genomics community.
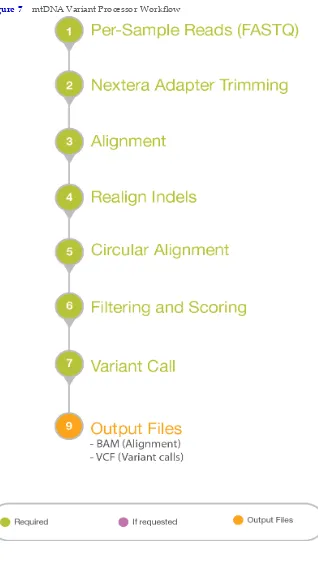
Workflow Diagram
Figure 7 mtDNA Variant Processor Workflow
Workflow
The Analysis App supports both mtDNA D‐Loop, custom regions, and whole genome samples. SeeAnalysis Methods, on page31.
Nextera Adapter Trimming
• Nextera adapters are removed from the forward and reverse reads.
• Trimming is repeated until there are no more than 3 adapter bases on the end of the read.
• Reads are discarded when they are excessively trimmed or have short amplicons. Alignment
• BWA‐MEM performs the alignment.
• Circular alignment is handled across the origin by identifying the true start and end of reads.
• Realigns regions with indels to improve alignment and shifts indels to a 3' alignment. Account for Primers
• Manifest identifies the primers and amplicons.
• Removes primer contributions from the reads for accurate variant calling. Variant Calling
• Identifies nucleotides that are greater than the interpretation threshold for the position. • Generates percentage of reads for a nucleotide that exceeds the analysis threshold (at). • Generates a percentage of reads for a nucleotide that exceeds the interpretation threshold
(it).
• Generates the interpretation threshold indicator for positions that have a nucleotide between the analysis threshold and the interpretation threshold.
• Reports base call codes. SeeBase Call Codes, on page34. Filtering and Scoring
• Removes reads that do not meet the minimum quality score for a base call.
• Calculates a score from the minimum quality score for base call, alignment score, and presence of low abundance reads at the position.
Output Files
• VCF files and BAM files.
• Use the mtDNA Variant Analyzer App to view the analysis results.
Log In to BaseSpace
1 Navigate to BaseSpace at basespace.illumina.com, enter your user name and password, and clickLogin.
2 Click theAppstab.
3 In Categories, clickTargeted Sequencing, and then clickmtDNA Variant Processor. 4 From the drop‐down list, selectversion 1.0.0, and then clickLaunchto open the app.
The mtDNA Variant Processor parameters window displays. 5 Set the parameters for analysis.
For additional training on BaseSpace, see the BaseSpace support page at support.illumina.com/sequencing/sequencing_software/basespace/training.html mtDNA Variant Processor BaseSpace App
Set Analysis Parameters
1 In the App Session Name field, enter the analysis name.
By default, the analysis name includes the app name, followed by the date and time that the analysis session starts.
2 From the Project field, select the project that stores the app results.
3 From the Samples field, browse to the sample you want to analyze, and select the checkbox.
4 From the Minimum Base Call Quality Score for a Call (Q) field, enter the quality score. The default value is 30. At each coordinate, reads at or above the Q value can contribute to the variant call.
5 From the Analysis Threshold % field, enter the percentage.
The default value is 10. If a nucleotide call is at less than the value of the Analysis Threshold (%), then the nucleotide call is not visible or reported as part of the call. 6 From the Interpretation Threshold % field, enter the percentage.
The default is 25. A nucleotide with a total number of reads greater than the
interpretation threshold percentage contributes to the call for the coordinate. When more than one base exceeds this percentage for a coordinate, the app reports the base call code for the bases. SeeBase Call Codes, on page34.
7 From the Minimum Read Count field, enter the number of reads required at the coordinate to produce a base call.
The default value 10.
8 From the Genome field, select the genome to be analyzed.
9 From the PCR Primer Description field, select from the following options: • Whole Mito Genome Amplicon Manifest
• DLoop Amplicon Manifest • Custom Manifest.
10 [Optional]If you selectCustom Manifest, complete the following steps: a Enter the start coordinate (5', 0‐based) for the forward PCR primer. b Enter the start coordinate (5', 0‐based) for the reverse PCR primer. c Enter the base length of the forward PCR primer.
d Enter the base length of the reverse PCR primer. Click the plus (+) sign to add additional rows. 11 ClickContinue.
The Analysis App begins analysis.
When analysis is complete, the app updates the status of the session and sends an email to notify you.
Analysis Methods
The Analysis App uses the following methods to analyze the sequencing data. SeeWorkflow , on page29.
• Illumina Secondary Analysis Software (Isas) • BAM‐MEM1
1Li H. (2013) Aligning sequence reads, clone sequences and assembly contigs with BWA‐MEM. arXiv: 1303.3997v1[q‐bio.GN].
BWA‐MEM
BWA‐MEM is the most recent version of the Burrows‐Wheeler Alignment algorithm. Optimized for longer read lengths of ≥ 70 bp, BWA‐MEM has a significant positive impact on detection of variants, especially insertions and deletions.
Analysis Output
To view the results, click theProjectstab, then the project name, and then the analysis. Figure 8 Analysis Output Navigation Bar
Use the left navigation bar to access the following analysis output:
• Analysis Info—Information about the analysis session, including log files. • Inputs—Overview of input settings.
• Output Files—Output files for the samples.
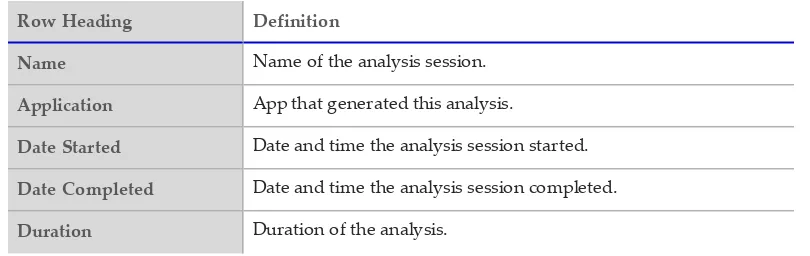
Analysis Info
The Analysis Info page displays the analysis settings and execution details.
Row Heading Definition
Name Name of the analysis session.
Application App that generated this analysis.
Date Started Date and time the analysis session started.
Date Completed Date and time the analysis session completed.
Duration Duration of the analysis. mtDNA Variant Processor BaseSpace App
Row Heading Definition
Session Type Multi‐Node.
Status Status of the analysis session. The status shows either Running or Complete and the number of nodes used.
Log Files
File Name Description
Output Files
The Output Files page provides access to the output files for each sample analysis. • BAM Files
• VCF Files
BAM File Format
A BAM file (*.bam) is the compressed binary version of a SAM file that is used to represent aligned sequences up to 128 Mb. SAM and BAM formats are described in detail at
https://samtools.github.io/hts‐specs/SAMv1.pdf.
BAM files use the file naming format of SampleName_S#.bam, where # is the sample number determined by the order that samples are listed for the run. In multi‐node mode, the S# is set to S1, regardless the order of the sample.
BAM files contain a header section and an alignment section:
• Header—Contains information about the entire file, such as sample name, sample length, and alignment method. Alignments in the alignments section are associated with specific information in the header section.
• Alignments—Contains read name, read sequence, read quality, alignment information, and custom tags. The read name includes the chromosome, start coordinate, alignment quality, and the match descriptor string.
The alignments section includes the following information for each or read pair: • RG:Read group, which indicates the number of reads for a specific sample.
• BC:Barcode tag, which indicates the demultiplexed sample ID associated with the read. • SM:Single‐end alignment quality.
• AS:Paired‐end alignment quality.
• NM:Edit distance tag, which records the Levenshtein distance between the read and the reference.
• XN:Amplicon name tag, which records the amplicon tile ID associated with the read. BAM index files (*.bam.bai) provide an index of the corresponding BAM file.
VCF File Format
Variant Call Format (VCF) is a widely used file format developed by the genomics scientific community that contains information about variants found at specific positions in a reference genome.
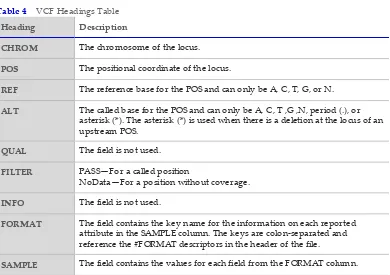
Heading Description
CHROM The chromosome of the locus.
POS The positional coordinate of the locus.
REF The reference base for the POS and can only be A, C, T, G, or N.
ALT The called base for the POS and can only be A, C, T ,G ,N, period (.), or asterisk (*). The asterisk (*) is used when there is a deletion at the locus of an upstream POS.
QUAL The field is not used.
FILTER PASS—For a called position
NoData—For a position without coverage.
INFO The field is not used.
FORMAT The field contains the key name for the information on each reported attribute in the SAMPLE column. The keys are colon‐separated and reference the #FORMAT descriptors in the header of the file.
SAMPLE The field contains the values for each field from the FORMAT column. Table 4 VCF Headings Table
Base Call Codes
The mtDNA Processor App supports variant calling for more than one nucleotide at a position. When more than one nucleotide exceeds the interpretation threshold, the app reports the IUPAC code as the consensus for the position.
Code Base
Table 5 Variant Base Call Codes1Table
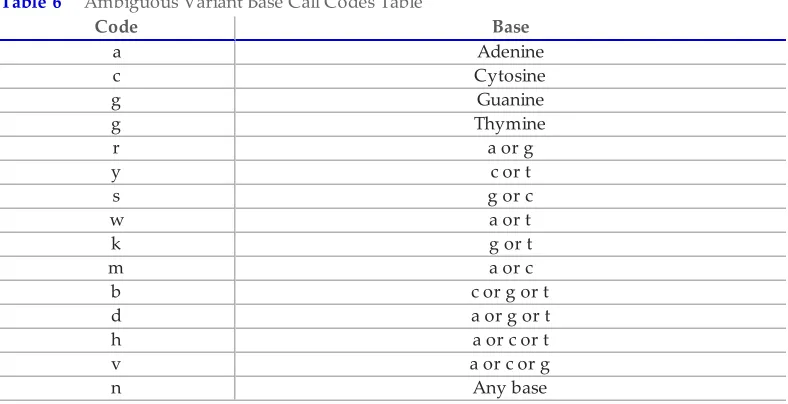
When data for the indel and a base call at a position exceed the interpretation threshold, the app reports the ambiguous call code for an indel as the consensus for the position.
Code Base
Table 6 Ambiguous Variant Base Call Codes Table
1Codes are from the International Union of Pure and Applied Chemistry (IUPAC).
For example,Figure 9shows the presence of an ambiguous deletion at position 501. Because there are an equal number of reads that support a deletion call and a reference call ofG, the app reports an ambiguous call ofgas the consensus.
Figure 9 Example of Ambiguous Variant Base Calls mtDNA Variant Processor BaseSpace App
mtDNA Variant Analyzer BaseSpace App
Using the analysis results from the mtDNA Variant Processor App, the BaseSpace® mtDNA Variant Analyzer App produces the analysis for mitochondrial DNA (mtDNA) sequencing data. The app can analyze any part of the full circular genome, without any origin dead zone, using quality and coverage thresholds customized by the user. The app also generates analysis reports in Excel file format.
See themtDNA Variant Analyzer App Guide (document # 1000000007934)for complete information on the application.
Compatible Data
The Variant Call Format (VCF) output files from the mtDNA Variant Processor App are compatible with the Analysis App.
Reference Genomes
The genome for alignment is the Revised Cambridge Reference Sequence (rCRS), a mtDNA genome used by the Forensic Genomics community.
Log In to BaseSpace
1 Navigate to BaseSpace at basespace.illumina.com, enter your user name and password, and clickLogin.
2 Click theAppstab.
3 In Categories, clickTargeted Sequencing, and then clickmtDNA Variant Analyzer. 4 From the drop‐down list, selectversion 1.0.0, and then clickLaunchto open the app.
The permission request dialog box appears. 5 From the dialog box, clickAccept.
By default, this dialog box appears the first time you launch the app. After you click Accept, the BaseSpace Projects page appears.
For additional training on BaseSpace, see the BaseSpace support page at support.illumina.com/sequencing/sequencing_software/basespace/training.html
BaseSpace Projects Page Functions
You can perform the following functions while in the BaseSpace Projects page:
• To search for a project, enter the project name in thesearch project namefield. • To search for samples, enter a sample name in thesearch sample namefield. • To remove a sample, click the selected sample again or click .
• To select all samples, click theSelect All Visiblelink. • To remove all samples, clickClear all.
Select Samples From a Project or Multiple Projects
1 In the BaseSpace Projects page, select the project you want to analyze. 2 Select the samples you want to analyze.
The app supports a maximum of 96 samples. The right‐side pane shows the selected samples for analysis.
3 [Optional]To add samples from a different project, clickBaseSpace Projectsto return to the BaseSpace projects page.
Repeat step 1 and 2.
4 When you have completed selecting the samples, clickSubmit.
By default, the first time you select a sample, a dialog box requesting for access to samples in the project appears.
5 From the dialog box, clickAccept
The app reloads the selected samples. Any unsaved changes to samples are not loaded to the analysis. When analysis is complete, the app shows the sample analysis in the Reference Genome Compare View, mtDNA Navigator, and Coverage Plot.
Analysis Output
The mtDNA Variant Analyzer App uses VCF and BAM output files from the mtDNA Variant Processor App to produce the following analysis output:
• Reference Genome Compare View • Sample Compare View
• mtDNA Navigator • Coverage Plot
• Aggregate Analysis Report • Sample Analysis Reports
Status Icons
The Analysis App provides the following status icons.
Icon Description
In the BaseSpace Projects page, this icon at the top‐right of the sample indicates that the sample is modified.
In the Reference Genome Compare View, this blue icon next to the sample indicates that the sample is modified. In the Sample Compare View, the icon color is orange. In the Reference Genome Compare View, this blue icon next to the sample name indicates that the sample changes are unsaved.
In the Sample Compare View, the icon color is orange. Table 7 Status Icon Table
Reference Genome Compare View
The Reference Genome Compare View has a blue background and lets you compare the reference genome (rCRS) with the selected samples. You can view the following information in the view pane:
• Reference genome
• Selected samples for comparison • Call of a position for each sample
• Variant indicator (blue line under the call)
• Interpretation threshold indicator (purple line under the call) • User modified call indicator (asterisk sign next to the call) • Total number of samples
Any changes you make are immediately updated to the following areas: • Reference Genome Compare View
• mtDNA Navigator • Coverage Plot
When you select a sample (it is highlighted), the mtDNA Navigator and Coverage Plot immediately update the position and coverage for that sample.
Use these tools to refine your analysis. When you make changes to the Reference Genome Compare View, the changes are also reflected in the mtDNA Navigator and Coverage Plot.
Tools Description
Sample Compare—To make a selected sample a reference and compare it to the rest of the samples, highlight the sample by selecting it, and then drag the blue dot to the other side until the background is orange. Use this tool to find differences between samples or to find identical samples.
Sample Selection—To add more samples from the same project or a different project, use this tool to return to the BaseSpace projects page.
Save—When you modify a base call, use this tool to save changes to BaseSpace. The icon is activated when you make a change. ClickSample Selectionto view samples that are modified.
Filter—Use this tool to filter samples for D‐Loop, variants, interpretation threshold, and user modified. See
Filter Options, on page39.
Call for a Position—Use this tool to view call details. See
View Call Details, on page40.
Generate Report—Use this tool to export sample analysis data in Excel file format.
Next Hotspot—A hotspot is any variant, interpretation threshold indicator, or user modified position for the selected sample. Use the large arrow to get to the next hotspot.
Next Page—Use the small arrow to get to the next 15 positions.
Table 8 Reference Genome Compare View Tools Table
Filter Options
You can select one or more filters per analysis.
Filter Description
D‐Loop This option constrains the view range positions from 16024 to 576.
The constraint affects the Reference Genome Compare View, mtDNA Navigator, and Coverage Plot.
Variants This option filters the positions with variants for each sample.
Interpretation Threshold This option filters the positions with interpretation threshold indicators for each sample.
User Modified This option filters the positions that are modified. Table 9 Reference Genome Compare Filter Options Table
Sample Compare View
The Sample Compare View has an orange background and lets you compare a specific sample with the selected samples. The sample located at the top of the list is the reference sample. You can view the following information in the view pane:
• Reference sample
• Selected samples for comparison • Call of a position for each sample
• Differences indicator (orange line under the call)
• Interpretation threshold indicator (purple line under the call) • User modified call indicator (asterisk sign next to the call) • Total number of samples
Any changes you make are immediately updated to the following areas: • Sample Compare View
• mtDNA Navigator • Coverage Plot
When you select a sample (it is highlighted), the mtDNA Navigator and Coverage Plot immediately update the position and coverage for that sample and the reference sample. The tools for tools for the Reference Genome Compare View and Sample Compare View are the same, with the exception of the following differences. SeeReference Genome Compare View, on page38.
Tools Description
Sample Compare—To return to the Reference Genome Compare View, drag the orange dot to the other side until the background is blue.
Filter—Use this tool to filter samples for D‐Loop, differences and zero differences, interpretation threshold, and user modified. SeeFilter Options, on page40. Sample Navigation—Use this tool change the sample you want to compare. Click the arrow to move the selected sample to the top of the list.
Table 10 Sample Compare View Tools Table
Filter Options
You can select one or more filters per analysis.
Filter Description
D‐Loop This option constrains the view range positions from 16024 to 576.
The constraint affects the Sample Compare View, mtDNA Navigator, and Coverage Plot.
Differences This option filters the positions that are different from the reference sample.
Interpretation Threshold This option filters the positions with interpretation threshold indicators for each sample.
User Modified This option filters the positions that are modified. Zero Differences This option filters samples that are not different from the
reference sample. Table 11 Sample Compare Filter Options Table
View Call Details
1 Click a specific call position to view the Detailed Call View.
2 [Optional]From the Original Call field, expand the drop‐down arrow to select a different call.
Detailed Call View
Call Detail Description
Reference Sample Name The reference sample name.
Sample Name The sample name for the result.
Call The call for the position.
Paired-End Depth The maximum depth of either the forward or reverse reads.
Score Score for the call.
Percentages The percentages are stacked and shown in relation to the thresholds.
it The location where the interpretation threshold resides for the sample.
at The location where the analytical threshold resides for the sample.
Original Call The original call. To change the call, expand the drop‐down arrow and select a call from the list.
Table 12 Detailed Call View Table
mtDNA Navigator
The following are the mtDNA Navigator features:
• The pointer indicates the position in the Reference Genome Compare View or Sample Compare View.
• To view genomic variants, interpretation threshold, D‐Loop positions, and selected coverage, move the pointer around the circle plot.
• The mtDNA Navigator zooms in to show more details of the D‐Loop area when you select the D‐Loop filter option in the Reference Genome Compare View or Sample Compare View.
• The mtDNA Navigator shows coverage for the selected sample in relation to the visual representation of the genome. In Sample Compare View, the app shows the overlapped coverage of the reference sample and selected sample.
Any changes you make are immediately updated in the following areas: • mtDNA Navigator
• Reference Genome Compare View or Sample Compare View • Coverage Plot
Coverage Plot
The following are the Coverage Plot features:
• The pointer indicates the position in the Reference Genome Compare View or Sample Compare View.
• To zoom in and out, enter a value in the Coverage field.
• When you are in Reference Genome Compare View, the blue line in the coverage plot represents the coverage for the selected sample.
• When you are in Sample Compare View, the gray line in the coverage plot represents the coverage for the reference sample and the orange line represents the coverage for the selected sample.
Any changes you make are immediately updated in the following areas: • Coverage Plot
• Reference Genome Compare View or Sample Compare View • mtDNA Navigator
Aggregate Analysis Report
The Analysis App generates an aggregated summary of all the analyzed samples in an Excel file.
Statistic Definition
Sample The sample name.
Single Nucleotide Variants (SNVs)
The number of positions where the call for the sample differs from the reference genome (rCRS).
Table 13 Summary Table
Statistic Definition
Insertions The number of one or more nucleotides inserted in the sample genome.
Deletions The number of one or more nucleotides deleted from the sample genome.
Manually Changed Calls The changed call when it is modified, which is presented as [position] [original call] ‐> [new call].
Variants The position and call for calls that differ from the reference genome.
Sample Analysis Reports
In addition to the aggregated summary of all the analyzed samples, the Analysis App generates a summary of read count and variant statistics for each sample in the same Excel file.
Statistic Definition
Sample The sample name.
Single Nucleotide Variants
The number of positions where the call for the sample differs from the reference genome (rCRS).
Insertions The number of one or more nucleotides inserted in the sample genome.
Deletions The number of one or more nucleotides deleted from the sample genome.
Manually Changed Calls The changed call when it is modified, which is presented as [position] [original call] ‐> [new call].
Variant The position and call for calls that differ from the reference genome.
Reference The base position in the reference genome (rCRS).
When there is an insertion, the reference base reports a plus (+) sign.
Score The score for the call.
Paired-End Depth The maximum depth of either the forward or reverse reads.
Reads A, C, G, T The number of forward and reverse reads for the A, C, G, or T bases at the call position.
Percent A, C, G, T The percentage of forward and reverse reads out of the total reads for the A, C, G, or T bases at the call position.
Table 14 Sample Analysis Table
Statistic Definition
Reads Del The number of forward and reverse reads for a deletion at the call position.
Percent Del The percentage of forward and reverse reads out of the total reads for a deletion at the call position.
MiSeq Reporter
The mtDNA MiSeq Reporter Plug‐In and the mtDNA Variant Analyzer are exclusively designed for mtDNA samples run on a MiSeq or MiSeq FGx instrument. This section describes the installation and output of these mtDNA analysis tools.
These analysis tools are only compatible with MCS v2.3 used with MiSeq Reporter v2.3, or FGx Control Software v1.1 used with MiSeq Reporter 2.5.1.3. Other software configurations are not guaranteed to be compatible and are used at risk. Contact your Illumina
representative for more information.
NOTE
The following procedures assume that MiSeq Reporter is installed on your instrument control computer, you are familiar with how to run MiSeq Reporter, and have read theMiSeq Reporter Software Guide (document # 15042295).
If using MiSeq Reporter for analysis, a sample sheet is required before starting the run. See Create a Sample Sheet, on page45. Make sure that a mtDNA D‐Loop manifest provided by Illumina is present in the MiSeq run directory before the initiation of MiSeq Reporter analysis. Edit the manifest if the primers for your experiment differ from the primers recommended in this protocol. SeeEdit Manifest, on page46
Install mtDNA MiSeq Reporter Plug‐In
The mtDNA MiSeq Reporter Plug‐In is provided as a software plug‐in for MiSeq Reporter. It is designed for processing human mtDNA samples for use with the mtDNA Variant Analyzer. Install the plug‐in as follows:
1 Download the MiSeq Reporter plug‐in installer and copy the installer file to a location accessible from the MiSeq instrument computer.
NOTE
• If you are using MiSeq Reporter off‐instrument, the mtDNA MiSeq Reporter Plug‐In must be installed and run on a computer that has MiSeq Reporter installed.
• If another version of the mtDNA MiSeq Reporter Plug‐In is installed, uninstall it using the WindowsControl Panelbefore installing the current version.
2 Double‐click the MiSeq Reporter plug‐in installer (mtDNA Miseq Reporter Plug‐In.msi) and follow the software prompts to complete installation.
3 Copy the rCRS1folder in the installation package to the genomes folder accessed by MiSeq reporter (C:\illumina\MiSeq Reporter\Genomes).
1Andrews R, Kubacka I, Chinnery P, Lightowlers R, Turnbull D, and Howell N (1999) Reanalysis and revision of the Cambridge reference sequence for human mitochondrial DNA. Nature Genetics 23: 147.
Install mtDNA Variant Analyzer
The mtDNA Variant Analyzer opens the data in the viewer files (.viewer) produced by the mtDNA MiSeq Reporter Plug‐In. Install the analyzer as follows:
NOTE
• The mtDNA Variant Analyzer requires Microsoft Office 2010 and Microsoft.NET framework version 4.0.
• Install the mtDNA Variant Analyzer on a computer with access to the output from the mtDNA MiSeq Reporter Plug‐In.
• The *.viewer files are the only files required by the mtDNA Variant Analyzer. The files for the samples of interest can be copied to any network location or locally for portability. 1 Download the mtDNA Variant Analyzer installation package and copy the installer file
to a computer.
NOTE
If another version of the mtDNA Variant Analyzer is installed, uninstall it using the WindowsControl Panelbefore installing the current version.
2 Double‐click the mtDNA Variant Analyzer installer (mtDNA Setup.msi) and follow the software prompts to complete installation.
Create a Sample Sheet
1 Create a sample sheet using the Illumina Experiment Manager (IEM) software. 2 After creating the sample sheet, open it in Microsoft Excel and modify the following
fields for mtDNA analysis:
• Header—Enter “mtDNA” in the Workflow row.
• Settings—Enter the Nextera XT adapter sequence, used in the assay, in the Adapter row. • Manifests—Identify the PCR Amplicon manifest used for the assay. Each manifest is an
independent entry in this section and referenced by a letter.
NOTE
If the primers for your experiment differ from those recommended in this protocol, edit the manifest. SeeEdit Manifest, on page46. Make sure that the sample sheet correctly references the manifest for the samples amplified with the custom primers.
Make sure that the sample sheet correctly references the manifest for the samples amplified with the custom primers. See
• Data—Each sample must refer to the appropriate manifest defined in theManifests section. Each sample must reference the rCRS GenomeFolder.
3 [Optional]Define additional settings that alter the behavior of variant calling in the Settingssection of the sample sheet:
NOTE
If the following settings are modified, requeue the run for analysis in MiSeq Reporter. For more information, see theMiSeq Reporter User Guide (part # 15042295).
• MinimumBasecallQualityForVariantCall—At each coordinate, the reads contributing to the variant call must be at or above this Q value to contribute to the call. If this value is not specified, the default is 30 (Q30).
• DetectionThreshold—Variants less than this value will not be reported. The value can be specified. If the value is not specified, the default is 0.10 (10%).
• AnalysisThreshold— A called base with a frequency greater than this value is reported as the code between the base and the reference. If this value is not specified, the default is 0.25 (25%, variant frequencies between 25% – 75% will be considered ambiguous). For more information, seeAmbiguous Variant Base Calls, on page53.
4 Save the sample sheet with the name SampleSheet.csv and place it in the MiSeq run directory(D:\Illumina\MiSeq FGx Control Software\SampleSheets).
Figure 10 mtDNA d‐Loop Sample Sheet Example
Edit Manifest
The MiSeq Reporter Plug‐In requires a mtDNA D‐Loop manifest that defines the location of primers.
If the primers for your experiment differ from the primers recommended in this protocol, edit the manifest to reflect the regions amplified as follows:
1 Open the mtDNA D‐Loop manifest provided by Illumina using Microsoft Excel. 2 Edit the Name, Amplicon Start, Amplicon End, Upstream Probe Length, and
Downstream Probe Length for a contiguous amplified region.
3 For amplicons that span the origin, enter an amplicon that ends at position 16569 with a length of 1, and another amplicon that begins at position 1 with a length of 1.
4 Save the manifest in the manifest folder in the directory(D:\Illumina\MiSeq FGx Control Software\Manifests).
NOTE
• If you change the file name of the manifest, make sure that your sample sheet references the new name for each sample.
• After sequencing begins, the manifest is copied to the run directory of the run. If reprocessing a run with a different manifest, revise or replace the manifest that is within the run directory.
MiSeq Reporter Analysis Output
After the mtDNA MiSeq Reporter Plug‐In is installed, perform mtDNA secondary analysis by following MiSeq Reporter standard operations. For more information, see theMiSeq Reporter Software Guide (part # 15042295).
The mtDNA MiSeq Reporter Plug‐In creates an output file (.viewer) for the mtDNA Variant Analyzer. Each coordinate position that had supporting data for the sample is described with:
• The reference base at the position
• The call at the position. When the call is identical to the reference, a “.” is presented. • The mean base quality score at the position
• The variant score at the position
• The number of reads contributing to each base call
• Any flags highlighting issues with the position. The list of possible choices are as follows:
Issue Definition
LowVariantFreq Variant frequency is lower than the cut‐off (default 0.10) LowGQ Variant quality score was below the cut‐off (30.00) IndelRepeatLength Insertion or Deletion length is greater than the cut‐off (8) LowDP Coverage depth lower than cut‐off (10)
SB Variant strand bias too high or coverage on only 1 strand DEL Filter is related to a deletion or flanking deletion
ChkTSNP Check T SNP call in C‐stretch (position 310) ChkMultiCall Check multiple calls at single position
Table 15 Potential Position Flags for Secondary Analysis Output
mtDNA Variant Analyzer
The mtDNA Variant Analyzer compares a Question sample to a Known sample or the rCRS reference using the results from MiSeq Reporter running with the mtDNA MiSeq Reporter Plug‐In. The software workflow has 3 consecutive processes:
• Identify Samples • Interrogate Data • Report
Start Variant Analyzer
After completing the installation, start the mtDNA Variant Analyzer.
1 From the WindowsStartmenu, clickAll Programs | Illumina | mtDNA Variant Analyzeror double‐click the mtDNA Variant Analyzer icon on your desktop. The mtDNA Variant Analyzer screen appears.
Figure 11 mtDNA Variant Analyzer Screen | Identify Samples Tab
Identify Samples
Identify a known and question sample, for comparative analysis, on the Identify Samples tab of the mtDNA Variant Analyzer screen:
1 Do 1 of the following to select the Known sample for comparison to the Question sample:
• ClickBrowseto specify a sample (.viewer file) from the Alignment folder in the MiSeqAnalysis folder(Data\Intensities\BaseCalls\Alignment).
• Select theCompare to rCRScheckbox for rCRS comparison.
2 ClickBrowseto select the Question sample (.viewer file) from the Alignment folder in the MiSeqAnalysis folder(Data\Intensities\BaseCalls\Alignment).
3 ClickNext.
Interrogate Data
Data from the selected samples are displayed on the Interrogate tab of the mtDNA Variant Analyzer screen.