April-June 2014 Page 1
Executive
Summary
COA - Vol. 9
GENERAL DIRECTORATE STATE FINANCE NATIONAL DIRECTORATE FOR ECONOMIC POLICY DILI - 2015
Quarterly Fiscal Bulletin
January - March 2015
Chart of Accounts (COA)
Executive Summary
Fiscal Bulletin COA January-March 2015 Page 1
1.
Overall Fiscal Position (Oil and Non-oil)
Table 1. Overall Fiscal Position
1Petroleum Fund and General Government
2015 Act Q1 Total Actual
A. Total Expenditure 217.2 217.2
Recurrent Expenditure 214.1 214.1
Capital Expenditure 3.1 3.1
B. Total Revenue 386.5 386.5
Non-oil Revenue 34.2 34.2
Oil Revenue 352.3 352.3
Petroleum Fund Gross Receipts 273.2 273.2
Investment Income 79.1 79.1
Surplus of (A-B): 169.3 169.3
Financing -169.3 -169.3
Foreign Loans 0.2 0.2
Net Purchase of Financial Assets -133.1 -133.1
Use of Cash Balance* -36.4 -36.4
Total expenditures for the GGoTL and the PF reached $217.2 million the end of the first quarter of 2015.
$214.1 million was spent on recurrent expenditures, whilst $3.1 million was spent on capital expenditures.2
At the end of the first quarter of 2015, total revenues amounted to $386.5 million. From oil revenues, $352.3 million were recorded and $34.2 million were obtained from non-oil revenues. PF revenues include PF gross receipts (taxes, royalties and second tranche petroleum) and investment income (dividends,
interests and trust income, but exclude fair value gains and losses on profit/loss).3
Total surplus stood at $169.3 million by the 31st March 2015, which is calculated as total revenue minus total
expenditure. This means the GGoTL, including the PF, is in a strong fiscal position to make investments in financial assets.
Financing is broken down into three components. The GGoTL added $36.4 million to the cash balance, $0.2 was received from loans and $133.1 million was used to purchase financial assets in the PF.
1
All data in this document refers to unaudited accounts and is thus subject to change. 2
This includes expenditure from loans under capital and development. 3
FISCAL BULLETIN TIMOR-LESTE
CHART OF ACCOUNTS
Fiscal Bulletin COA January-March 2015 Page 2
2.
Ge eral Gover
e t’s
Fiscal Position
Table 2. Non-Oil Fiscal Position
General Government
2015 Budget 2015 Act Q1 Total Actual % Execution
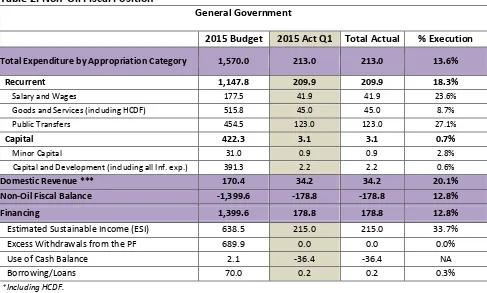
Total Expenditure by Appropriation Category 1,570.0 213.0 213.0 13.6%
Recurrent 1,147.8 209.9 209.9 18.3%
million. $215.0 million of this deficit was financed through the ESI, $0.2 million was financed through loans
and $36.4 million was added to the cash balance.
2.1
General Government Expenditures
At the end of the first quarter of 2015, expenditures amounted to $213.0 million. This was 13.6% of total
budgeted expenditures for the year.
2.1.1. Expenditure by Appropriation Category
Total expenditures are divided into recurrent and capital expenditures. Recurrent expenditures totalled $209.9 million at the first quarter of 2015, which was an execution rate of 18.3%. In comparison, capital
expenditures reached $3.1million by the 31st March 2015, which meant an execution rate of 0.7%.
Recurrent expenditures are divided into:
Salary and Wages totalled $41.9 million at the first quarter of the 2015, reaching an execution rate of
Fiscal Bulletin COA January-March 2015 Page 3
Goods and Services reached $45.0 million by the 31st March 2015. Expenditures on goods and services to date in 2015 represented an increase of 25.2% compared to the $35.9 million spent in the same
period of 2014. This increase was mainly due to growth in district imprested advance (increased by
145%), professional services (increased 26%) and other miscellaneous services (grew by 81%). Expenditures on human capital through the HCDF reached $1.08 million, 9.4% more than those recorded in the first quarter of 2014.
Public Transfers totalled $123.0 million by the end of the first quarter of 2015 and thus presented an
execution of 27.1%. This expenditure was much higher than the $21.7 million recorded by the 31st
March 2014. This increase was mostly due to a rise in public grants, which reached $101.9 million by the end of the first quarter 2015.
Capital expenditures are composed of:
Minor Capital totalled $0.9 million by the first quarter of 2015, which represented an execution rate of 2.8%. Total minor capital expenditure by the end of first quarter of 2015 presented a strong increase compared to the $0.08 million by the same date of 2014. This was mostly due to a rise in other miscellaneous equipment purchased during the first quarter of 2015.
Capital & Development was $2.2 million by the end of the first quarter of 2015, thus presenting an
execution rate of 0.6%. Expenditure in the Infrastructure Fund in particular was 73.3% lower by the end
of the first quarter of 2015, compared to the same period in 2014 (reaching $2.02million by the first
quarter of 2015). This was mostly due to institutional changes in the Government during the first
FISCAL BULLETIN TIMOR-LESTE
CHART OF ACCOUNTS
Fiscal Bulletin COA January-March 2015 Page 4
2.2 Non-oil Revenues
Table 3. Non-oil Revenues
General Government
2015 Budget 2015 Act Q1 Total Actual % Execution
Total Domestic Non-oil Revenues 170.3 34.2 34.2 20.1%
Tax Revenue 125.5 23.4 23.4 18.6%
The Government has increased non-oil revenue in recent years and is planning further reforms to increase
non-oil revenue collections going forward. Total domestic non-oil revenues were $34.2million by the first
quarter of 2015, which represented 20.1%of the total revenue budgeted for the year. This was divided into:
Tax Revenue, which was the largest category and is divided into:
Taxes on commodities, was the largest tax category reaching $12.5 million at the first quarter of 2015.
This was 14.3% lower than the $14.6 million collected in the same period 2014 due to reductions in sales tax, excise tax and import duties.
Taxes on income, totalled $10.1 million at the first quarter of 2015, 1.6% higher than the $10.0 million
collected in the2014.
Service tax, decreased 25.3% compared to the $0.9 million collected by the first quarter 2014, totalling $0.7 million by the end of the first quarter of 2015.
Other tax revenues reached $0.03 million at the end of the first quarter of 2015.
Non-tax revenue totalled $9.3million by the end of the first quarter of 2015, 24.9% of the total forecasted
for the year. This was more than double the non-tax revenue collected in the first quarter of 2014, due to the recent reallocation of electricity fees and charges under this category.
Revenue Retention Agencies recorded 71.4% lower revenues than $5.5 million during the same period of
2014, reaching $1.6 million at end the first quarter of 2015. This was due to the reallocation of electricity
fees from revene retention agencies to non-tax revenue.