p-ISSN: 2086-0382; e-ISSN: 2477-3344
Application of Modified Spatial K'luster Analysis by Tree Edge Removal (SKATER) Method
on the level of Crime in Way Kanan district, Lampung
I Kadek Yama Rinaldi1, Maria Bernadetha Theresia1, Achmad Efendi1, Henny Pramoedyo1
1Department of Statistics, Brawijaya University, Malang
Email: [email protected], [email protected]
ABSTRACT
Modification of Spatial K'luster Analysis by Tree Edge Removal method (SKATER) is one of the regionalization method for clustering based on the location by spatial autocorrelation and spatial patterns. Modification of SKATER is a development of ordinary SKATER that modifying the calculation of weights and the partition process to accommodate the homogeneity within the cluster and heterogeneity between clusters. Covariance Normalized Distance (CND) is an edge weight for the formation of Minimum Spanning Tree (MST) using Prim's algorithm which connects two location. After MST partition has been formed, then we partitioning MST sequentially calledBetween Cluster Dissimilarity or Cluster Stretch which created a group with individually connected to the MST. The results from SKATER grouping are based on the Sum of Squared Deviations (SSD), the smaller value, the better SSD partitions are used. The purpose of this research is to identificate the autocorrelation and spatial distribution patterns also applying the modification of SKATER method on rate of crime data in Way Kanan District, Lampung. This research using secondary data obtained from 14 sub districts in Way Kanan Police Resort. The results show that 14 districts in Way Kanan autocorrelated and has a pattern of spatial distribution and four level of cluster (𝑘) has been obtained with average; 𝑘1 (Bumi Agung, 12.73%) ≥ 𝑘2 (Blambangan Umpu, 10.9%) ≥ 𝑘3 (Gunung Labuan, Baradatu, Kasui and Rebang Tangkas, 7.83%) ≥𝑘4 (Way Tuba, 7.81%).
Keywords: spatial, clustering, minimum spanning tree, SKATER, crime
INTRODUCTION
In analysis of cluster often found that there is a spatial effect which affects the characteristics of the cluster [1]. Spatial data is data that are geographically oriented and has a coordinate system [2]. If the spatial analysis carried out without involving spatial element would result in conclusions that are less precise due to the assuming the error is independent[3]. To find out whether they are met or not then the assumption needs to be tested with a spatial autocorrelation Moran's test. Analysis of cluster which involves spatial element in its analysis called spatial clustering [4].
Modification of SKATER aims to partition locations that are not homogeneous into homogeneous location, it also to get a homogenous group of internal and external heterogeneous cluster. The modifications are out on four ordinary SKATER method; three changes in the weight calculation edges and one-partitioning process. The first modification is called Orthogonal Normalized Distance. The second step is the weight calculation of edges, where 𝑑 (𝑖, 𝑗) connecting the vertices 𝑖 and 𝑗. The third step, these modifications using weights edge called Covariance Normalized Distance (CND). The last modified is the third step change from ordinary SKATER is the partitioning process called dissimilarity Between Cluster (Cluster Stretch). Several methods of SKATER have been developed and implemented by Bekti [7], Assuncao et al. [5]
and Lage
et al. [8]. The implementation and execution research on modification of SKATER are still rare, so this study will apply the modification of SKATER in crime data comprise of spoliation, robbery and gambling cases in Way Kanan District, Lampung.METHODS
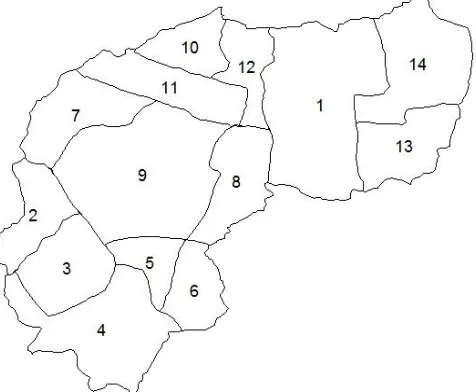
The location of this research is the Police Department Resort Way Kanan district office which consists of 14 districts (Figure 1). This study uses data which obtained from the crime rate resort district police Way Kanan, Lampung in 2014, include: the number of spoliation cases, robbery and gambling. Clustering method used is a modification of Spatial K'luster Edge Analysis by Tree Removal (SKATER). Modification of SKATER clustering method is performed on Rstudio software with the package; Rgdal, spdep, RColorBrewer, classInt and maptools.
Analysis procedure is: the first procedure is identification of dispersion pattern and spatial autocorrelation test to the crime rate with Moran's I test [9]. The second procedure, calculating the edges weight with Covariance Normalized Distance, first step is calculating the average of attributes and variance-covariance matrix. The next is counting input variance-covariance matrix in the euclidean distance. Covariance Normalized Distance was used as edges weights for connecting nodes and edges at each locations
.
The next procedure is, establishment of MST by Prim's algorithm based on graph connectivity by removing the higher edges weight [10]. The form of MST describe the closeness between locations based on variables. Last procedure, is MST partition by eliminating edge into the connections between locations in a sequence to produce the subtrees which representing every region at the study site. Partitioning results will generate clusters based on specific characteristics of three variables, namely the number of spoliation, robbery and gambling.Description of districts name in Figure 1: 1. Pakuan Ratu
2. Rebang Tangkas 3. Kasui
4. Banjit 5. Baradatu 6. Gunung Labuan 7. Way Tuba 8. Negeri Agung
9. Blambangan Umpu 10. Buay Bahuga 11. Bumi Agung 12. Bahuga 13. Negeri Besar 14. Negara Batin
RESULTS AND DISCUSSION
The test results of Moran's I spatial autocorrelation in the crime rate in Way Kanan district is presented in Table 1.
Table 1. Testing Results of Moran's I Spatial Autocorrelation
Table 1 shows that there are autocorrelation between sites, there are linkages crime rate in one location with the crime rate in other locations.
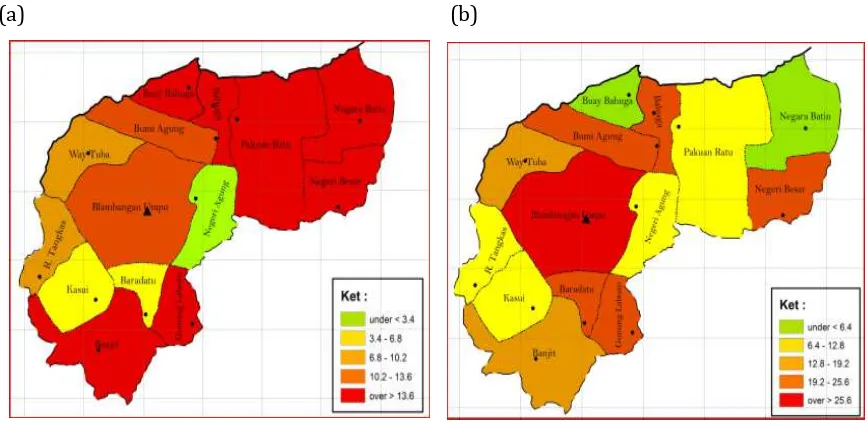
The next pattern conducted to determine the common characteristics using spatial distribution of crime rate in 2014 cases between district in Way Kanan, the detail is presented in Figure 1.
(a) (b)
Research Variables
p-value test statistics z
Decision
(c)
Figure 2.(a) The spread pattern of spoliation case (b) The spread pattern of robbery case, and (c) The spread pattern of gambling case
The spread pattern of the spoliations, robberies and gambling cases show their spatial clustering. Spatial clustering indicated by districts that have the highest robbery case (red) surrounded by other districts with high case anyway. Thus the similarity of characteristics between adjacent locations on the spatial distribution patterns in accordance with the identification of Moran's I (spatial autocorrelation).
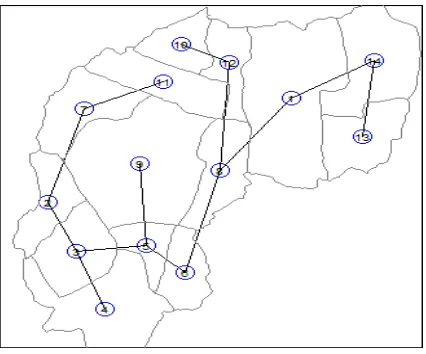
Results of generating Minimum Spanning Tree are presented in Figure 2 in the form of connectivity lines among 14 districts. The first connection connects location 13 and 14, then 14 and 1 to the last connection is location 7 and 11 are the result of generating MST.
Figure 3.Results of generating Minimum Spanning Tree
Figure 4. Results of Partition Minimum Spanning Tree
In detail about clustering modification of SKATER presented in Table 2 and Figure 4.
Table 2. Clustering Description of SKATER Modification in Crime Case
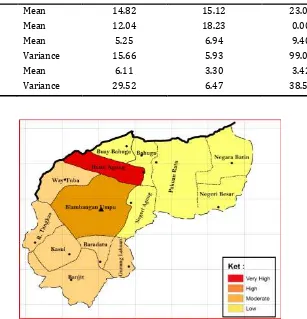
Figure 5. The Results of Cluster from SKATER Modification on Crime Cases in Way Kanan District.
Table 2 shows that the highest mean of spoliation (14.28%) and gambling cases (23.08%) are in cluster 1 and the lowest are in cluster 3 and 2 (5.25%) and (0%). Cluster 4 has the lowest mean of robbery case (3.30%) while the highest (18.23%) is in cluster 2. The variance of spoliation cases (29.52%) and robbery (6.47%) in cluster 4 and gambling cases (99.06%) in cluster 3 show
Cluster Spoliation (%) Robbery (%) Gambling (%)
𝒌𝟏 Mean 14.82 15.12 23.08
𝒌𝟐 Mean 12.04 18.23 0.00
𝒌𝟑 Mean 5.25 6.94 9.40
Variance 15.66 5.93 99.06
𝒌𝟒 Mean 6.11 3.30 3.42
CONCLUSION
The spread pattern of the spoliation, robberies and gambling cases in Way Kanan district showed their spatial clustering. Modification of SKATER clustering method produce the 4-rise cluster, it is because the mean level of crime is 𝑘1≥ 𝑘2≥𝑘3≥𝑘4.
REFERENCES
[1] J. Aldstadt and A. Getis, "Using Amoeba to Create a Spatial Weights Matrix and Identify Spatial Clusters," Geogr Anal, vol. 38 (4), pp. 327-343, 2010.
[2] E. Prahasta, Sistem Informasi Geografi, Bandung: Informatika, 2001.
[3] L. Anselin, Spatial Econometrics : Methods and Models, Dordrecht: Kluwer, 1988. [4] J. Lee and D. W. S. Wong, Statistic for Spatial Data, New York: John Wiley & Sons, 2001.
[5] R. M. Assuncao, M. C. Neves, G. Camaras and F. Costa, "Efficient Regionalization Techniques for Socioeconomic Geograph-icalunits Using Minimum Spanning Trees," International Journal of Geographical Information Science, vol. 20:7, pp. 797-811, 2006.
[6] IA. Reis, G. Camaras, R. Assuncao and AMV. Monteiro, "Data-Aware Clustering for Geosensor Networks Data Collection," Anais XIII SimposioloBrasileiro de Sensoriamento Remoto, Florianopolis, Brasil, pp. 6059-6066, 2007.
[7] R. D. Bekti, "Metode spasial SKATER untuk Pengelompokan Lokasi Berdasarkan Fasilitas Air Bersih dan Sanitasi," Jurnal Teknologi, vol. 8, pp. 53-58, 2015.
[8] J. P. Lage, R. M. Assuncao, and IA. Reis, "A Minimal Spanning Tree Algorithm Applied to Spatial Cluster Analysis," Electronic Notes in Discrete Mathematics, vol. 7, pp. 1-23, 2002.
[9] M. M. Fischer and A. Getis, "Handbook of Applied Spatial Analysis," in Springer, Berlin, Heidelberg and New York, 2010, pp. 255-278.