Strat. Mgmt. J., : 1277–1296 (2015) Published online EarlyView 8 July 2014 in Wiley Online Library (wileyonlinelibrary.com) DOI: 10.1002/smj.2287 Received 27 April 2012;Final revision received 5 December 2013
BUSINESS GROUPS IN DEVELOPING CAPITAL
MARKETS: TOWARDS A COMPLEMENTARITY
PERSPECTIVE
RAVEENDRA CHITTOOR,1* PRASHANT KALE,2and PHANISH PURANAM3
1Department of Strategy, Indian School of Business, Hyderabad, India
2Department of Strategy and Environment, Jones Graduate School of Business, Rice
University, Houston, Texas, U.S.A.
3Department of Strategy, INSEAD, Singapore, Singapore
Prior research suggests that business groups (BGs) in developing economies have emerged as alternatives to poorly developed economic institutions in these countries. In this paper, we argue that this does not imply they are always substitutes. Specifically, we consider the case of capital markets, a key economic institution: while the absence of well-developed capital markets may indeed have stimulated the emergence of business groups, we propose that BG affiliation and the scrutiny that maturing capital markets impose on firms that participate actively in them nevertheless can play a complementary role in influencing a firm’s performance. We find support for our predictions in a novel longitudinal data set of Indian firms that contain both listed and unlisted BG affiliated as well as unaffiliated firms. Copyright © 2014 John Wiley & Sons, Ltd.
INTRODUCTION
Diversified business groups (henceforth BGs) play an important role in the socioeconomic landscape of many emerging economies (see Khanna and Yafeh, 2007; Yiuet al., 2007, for a review). Such groups control and coordinate two or more dis-tinct legal firms through commonly held ownership stakes, often complemented by social ties (Guillen, 2000; Khanna and Palepu, 2000a,b; Morck, 2009). While the focus of early research on BGs was to understand the reasons for their existence, and the costs and benefits for firms affiliated with them (e.g., Guillen, 2000; Khanna and Palepu, 2000a, 2000b; Mahmood and Mitchell, 2004), recent studies examine how the performance effects
Keywords: business groups; institutional voids; capital market efficiency; organizational structure
*Correspondence to: Raveendra Chittoor, Indian School of Business, Gachibowli, Hyderabad - 500032, India. E-mail: [email protected]
Copyright © 2014 John Wiley & Sons, Ltd.
of business group affiliation vary with the quality of the institutional environments in which they are located (e.g., Carney et al., 2011; Chang, Chung, and Mahmood, 2006; Hoskissonet al., 2005). Both streams of work share an influential premise that the existence of BGs as well as the benefits of BG affiliation are best understood in terms of their pro-vision of internal alternatives to external markets for capital, labor, or other inputs, which are often poorly developed in emerging economies (Caves, 1989; Khanna and Palepu, 2000a; Leff, 1978).
It would seem intuitive that, if BGs provide alter-natives to external markets for capital and other important inputs, improvements in these institu-tions should lead to an attenuation of BG affil-iation benefits (e.g., Khanna and Palepu, 2000b; Lee, Peng, and Lee, 2008). Surprisingly, evidence from cross-sectional between-country (e.g., Carney
et al., 2011; Khanna and Rivkin, 2001) as well as
BG affiliation and the quality of the capital markets in their impact on firm performance.1 A key objec-tive of this paper is to propose an explanation for this puzzle. Our explanation as well as its test makes several novel contributions to the relevant literature. First, we accept the traditional premise that BGs may emerge as alternatives to weak economic insti-tutions such as capital markets. However, we argue that this premise is logically compatible with the idea that the internal institutions within a BG and external institutions in the economy, such as a well-developed capital market, can play a
comple-mentary role in the governance of a firm when
both exist and interact. We argue that scrutiny by
a mature capital market of firms that participate actively in it can enhance the value that a firm derives from being affiliated with a BG. Put sim-ply, we propose that BG affiliation and capital mar-ket scrutiny are complements in generating firm performance.
Second, we test our argument empirically with a unique panel dataset of 10,453 BG-affiliated and non-BG firms from India, that comprises both listed and unlisted firms, during the post-liberalization period of 1994–2009. Prior empirical work on busi-ness groups has seldom compiled and compared data on listed and unlisted BG affiliate firms—the analyses have either focused only on affiliate firms that are publicly listed or have not distinguished between listed and unlisted affiliate firms
(Car-ney et al., 2011; Claessens, Fan, and Lang, 2006;
Khanna and Palepu, 2000a, 2000b; Manikandan and Ramachandran, 2014; Singh and Gaur, 2009). In line with prior studies (Chacar and Vissa, 2005; Khanna and Palepu, 2000a, 2000b), we focus our analysis on the performance of individual firms, as it is the variation in market participation at a firm level within a BG that enables market scrutiny and allows us to test our arguments.
Third, our empirical analysis also uniquely highlights an important but underexplored feature of business groups—that many of their affiliate firms are often publicly listed on the external capital market. Such an organizational structure, which is a mix of listed and unlisted affiliate firms, is common among business groups in India; indeed, Morck (2009) argues that this is a feature that distinguishes BGs from other forms of multibusiness organization, such as holding
1 For instance, see the Discussion in Carneyet al.(2011) on p.
453 and the graph on p. 452.
companies and diversified conglomerates. For firms within a BG, capital market participation provides a channel of influence through which scrutiny by the capital market may interact with BG affiliation in jointly influencing firm strategy and performance.
Our results show that, on average, over the time period of our study, the performance effects of BG affiliation are larger for firms that are active in the capital markets than for firms that are not; further-more, as capital markets develop over time, the per-formance effects of BG affiliation strengthen more for firms active in the capital markets than for inac-tive firms. The results are robust in model estima-tions that account for the potentially endogenous nature of capital market listing (which is necessary but not sufficient for active capital market participa-tion through regular trading of stock in a firm) and BG affiliation choices.
Our arguments and evidence are critical to under-standing the future of BGs in developing economies like India as their economic institutions, in par-ticular their capital markets, mature. We point out that, given this complementarity between BG affil-iation effects and scrutiny by the capital mar-kets, the continued existence of listed BG affili-ate firms as capital market efficiency improves may not be an anomaly, and that business groups them-selves may be here to stay in emerging economies despite improvements in their ambient institutional environment.
PERFORMANCE EFFECTS OF BG AFFILIATION
Institutional voids theory and BGs as substitutes for institutions
The question of whether and how business groups create value has engaged strategic management scholars for over a decade now (see Khanna and Rivkin, 2001; Khanna and Yafeh, 2007; Yiuet al.,
widely referred to as the institutional voids per-spective, it was adopted by a number of scholars seeking to explain the prevalence of business groups and their strategies (Chang and Hong, 2002; Hoskissonet al., 2004; Khanna and Palepu, 2000a, 2000b; Khanna and Rivkin, 2001).
If the primary benefit of BG affiliation in emerg-ing economies (and indeed the rationale for their existence) stems from the absence of strong eco-nomic institutions, it seems reasonable to argue that BG affiliation effects should bemostpositive when the ambient institutional context isleastdeveloped. This in turn implies that (1) BG affiliation effects on firm performance should be larger in countries with weak economic institutions than in countries with strong institutions, and (2) within countries with weak economic institutions, BG affiliation effects should grow smaller as the quality of these institu-tions improves. Thus, Khanna and Palepu (2000b: 273) argued, “… we expect that as information flows progressively more freely in an economy and as contracts are enforced progressively more effi-ciently, it becomes more difficult for groups to gen-erate non-diversification–related benefits relative to the shifting contextual benchmark.” Other schol-ars have either explicitly or implicitly endorsed this argument (e.g., Carneyet al., 2011; Leeet al.,
2008; Singh and Gaur, 2009; Zattoni, Pedersen, and Kumar, 2009), which underscores the assumption that there is a “substitution” between BG affilia-tion effects and ambient instituaffilia-tional efficiency on firm-level performance.
A few within-country studies find evidence con-sistent with this argument. For instance, Khanna and Palepu (2000b) showed that BG affiliation effects declined over time in Chile, while Chang and Hong (2002) do the same in Korea. Changet al. (2006) show that BG affiliation positively affected inno-vation by affiliate firms in Korea but not Taiwan, and to a lesser extent in both countries over time. Yet, results from comprehensive multicountry anal-yses also cast doubts on the argument. Follow-ing a variance decomposition analysis, Khanna and Rivkin (2001) conducted exploratory analyses of the correlations between estimated BG affiliation effects and the quality of key economic and legal institutions, particularly capital markets, across 14 countries. Surprisingly, they found positive corre-lations between indicators of capital market devel-opment and the estimated BG affiliation effects across these 14 countries. They concluded that “the cross-country bivariate correlations provide no
support for either of the most widely held views of groups as responses to capital market imperfections and as rent-seeking devices” (2001: 67).
Carneyet al.(2011) conducted a comprehensive meta-analysis of BG affiliation using data from 28 countries across 141 studies. They found a small negative average effect of BG affiliation in their sample, but they also observed significant hetero-geneity around this mean (positive in six countries, negative in five countries, and no effect in seven). Even more surprising was the fact that, while the affiliation effect was positive in some countries with poorly developed capital markets, it was also pos-itive in countries with well-developed institutions, and was negative in several with obvious institu-tional voids. In the words of the authors, the puz-zle is, “Why do BG members do so well rela-tive to unaffiliated firms in contexts with generally well-functioning institutions, like Malaysia, Singa-pore, and Sweden? And why do they do so unex-pectedly poor in contexts with severe voids, like Nigeria, Pakistan, and Peru?” (Carneyet al., 2011: 453).
Further, recent evidence from “within-country” studies that employ more comprehensive data than past work also casts doubt on the idea that BG affiliation effects and the quality of institutions are substitutes. In analysis of Indian data, Siegel and Choudhury (2012) find that Indian business groups have become larger, more diversified, and have maintained a profit edge over stand-alone firms even as market institutions developed in the coun-try. They note that this stands in stark contrast to “all prior views about business groups…that busi-ness groups’ competitive advantage is in part based on the existence of weak governance and other institutions at the country level, and that the com-petitive advantage of groups should dissipate with institutional development” (Siegel and Choudhury, 2012: 5) and invites further analysis. Manikandan and Ramachandran (2014) found in their analysis of Indian business groups that, as economic reforms progressed, group-affiliated companies enjoyed the most growth opportunities. However, given that the key advantage of BG affiliation is argued to be the provision of internal strategic factor markets that are not easily accessible for nonaffiliate firms, why reforms should boost this advantage, rather than suppress it by improving access to such markets even for non-BG affiliated firms, remains unclear.
of BG affiliation in the specific context of increas-ing sophistication of the capital markets, which are one of the key economic institutions in a coun-try (also see Carney et al., 2011: 452). We argue that, while BGs may well have emerged because of the advantages they conferred in economies with weak capital markets, the relationship between them may nevertheless be one of complementar-ity rather than substitution. In the next section, we provide a more detailed explanation for the comple-mentary effect of BG affiliation and capital market scrutiny on firm performance, and test it in a sam-ple that includes both listed and unlisted BG affiliate firms (as well as unaffiliated firms that are either listed or unlisted).
Complementary effects of BG affiliation and capital market participation
We propose that BG-affiliated firms that participate in the capital markets (i.e., are listed and actively traded on a stock exchange) have unique gover-nance characteristics—they are potentially subject to capital market scrutiny in addition to the hier-archical control exercised through the controlling stake retained by the parent business group. This controlling stake may well be held through multi-layered pyramidal structures, but our point is that, ultimately, for publicly listed BG firms, the gov-ernance of the firm is distributed between a set of external public shareholders and the “promoter” of the BG.
We argue that capital market participa-tion enhances some benefits of affiliaparticipa-tion to BG-affiliated firms (relative to stand-alone firms), while the additional scrutiny associated with such participation in markets reduces some of the costs of affiliation (also relative to stand-alone firms)—thus resulting in an increase in the net impact of affil-iation. To explain exactly how, we will first catalog all the benefits and costs of BG affiliation noted in prior literature and then analyze the effects of market participation on each of these benefits and costs classified into different categories.
Costs and benefits of BG affiliation
Prior literature has extensively discussed the pos-sible benefits as well as costs of business group affiliation—we provide a thumbnail sketch of these arguments here (see Carney et al., 2011; Khanna and Rivkin, 2001; Yiu et al., 2007, for detailed
overviews). Crucially, we classify the costs and ben-efits of BG affiliation noted in prior literature in a novel manner into two categories—systemic and cross-subsidy (see Table 1).
In the first category are those BG-wide “sys-temic” costs and benefits that affect all the firms affiliated to a BG. These include potential costs of affiliation such as weakening of incentives, lack of professionalism, nepotism, and the cost of sup-porting the corporate headquarters. While these are always costs for the affiliate firms, the magnitude of the cost borne by each firm in the BG need not be the same. The potential benefits in this systemic category include access to internal capital, labor, and product markets, internal monitoring, consol-idated political lobbying, embeddedness in a social structure, and synergy effects that leave all affili-ates better off. Again, while these are always ben-efits for affiliated firms, the magnitude of benefit experienced by different firms in the BG may be different.
To elaborate on these systemic benefits and costs: in the absence of well-developed economic insti-tutions such as capital, labor, and product mar-kets, affiliation may provide a firm access to inter-nal alternatives for these resources within the BG (Khanna and Palepu, 2000a, 2000b). Capital for new projects, management talent, and inputs to pro-duction may all be accessed at lower transaction costs within the BG (Caves, 1989; Leff, 1978) than from external markets or intermediaries. Moreover, the internal hierarchical control of the BG may also discipline the management of the affiliated firm in terms of how they actually utilize the capital that is provided. BGs may also have superior access to the political power structure in the economy through their consolidated lobbying and influence efforts— and hence they may benefit from a richer pool of opportunities (Khanna and Rivkin, 2001) in the country. As with other forms of multibusi-ness organization, BGs can also potentially leverage economies of scale and scope, particularly those of a nonrivalrous nature (Chang and Hong, 2000; Mah-mood and Mitchell, 2004). In addition, BGs and their affiliates also represent a social structure char-acterized by repeated interaction, family ties, and rich information flows; consequently, the costs of transacting within the BG may be lower than that for comparable transactions between independent firms (Granovetter, 1995; Guillen, 2000).
Table 1. Effect of market participation on the costs and benefits of BG affiliation
Hypothesized costs and benefits of BG affiliation
Reference in prior literature
Effect of market participation on BG affiliation effect
Category 1 (systemic) costs
1. Due to security offered by the group, managers have weaker incentives to perform
Khanna and Rivkin (2001) The cost of affiliation reduces as market scrutiny raises managerial incentives (Chung and Jo, 1996)
2. Managerial entrenchment and nepotism are often prevalent in family- owned BG firms
Chang and Hong (2000) and Bertrandet al.(2002)
The cost of affiliation reduces due to market scrutiny (Ball and Shivakumar, 2005; Jain and Kini, 1999)
3. Groups HQ may undertake certain central functions that may not be beneficial to companies and pass on the “burden” to companies
Khanna and Palepu (2000a) and Khanna and Rivkin (2001)
The cost of affiliation reduces due to market scrutiny
Category 1 (systemic) benefits
1. Access to internal capital markets: Projects may go unfunded as
transaction costs of accessing external capital are higher. BG firms can access internal capital markets
Williamson (1985), Chang and Hong (2000) and Khanna and Rivkin (2001)
External markets can provide additional capital (as long as the need for capital is not fixed), and the benefit of affiliation increases 2. Access to coordinated political
lobbying:
Access to political power is important as government plays a significant role in business
Amsden (1989) and Ghemawat and Khanna (1998)
Remains unchanged
3. Access to internal product and technology markets:
There is paucity of participants due to weaker contract enforcement. By investing in brand and reputation, BGs can mitigate the fear of opportunistic behavior and attract participants BGs can also facilitate trading internally
Khanna and Palepu (2000a, 2000b) and Khanna and Rivkin (2001)
Remains unchanged
Category 2 (cross-subsidy) costs and benefits
1. Firms may be obliged to get inputs from fellow BG firms even if not efficient, due to group (and family ownership) considerations
Chang and Hong; Chacar and Vissa (2005)
The cost of affiliation reduces due to market scrutiny for the affected firms; but the benefit to other firms also reduces 2. Principal to principal problems:
Controlling shareholders taking advantage of minority shareholders— tunneling
Bertrandet al.(2002) and Siegel and Choudhury (2012)
The cost of affiliation reduces due to market scrutiny for the affected firms; but the benefit to other firms also reduces 3. Cross-subsidization: Poorly performing
firms are propped up by subsidization by better performing firms
Khanna and Rivkin (2001) and Chacar and Vissa (2005)
within a BG while they are benefits for others in the same BG. We call this the “cross-subsidy” cat-egory. For instance, scholars have suggested that one of the most important costs to individual firms of being affiliated with a BG arises from conflicts between the interests of the BG promoter and those of other shareholders (Keister, 1998; Khanna and Palepu, 2000a). BGs often have controlling stakes in several firms but may not have proportionately significant cash flow rights in many of them. This creates incentives for the BG to expropriate and transfer profits from firms in which the BG has low cash flow rights to firms where it has high cash flow rights—also known as tunneling (Morck and Yeung, 2003). Bertrand, Mehta, and Mullainathan (2002) find some evidence that controlling share-holders of Indian business groups engage in tun-neling (though also see Siegel and Choudhury, 2012, for a revisionist view). BGs also serve to reduce bankruptcy and survival risks of weaker affiliates (Chacar and Vissa, 2005; Ferris, Kim, and Kitsabunnarat, 2003), but may do so at a cost to stronger members through cross-subsidization.
Although there is a fair degree of convergence in the literature on this list of potential costs and benefits of BG affiliation, agreement on their net impact on an affiliated firm’s performance remains elusive. Thus, the debate continues as to whether BGs are “paragons or parasites” (Fisman and Khanna, 2004; Khanna and Yafeh, 2007), “avatars or anachronisms” (Granovetter, 2005), and there is a wide variation in estimated affiliation effects observed across countries and studies (Carney
et al., 2011; Khanna and Rivkin, 2001).
Effects of market participation and scrutiny on systemic effects of BG affiliation
The effects of market participation and increased market scrutiny that we propose on these cat-egories of costs and benefits are also summa-rized in Table 1. We argue that market scrutiny can potentially lower some of the BG affiliation costs of the systemic category. First, for listed and actively traded firms in a BG, market scrutiny and reporting by equity analysts can minimize managerial entrenchment and owner opportunism that are often prevalent in family-owned BG firms (Jain and Kini, 1999). Second, managerial incen-tives may also be improved by creating more eas-ily tracked metrics of corporate performance (e.g., share price) (Chung and Jo, 1996). Third, capital
market participation and the resultant checks may restrict the involvement of a firm in any BG-level synergy programs, unless they directly benefit the focal firm (see, for example, Ball and Shivakumar, 2005, on the earnings quality improvements in pub-lic firms). Thus, for each of the traditional costs feared to affect all BG-affiliated firms—weakening of managerial incentives, nepotism, entrenchment, bloated HQ—active participation in capital markets and the scrutiny it entails may serve to reduce each of them.2
In addition to reduction in costs, some of the benefits in this systemic category of BG affiliation effects could also increase with capital market participation. BGs create operating leverage by accumulating some generic resources and capabilities such as reputation/trust, brands, man-agerial capabilities, operational knowledge, and so on, which can be leveraged to identify new opportunities and enter multiple businesses and industries (Guillen, 2000; Siegel and Choudhury, 2012; Lamin, forthcoming). For example, consider reputation as a generic BG-level resource. The eco-nomic benefits of BG reputation accrue to affiliated member firms by reducing their costs of dealing with various stakeholders—customers, suppliers, alliance partners, employees, and providers of capital.
BG owners can take advantage of their reputation to raise capital from external markets and generate financial leverage, by which they are able to exploit more opportunities than is possible with their own funds. Investors may prefer to invest in firms with the best operational knowledge, which translates into an advantage for BG firms over independent firms in raising capital from markets. Thus, as long as there are more opportunities confronting a BG than can be funded internally, the access to capital markets not only provides access to additional capital, but also the terms for doing so may be more favorable for a BG-affiliated firm (see, for instance, Byun et al., 2013, and Marisetty and Subrahmanyam, 2010, for some evidence on the
2 As the Group HR head at one of India’s largest BGs observed,
preferential terms under which BGs may access capital).
Further, to the extent that affiliated firms benefit from the business groups’ internal markets for tal-ent, products, and capital, the presence of external shareholders may improve the efficiency of these internal markets. Capital and talent allocation, the search for new opportunities, and the sharing of corporate resources in an affiliated firm may all be conducted more efficiently and effectively under the scrutiny of the capital market (Chung and Jo, 1996; Jain and Kini, 1999). In particular, the possibility of creating incentive compensation based on the prices of publicly traded shares of the firm may leverage the value of any BG-level talent management practices.
For all these reasons, participation in an efficient capital market should raise the systemic benefits and lower the systemic costs of BG affiliation. To illustrate these ideas, consider the Tata Group, which has incorporated a number of centralized ser-vices on a “no-profit no-loss” basis including group HR, quality management services, public affairs department, legal services, labor relations bureau, and so on. All these services are potentially avail-able to each of the Tata companies—but, given their independent governance structure, particularly for the listed entities, each company has complete free-dom to decide whether it wants to use them or not. Our conversations with the heads of four of the Tata Group’s listed companies indicates that, while they do find these services useful, given their respon-sibilities to external shareholders, they are careful about utilizing them only when theyareuseful. In other words, the search for advantages through BG affiliation may be more disciplined and effective when conducted under capital market scrutiny.
Effects of market participation and scrutiny on cross-subsidy effects of BG affiliation
We argue that the effect of increasing market scrutiny on the second cross-subsidy category of costs and benefits is either neutral or perfor-mance improving: while cross-subsidization may be lowered with scrutiny, because some firms within the BG benefit less as a consequence, there can be no change in the average BG affil-iation effect (if there are frictions accompanying cross-subsidization, then there may even be an improvement, strengthening the affiliation effect). For example, for actively listed firms in a business
group, outside shareholders and equity analysts can check attempts at tunneling by the promoters of a BG or encourage them to engage in more transparent transactions. This would lead to less tunneling and, as a consequence, fewer benefits flowing to firms in which the BG owners have higher cash flow rights, and fewer costs to firms in which the promoters do not have larger cash flow rights. Thus, overall, we expect that capital market participation by BG firms would lower the costs of BG affiliation (due to the associated scrutiny and improved corporate governance) and also raise the BG-associated benefits for the concerned firm.
While we have argued above that capital market participation magnifies the effect of BG affiliation, it is to be noted that the reverse is also true. That is, BG affiliation could increase the benefits of capital market participation and reduce its costs. There is extensive prior evidence (e.g., Jain and Kini, 1994; Mikkelson, Partch, and Shah, 1997) that firms exhibit a decline in operating performance after they go public. Explanations for this range from agency costs, earnings management, to productivity shock theory (Chemmanur, He, and Nandy, 2010; Jain and Kini, 1994). As capital market participa-tion is likely correlated with listing, the net effect of capital market participation on firm performance is also likely to be negative. BG affiliation adds a layer of oversight over the management of the firm, mitigating some of the costs of capital market par-ticipation, particularly agency costs. BG affiliation may also enhance the ability of a firm to participate in the capital markets on favorable terms, thereby reducing the need for creative accounting compared to stand-alone firms. In other words, BG affiliation benefits and capital market participation comple-ment each other such that the marginal effect of the former on firm performance is enhanced in the presence of the latter (Cassiman and Veugel-ers, 2006; Milgrom and Roberts, 1990). Hence, we hypothesize,
Hypothesis 1: The performance effects of BG affiliation are larger for firms in which there is significant capital market participation (e.g., through active trading of listed stock) than for firms without significant capital market participation.
effect if the BG affiliation effect was negative, and a more positive BG affiliation effect if the BG affiliation effect was positive. Capital market scrutiny requires the capital markets to operate with some degree of informational efficiency, and, in Hypothesis 1, we assume that the capital markets are capable of some degree of scrutiny. However, this cannot be presumed in developing economies; indeed, the absence of strong institutions such as well-developed capital markets may have prompted the emergence of BGs. An additional and superior test can be constructed by utilizing the fact that as capital market efficiency improves, the benefits of this scrutiny (in terms of either reducing the costs of BG affiliation or enhancing the benefits of it, as the case may be) should become stronger. This is because the effectiveness of market participation as a governance mechanism that improves trans-parency and discipline should increase as capital markets and related institutions develop. However, for firms that do not participate in the capital markets, the scrutiny effect of improving capital markets on the BG affiliation effect will not be experienced. Thus, to the extent that cap-ital market participation is the channel through which complementarities between BG affiliation and the scrutiny by the capi-tal market institutions are realized, we should expect that
Hypothesis 2a: As capital markets develop, the performance effects of BG affiliation should increase for firms with significant capital market participation.
Hypothesis 2b: As capital markets develop, the performance effects of BG
affilia-tion should increase more for firms
with significant capital market
par-ticipation than for firms without such
participation.
Both our hypotheses are rooted in the idea that business groups and capital markets, while alternate sources of funding, can nevertheless play complementary roles in the governance of a firm; the opposite predictions would have arisen from the perspective that they are substitutes (e.g., Lee et al., 2008; Singh and Gaur, 2009). However, it is important to note that the idea that BGs emerge in economic environments
with weak capital and other markets is still compatible with either the substitution or the complementarity perspective that we suggest here. This is because, in either case, BG affiliation could have an additional independent positive marginal effect besides an interactive effect with capital market participation—irrespective of whether that interaction is one of complementarity (as we have argued) or of substitution (which would lead to opposite predictions from our hypotheses).
METHODS
Sample
During the last two decades, the Indian economy in general and the capital markets in particular have been undergoing significant changes and wit-nessed substantial improvement in its economic institutions—this provides a useful context to test our ideas. Facing a severe crisis in its balance of payments position in 1991, the Indian govern-ment triggered a series of economic liberalization measures to establish stronger linkages with the global economy and improve free market mech-anisms in the country. An important category of reforms focused on the founding and develop-ment of market institutions to bring about efficient intermediation in financial, legal, labor, and reg-ulatory domains. For example, the Securities and Exchange Board of India (SEBI) was established in 1992 on the lines of the Securities Exchange Commission (SEC) in the United States, and a new stock exchange by the name of the National Stock Exchange (NSE) was established in 1994. We select the post-liberalization period of 1994–2009 (16 years) for our study. During this period, the cap-ital markets in India experienced significant devel-opment. For instance, the number of mutual fund companies in India grew from 9 in 1993 (with assets under management of about US $10 billion) to about 33 in 2003 (with assets under manage-ment of US $26 billion) and, by 2009, assets under management were nearly US $110 billion. Market capitalization of listed companies as a percentage of GDP (which is widely considered as a proxy for capital market development) in India went up from about 18 percent in 1991 to over 46 percent in 2003 and, in 2009, this ratio was close to 90 percent.
least three key reasons why Indian firms constitute an ideal sample to test our predictions: (1) firms belonging to business groups form an important part of the Indian corporate sector—they constitute about one third of the proportion in terms of the number of firms, and over two thirds of the propor-tion in terms of revenues and profits; (2) informa-tion about group affiliainforma-tion is transparent and fairly unambiguous in India as these firms publicize their group affiliation and each firm is a part of only one group (Khanna and Rivkin, 2001); and (3) detailed performance data is available on a comprehensive sample of both listed and unlisted firms in India over a long period. The data on unlisted firms is quite valuable as one of the key reasons for exclud-ing unlisted firms in the previous studies of other economies has been the lack of adequate data.
To build our sample, we use the Prowess database from the Centre for Monitoring Indian Economy (CMIE) (e.g., Chacar and Vissa, 2005; Khanna and Palepu, 2000a; Khanna and Rivkin, 2001). Prowess also has an advantage from our study’s point of view as it uniquely identifies a firm’s business group membership through a rigorous, on-going process (Khanna and Rivkin, 2001). We exclude firms from the financial sector and the government sector as the returns in these sectors are not comparable with the returns in the other sectors of the economy (Khanna and Rivkin, 2001). As we are primarily interested in the Indian private sector, we also exclude the subsidiaries of foreign multinationals operating in India. Based on these criteria, we had a list of 16,716 firms in the Prowess database for which some financial data are available during 1994–2009. Since this set includes many very small companies with hardly any data, we exclude all small firms that have never exceeded an annual income of US $250,000 during the whole study period. We also eliminated 2,128 observations where a firm’s return on assets was more than four standard deviations away from the sample mean, as these are very likely to be mistakes or misrepresentations (Khanna and Rivkin, 2001). In our eventual sample, we have an unbalanced panel of 10,453 Indian firms with all available data for the 1994–2009 period.
Dependent variable
Performance (return on assets)
We choose the most commonly used financial measure of firm performance that can be obtained
for both listed and unlisted firms, namely, return on assets (ROA) adjusted for industry. We measure it as profit before interest and tax divided by total assets, adjusted for nonrecurring transactions (Chacar and Vissa, 2005; Khanna and Palepu, 2000a, 2000b). We use the industry-adjusted ROA after subtracting the average ROA for the firm’s industry (at the two-digit level) from the firm’s ROA.
Independent variables
Business group affiliation
Following prior research, we operationalize a firm’s affiliation to a BG using a simple dummy vari-able, which takes a value 1 if the firm is owned by a BG and 0 if it is not the case. In line with past research on performance effects of BG affil-iation for Indian firms (Chacar and Vissa, 2005; Khanna and Palepu, 2000a), we adopt CMIE’s clas-sification of firms to identify whether an individ-ual firm belonged to a business group or if it was a stand-alone firm. CMIE uses a variety of sources to classify firms into various ownership groups based on continuous monitoring of company shareholding, new announcements, and a qualita-tive understanding of the group-wise behavior of individual companies.
from the data in cases where their affiliation sta-tus changed in this way, or assigned them an unaf-filiated status throughout the observation window. However, we chose to exploit this variation by con-ducting our basic analyses with a time-varying BG affiliation dummy. In our additional analyses, we also re-estimated all models with a time-invariant BG dummy.
(Capital) market participation
We use a dummy variable to measure whether a firm is participating actively in the capital market and hence under market scrutiny or whether that is not the case, in any given year. To operationalize this, we first check if the firm was listed on the largest domestic stock exchange in India, namely, the Bombay Stock Exchange (BSE). The market participation dummy takes a value of 1 if (1) a firm is listed on BSE under the categories A, B, or T, which include firms that are regularly traded on the market (we exclude Z category, which includes firms that do not comply with listing requirements and are rarely traded); and (2) a market price is available for a firm in any given year; otherwise it takes a value of 0. We adopt this approach (which we also test the robustness of) because in our view the governance benefits of participation in the capital markets accrue only when the stock is actively traded.
BSE, which was established in 1875, is the oldest stock exchange in India. For our operationalization, we chose listing on BSE over listing on the NSE (a stock exchange established more recently), as the number of firms listed on BSE is over three times the number of firms listed on the NSE; further, nearly all the NSE firms are also listed on BSE.
Capital market development index
In line with past studies (Carney et al., 2011; Guillen, 2000; La Porta et al., 1997), we relied on the two widely considered indicators of capital market development—better investor protection, transparency, and enforcement—namely, (1) market capitalization of listed companies as a percentage of GDP, and (2) the domestic credit pro-vided by the banking sector as a percentage of GDP (both measures are made available by the World Bank; see http://data.worldbank.org/indicator). We created an index combining these two mea-sures with equal weights. We also checked the
robustness of our analyses using each measure separately.
Control variables
To control for the effect of other factors that also may affect the variables of interest in our study, we include a comprehensive set of other variables in our analyses (Khanna and Palepu, 2000b; Vissa, Greve, and Chen, 2010).Firm size, measured as a natural logarithm of net sales revenues of a firm in each year, is used to account for the effect of size on firm performance. Given that the capital structure of a firm has a significant influence on its finan-cial performance, we use Debt-equity ratio, mea-sured as the ratio of total debt to equity (net worth) of a firm, as a control. The effect of firms’ invest-ment into heterogeneous resources and capabilities on performance is captured through proxies for their technical and marketing investments—R&D inten-sityis measured by taking a ratio of a firm’s annual R&D expenses to its sales; Marketing intensityis a ratio of its total annual marketing expenses to its annual sales for that year. TheAgeof each firm since its founding, in years, is used as a measure of its experience.
We also use a set of variables to control for attributes of the business group each firm is affil-iated with: BG diversity reflects the degree of the diversification of the parent business group. As in previous studies (Khanna and Palepu, 2000a, 2000b), we measure it as a count of the two-digit industries to which its member firms belong. To elaborate, if a BG has 10 member firms operat-ing in eight distinct (two-digit) industries, then the diversity of the said BG is 8. At the firm level, this means that each of the 10 member firms belongs to a group with a BG diversity of 8. The BG diversity for firms not affiliated to any business group is set at a baseline of 1. We also created a second mea-sure of diversity, which has been frequently used in prior research, namely, the Herfindahl or entropy measure (Palepu, 1985). We used it to assess the robustness of our findings. To further control for BG-related effects, we created two measures ofBG size: (1) a simple count of the number of firms in the BG, and (2) a natural logarithm of the total sales of the firms in the BG. Due to high correlation among the various BG-related variables, we include
onlyBG diversity in the reported models. Finally,
present. To ensure that we separate out all the unob-served year effects, including macroeconomic and environmental effects, we also use 15 year dum-mies to control for period effects pertaining to the study period. In some of the estimations, we used an alternative measure, namely, a “time clock” to represent each year in terms of the number of years elapsed since the beginning of our study period (1994).
Model specification
We estimate our models using panel regression procedures. Panel estimation procedures allow us to control for unobserved firm-level heterogeneity and thereby reduce the possibility of biased parameter estimates and spurious results (Greene, 1997). The equations used to test Hypotheses 1 and 2 have the general form:
ROAi,t=𝛿M+𝜃.BGaffiliatei,t+𝜑M.BGaffiliatei,t
+𝛽[Controlsi,t]
+𝛼i+ui,t (1)
where subscripts refer to firm i at time t, 𝛼i is the firm-specific unobserved effect, andui,t is the error term.Mrepresents the capital market-related variables—Market Participationit in the test of Hypothesis 1, where Hypothesis 1: 𝜑 >0,
and CapitalMarketDevelopmentt in the test of
Hypothesis 2, where Hypothesis 2: 𝜑 >0. To test Hypothesis 1, Equation 1 is estimated on the full sample of listed and unlisted, affiliated and nonaffiliated firms; to test Hypothesis 2, we separately estimate Equation 1 on samples of firms with Market Participationit=0 and Market Participationit=1.
RESULTS
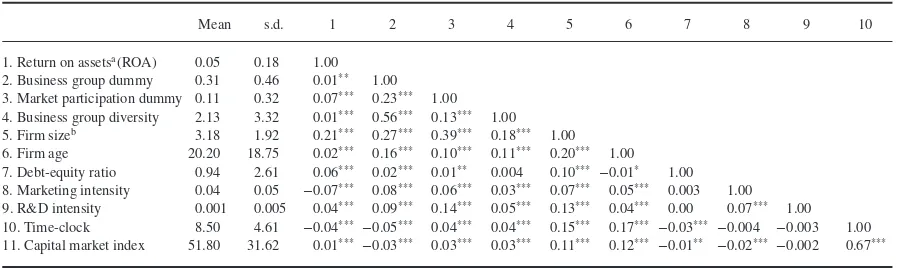
Descriptive statistics
Table 2 reports the descriptive statistics and Pearson correlations for all the variables. About 31 percent of the sample firms are affiliated with business groups, while the rest are stand-alone firms (3,145 out of 10,453 firms in our dataset were affiliated at some point with a BG; of these, 463 changed their affiliation status over time). About 11 percent of the sample firms are active in the capital mar-kets (i.e., listed as well as actively traded on the stock exchange), while the rest are not listed or
actively traded. The total number of distinct BGs in our dataset is 479. Of these, only 31 BGs have no listed firms at all. In 280 BGs, more than 50 percent of the affiliated firms were listed and, in 96 BGs, that number was over 75 percent. The most diver-sified business group in our sample has firms in 25 distinct two-digit industries, while the average busi-ness group is present in 2–3 industries at a point in time.
Tests of hypotheses
Equation 1 could be estimated either by linear panel data models with fixed or random effects. A Hausman test rejects the hypothesis of ran-dom effects in our data (𝜒2=383.08, df=21,
p<0.0001), so we focus on fixed effects estimates for our results. The correlation between firm fixed effects and covariates is−0.68, suggesting that ran-dom effects models (which assume this correla-tion is 0) would lead to serious biases in inference. Prior studies on business groups that have longi-tudinal data have often relied on random effects models (e.g., Khanna and Palepu, 2000a, 2000b; Zattoni et al., 2009). The reason cited for this specification is the time-invariant nature of the key independent variable of interest, namely, BG affiliation. In our study, we can estimate the BG affiliation effect in fixed effects models because there is some variation in BG affiliation status (about 15% of firms undergo changes in affiliation status over time because their parent BG expands or shrinks around the two-affiliate firm thresh-old). However, as we will show in the section on additional analyses, since our hypotheses involve interactions with BG affiliation dummy rather than the main effect, the results remain qualitatively unaltered even in a subsample with time-invariant BG-affiliation status estimated using fixed effects.
Table 2. Means, standard deviations, and correlations
Mean s.d. 1 2 3 4 5 6 7 8 9 10
1. Return on assetsa(ROA) 0.05 0.18 1.00 2. Business group dummy 0.31 0.46 0.01** 1.00 3. Market participation dummy 0.11 0.32 0.07*** 0.23*** 1.00 4. Business group diversity 2.13 3.32 0.01*** 0.56*** 0.13*** 1.00 5. Firm sizeb 3.18 1.92 0.21*** 0.27*** 0.39*** 0.18*** 1.00 6. Firm age 20.20 18.75 0.02*** 0.16*** 0.10*** 0.11*** 0.20*** 1.00 7. Debt-equity ratio 0.94 2.61 0.06*** 0.02*** 0.01** 0.004 0.10*** −0.01* 1.00 8. Marketing intensity 0.04 0.05 −0.07*** 0.08*** 0.06*** 0.03*** 0.07*** 0.05*** 0.003 1.00 9. R&D intensity 0.001 0.005 0.04*** 0.09*** 0.14*** 0.05*** 0.13*** 0.04*** 0.00 0.07*** 1.00 10. Time-clock 8.50 4.61 −0.04*** −0.05*** 0.04*** 0.04*** 0.15*** 0.17*** −0.03*** −0.004 −0.003 1.00 11. Capital market index 51.80 31.62 0.01*** −0.03*** 0.03*** 0.03*** 0.11*** 0.12*** −0.01** −0.02*** −0.002 0.67***
aFor ease of description, we provide here the firm ROA, though we used industry-adjusted ROA in our analysis.
bNatural logarithm.
*p<0.05; **p<0.01; ***p<0.001.
are not advantaged in terms of creating stronger performance effects from affiliation. Model 2 in Table 3 includes the market participation variable in addition to the control variables. The coefficient of market participation is found to be negative and statistically significant (𝛽= −0.029, p<0.001). While our theory is agnostic to the main effect of market participation, we investigated whether this relationship is robust to different lag structures for the market participation variable, and it is. This is in line with past evidence (e.g., Chemmanuret al.,
2010; Jain and Kini, 1994) that firms underperform post-listing. Though our measure of capital market participation requires a firm to be both listed and actively traded, it is highly correlated with listing (0.44, p<0.000) and hence shows a similar rela-tionship with ROA. In additional analysis, which we report later, we assess the possibility of market participation being endogenous (because it is only observed conditional on listing).
In Hypothesis 1, we predicted that the perfor-mance effects of BG affiliation are larger for firms that participate in the capital markets than for firms that do not. We test this relationship by including the interaction term between the BG dummy and
Mar-ket Participationdummy in our analysis. The
coeffi-cient for the interaction term between BG affiliation and firm’s market participation is positive and statis-tically significant in Model 3 (𝛽=0.016,p<0.01). This is an economically significant effect as well, given that the mean ROA in our sample is 0.05. We also verified that the results are robust to lagging the market participation dummy by 1–3 years.
A rigorous test of complementarity is based on the concept of supermodularity (Milgrom and Roberts, 1990). Complementarity between two
elements exists when the marginal return to one element increases as the other element increases. In our case, this would lead to the hypothesis (Cassiman and Veugelers, 2006):
∅11− ∅10≥∅01− ∅00
where the first subscript refers to BG affiliation (1 if affiliated, 0 if not) and the second subscript refers to market participation (1 if participates in the market, 0 if not). The above inequality implies that performance difference between affiliated and listed firms and affiliated and unlisted firms is greater than the performance difference between unaffiliated and listed firms and unaffiliated and unlisted firms. When we test for 𝜙11− ∅10≥∅01− ∅00 in Model 3 (Table 3) where Φ11=0.016 (s.e.=0.006); Φ10=0.001 (s.e.=0.007); Φ01= −0.036 (s.e.=0.005); and Φ00=0.040 (s.e.=0.007), the null of no difference is rejected (F=25.79,p<0.001). Thus, the results support Hypothesis 1.
To test Hypotheses 2a and 2b, we conduct the tests separately on a sample of firms with Market
Participation=0 (Models 4 and 5 in Table 3) as
well asMarket Participation=1 (Models 6 and 7 in Table 3). For the sake of brevity, we only discuss the results of the full models here (Model 5 and 7). When we consider the sample of firms with
Market Participation=0, the coefficient for the
BG dummy–capital market index interaction term is not statistically significant (Model 5,𝛽=0.001,
Business
Gr
oups
in
De
veloping
Capital
M
ark
ets
1289
Table 3. Joint effects of capital market participation, capital market development, and BG affiliation on ROAa
ROA ROA ROA
ROA (sample for MarketParticipation=0)
ROA (sample for MarketParticipation=1)
FE models Model 1 Model 2 Model 3 Model 4 Model 5 Model 6 Model 7
Intercept 0.040***(0.007) 0.038***(0.007) 0.040***(0.007) 0.040***(0.008) 0.042***(0.009) 0.012 (0.013) 0.028* (0.013)
Firm sizeb 0.032***(0.001) 0.033***(0.001) 0.033***(0.001) 0.033***(0.002) 0.033***(0.002) 0.035***(0.003) 0.035***(0.003)
Firm age −0.006***(0.000) −0.005***(0.000) −0.005***(0.000) −0.005***(0.000) −0.005***(0.000) −0.006***(0.001) −0.006***(0.001)
Debt-equity ratio 0.001***(0.000) 0.001***(0.000) 0.001***(0.000) 0.002***(0.000) 0.002***(0.000) −0.003* (0.001) −0.002* (0.001)
Marketing intensity −0.430***(0.052) −0.428***(0.052) −0.428***(0.052) −0.425***(0.058) −0.425***(0.058) −0.466***(0.083) −0.470***(0.083)
R&D intensity −0.245 (0.200) −0.222 (0.200) −0.213 (0.199) −0.148 (0.253) −0.144 (0.252) −0.160 (0.281) −0.155 (0.282)
BG diversity 0.001 (0.002) 0.001 (0.002) 0.001 (0.002) −0.001 (0.003) −0.002 (0.003) 0.004** (0.001) 0.004** (0.001)
BG dummy
(1 if affiliated to BG, 0 otherwise)
0.006 (0.007) 0.006 (0.007) 0.001 (0.007) 0.007 (0.009) 0.000 (0.010) 0.008 (0.007) −0.014 (0.010)
Market participation dummy (1 if listed and actively traded, 0
otherwise)
−0.029***(0.004) −0.036***(0.005)
BG dummy×market participation dummy
0.016**(0.006)
Capital market index −0.001* (0.001) −0.002** (0.001) 0.002***(0.001) −0.000 (0.001)
BG dummy×Capital market index 0.001 (0.001) 0.004** (0.002)
Year dummies Included Included Included Included Included Included Included
FE model indices
Goodness of estimation F=41.05*** F=39.78*** F=38.10*** F=36.06*** F=35.13*** F=12.62*** F=12.67***
Number of observations 68,530 68,530 68,530 60,343 60,343 8,187 8,187
aUnstandardized regression coefficients with robust standard errors corrected for nonindependence within firms in parenthesis. bNatural logarithm.
+
p<0.10; *p<0.05; **p<0.01; ***p<0.001.
©
2014
John
W
ile
y
&
Sons,
L
td.
Str
a
t.
Mgmt.
J.
,
36
:
1277
–
1296
(2015)
DOI:
p<0.01) thus supporting Hypothesis 2a. To test Hypothesis 2b, we also need to find out whether or not the observed difference in the coefficient of the interaction terms in Models 5 and 7 is significant. We used a Wald test utilizing the estimated coeffi-cients and the standard errors (Laursen and Salter, 2006) and find that the difference is statistically significant (p<0.10). Thus, the results also support Hypothesis 2b. When we re-ran these models using each component of the capital market index separately, we find that the support for Hypothesis 2a is robust, and that the support for Hypothesis 2b is stronger with the credit-based rather than the capitalization-based measure of capital market development.
Robustness checks and additional analysis
Is listing/market participation endogenous?
WhileMarketParticipationis not entirely a choice variable for the firm (as it depends on active trading conditional on listing), it is still true that listing itself may be endogenous. While the firm fixed effects account for stable unobserved features of the firm that may be correlated with MarketParticipation, time-varying unobserved effects cannot be ruled out. This poses a threat to the validity of our conclusion that Hypothesis 1 is supported. We therefore implement a panel instrumental variables regression model (Baltagi, 2005) to account for the possibly endogenous nature of market participation. To estimate an instrumental variables regression for panel data, we need an exogenous instrument for
MarketParticipationit. Wooldridge (2008) defines
a good instrument as one that is (1) correlated with the independent variable concerned, and (2) uncorrelated with the error term. We therefore need an instrument that is correlated with capital market participation but is uncorrelated with the error term in our model represented by Equation 1.
Listing ratio(the proportion of the listed firms in the industry in which the firm is present) appears to be a plausible instrument (also see Tribo, 2009). Initial public offerings (IPOs) come in waves and have a clear sectoral and temporal element (Rit-ter and Welch, 2002). This is due to the effect of mimetic isomorphism and the tendency of the firms to copy other firms in the same industry, including in listing. However, these mean values of listing proportion at the industry level will be uncorrelated with the specific error terms that affect a firm’s performance equation. We carried out a
separate analysis using Listing ratio as an instru-ment. As our variable of interest, namely, the inter-action term ofBG dummy×MarketParticipationis also likely to be endogenous, we use the inter-action term BG dummy×Listing ratio as a sec-ond instrument (e.g., Angrist and Krueger, 1991). Table 4, Models 8–10, present the results of the panel instrumental variables regression. The first stage regression (Model 8) shows that the instru-ment is associated withMarketParticipationas we expect. Consistent with expectations, the coefficient estimate of Listing ratio is positive and statisti-cally significant (𝛽=0.601, p<0.001). Model 10 of Table 4 gives the results from the second stage of instrumental variables regression. The interaction term between BG affiliation and MarketParticipa-tiondummy is positive and statistically significant (𝛽=0.069,p<0.10), as predicted in Hypothesis 1. As an alternative check on possible self-selection into being listed, we also re-estimated the models to test Hypothesis 1 for a subsample of all listed firms (whether actively traded or not); in this
sam-pleMarketParticipationshould vary for reasons that
are out of a firm’s control, as it arises only due to active trading. The results in Table 4 (Model 11, 𝛽=0.015,p<0.05) show the results for Hypothe-sis 1 are robust. Interestingly, the interaction of BG affiliation with listing alone (firms that are listed, regardless of whether they are actively traded or not) is insignificant (Table 4, Model 12), showing that the governance benefits of capital market participa-tion do not arise from listing alone, but from active trading conditional on listing. These results are reas-suring that self-selection into listing is not the driver of our results.
Business
Gr
oups
in
De
veloping
Capital
M
ark
ets
1291
Table 4. Robustness testsa
Instrumental variable panel regression Firms with time-invariant MarketParticipationb
Market Participation dummy
BG dummy×Market
Participation dummy ROA ROA
Model 8 Model 9 Model 10 Model 11 Model 12
FE models (Listedb=1) (Full sample)
Intercept −0.072***(0.006) −0.098***(0.005) 0.041***(0.008) 0.061***(0.010) 0.040***(0.007)
Firm sizec 0.015***(0.001) 0.004***(0.000) 0.034***(0.001) 0.030***(0.002) 0.032***(0.001)
Firm age 0.002***(0.000) 0.002***(0.000) −0.005***(0.000) −0.006***(0.001) −0.006***(0.000)
Debt-equity ratio −0.001*(0.000) 0.000 (0.000) 0.001***(0.000) −0.003**(0.001) 0.001***(0.000)
Marketing intensity 0.071***(0.019) 0.028* (0.013) −0.422***(0.020) −0.442***(0.066) −0.430***(0.052)
R&D intensity 0.827***(0.153) −0.121* (0.109) −0.126 (0.165) −0.301 (0.226) −0.245 (0.200)
BG diversity 0.004***(0.001) 0.009***(0.001) 0.000 (0.001) 0.005***(0.001) 0.001 (0.002)
BG dummy
(1 if affiliated to BG, 0 otherwise)
0.005 (0.007) 0.247***(0.005) −0.017 (0.015) −0.008 (0.010) 0.006 (0.009)
Listing ratio (Instrument 1) 0.601***(0.029) −0.133***(0.021)
BG dummy×listing ratio (Instrument 2) 0.091** (0.033) 0.930***(0.024)
Market participation dummy
(1 if listed on BSE and actively traded, 0 otherwise)
−0.131*(0.047) −0.024***(0.006)
BG dummy×Market participation dummy 0.069+(0.039) 0.015*(0.007)
Listed (time-invariant) dummyb
BG dummy×listed (time-invariant) dummyb 0.001 (0.012)
Year dummies Included Included Included Included Included
FE model indices
Goodness of estimation F=189.89*** F=536.86*** 𝜒2=3394.70*** F=14.42*** F=39.39***
Number of observations 68,530 68,530 68,530 10,526 68,530
aUnstandardized regression coefficients with robust standard errors corrected for nonindependence within firms in parenthesis. bTime-invariant listed dummy—1 if listed on BSE in any year during the study period (1994–2009), 0 otherwise.
cNatural logarithm.
+p<0.10; *p<0.05; **p<0.01; ***p<0.001.
©
2014
John
W
ile
y
&
Sons,
L
td.
Str
a
t.
Mgmt.
J.
,
36
:
1277
–
1296
(2015)
DOI:
though listing may be endogenous, it does not inval-idate our conclusion that Hypothesis 1 is supported.
Is BG affiliation endogenous?
As Khanna and Palepu (2000a) have noted, firms in India seldom choose whether to belong to a BG. However, to the extent a BG chooses them for unob-served reasons, the effects of BG affiliation may be spurious. To assess the extent to which this may influence our results, we re-estimated the models to test Hypotheses 1 and 2 using a subsample of firms that never changed their affiliation status—by including them with a time-invariant BG affilia-tion dummy (Belenzon and Berkovitz, 2008) in our analyses. This does not significantly attenu-ate the sample, which reduces to 60,343 instead of 68,530 observations. In this subsample, while BG affiliation may be correlated with other unobserved features of firms, since it does not change in our observation window, a fixed effects estimation effectively controls for them.
The equation used to test Hypotheses 1 and 2 now has the general form:
ROAi,t=𝛿M+𝜑M.BGaffiliatei+𝛽[Controlsi,t]
+vi+ui,t (2)
where all notation is identical to that in Equation 1 except thatvi=(𝛼i+𝜃.BGaffiliatei). Note that the
BGaffiliateivariable does not change over time for a firm in this subsample. Therefore, it is not possible to estimate 𝜃separately from 𝛼i in a fixed effects estimation—they will be estimated jointly as the firm fixed effectvi. However, this does not pose a problem as our theory makes predictions about𝜑 and not𝜃. This inconvenience seems worth bearing as the alternative, a random effects model, makes the strong assumption that vi is uncorrelated with the other variables in Equation 2. We do not report the results in the interest of space, but the results for both Hypotheses 1 and 2 in this subsample remain qualitatively identical to those in Table 3. We conclude that endogenous BG affiliation does not invalidate our results.
Is the performance effect of BG affiliation improving over time?
Our results, which show that BG affiliation effects strengthen with increasing capital market
efficiency, raise the possibility that these affili-ation effects may be generally improving with time, as many other reforms also progressed in India during the time period of our study. To capture the dynamic effects of time on a firm’s BG affiliation over the 16-year study period, we create a post-liberalization “time-clock” variable (Amburgey, Kelly, and Barnett, 1993; Baum, Korn, and Kotha, 1995). Significant economic reforms were first introduced in India in 1991, and they have gathered momentum since the mid-1990s. A number of reports have documented substantial improvements in the institutional environment coinciding with this period (Ahluwalia, 2002). For example, as per the World Economic Forum Global Competitiveness Survey, the indicator of regulatory quality in India showed a steady improvement of nearly 50 percent between 1996 and 2008 (Kaufmann, Kraay, and Mastruzzi, 2009). The time-clock variable assumes positive integer values from 1 to 16 to reflect the duration of devel-opment of the institutional environment during the 16-year period (1994–2009) for which we have the data.
We tested the BG affiliate×Time-clock interaction in the subsample of firms with
Mar-ketParticipation=0 as well as on a sample of
firms withMarketParticipation=1. For the sample
with MarketParticipation=0, the coefficient for
the BG dummy–Time-clock interaction term is positive and marginally statistically significant (𝛽=0.001, p<0.10) indicating that the BG effect is increasing in a significant manner over time. When we consider only the sample of firms with
MarketParticipation=1, the coefficient of the BG
dummy–Time-clock interaction term is larger, positive, and statistically significant (𝛽=0.003,
p<0.001). We used a Wald chi-square test to check the difference in coefficients and find that it is statistically significant (p<0.01). Thus, the per-formance effect of BG affiliation is not decreasing over time in our sample; in fact, it is increasing even as institutions develop, and this effect is larger for firms that actively participate in the capital markets.
DISCUSSION AND CONCLUSION
labor, and capital markets in emerging economies in which these institutions are poorly developed (Carney et al., 2011; Khanna and Palepu, 2000a). The central argument in this paper has been that this is not inconsistent with the idea that the inter-nal institutions within a BG and exterinter-nal institu-tions, such as a well-developed capital market, can play a complementary role in the governance of a firm—when both exist and interact.
We find robust support for our theory about the complementary effects of BG affiliation and capital market participation on firm performance. Consis-tent with the meta-analysis of past studies by Carney
et al. (2011), we find that in the Indian context
the main effect of BG affiliation is not significant. However, the interaction between BG affiliation and capital market participation in relatively efficient capital markets is positive and significant in explain-ing firm performance. Specifically, BG affiliation effects are larger for firms that are active in the capital markets than for those that are not, and the BG affiliation effect increases with capital market development more significantly for the former than for the latter. Finally, at least in India there is clear evidence that BG affiliation effects have not been declining over time, despite significant improve-ments in the economic environment (also see Siegel and Choudhury, 2012, and Figure 1 in Carneyet al., 2011). Had there been a substitution relationship between BG affiliation and external capital markets, the performance effects of BG affiliation should have declined with market participation (i.e., a neg-ative interaction between these two factors), and this should have been more so for firms that actively par-ticipated in capital markets as the markets became more efficient. Since we observe the opposite, our evidence points strongly to complementarity rather than substitution.
Our work makes several contributions to the study of business groups. Our primary theoretical contribution lies in conceptually underscoring the conditions under which one can expect to see an increase in BG affiliation effects. Specifically, cap-ital market participation in relatively efficient capi-tal markets gives rise to some of the BG affiliation costs decreasing while the benefits increase or at least remain the same, thereby resulting in a net pos-itive effect. An important part of our contribution is in explicating the various costs and benefits of BG affiliation identified in the prior literature into systemic and cross-subsidy categories. This catego-rization helps us to offer a better specified theory
about which among the costs and benefits of BG affiliation (1) decline, (2) do not change, and (3) increase with capital market scrutiny.
Our analysis also suggests that BGs, with their listed affiliates, constitute a unique multibusiness organizational structure in which governance is split between capital markets and the BG (Williamson, 1996). BG-affiliated firms that are listed and are actively traded represent an organizational form that mixes elements of control and monitoring internally by the BG through its controlling stake and exter-nally by the capital market. A traditional distinc-tion between markets and hierarchies has been that the former exert control on firms through the dis-cipline imposed by price whereas the latter do so through the administrative authority conferred by the law surrounding asset ownership and employ-ment (Coase, 1937). However, Williamson (1996) argued that hybrids are characterized by a mix of incentive intensity, administrative controls, and adaptation as compared to the polar opposites (mar-kets and hierarchies). We can envisage how this argument could be developed further to make pre-dictions about “discriminating alignment” (to use Williamson’s terminology—i.e., to examine under what conditions the BG structure is likely to out-perform both the holding company as well as the portfolio of listed independent firms). However, such an exercise, both theoretically and empirically, would be well beyond the scope of the current paper.