ANALISIS PENGARUH STRAIT TIME INDEX (STI), NIKKEI 225,
DOW JONES INDUSTRIAL AVERAGE (DJIA), DAN INFLASI
TERHADAP INDEKS HARGA SAHAM GABUNGAN (IHSG) DI BURSA
EFEK INDONESIA (BEI) PERIODE TAHUN 2011 – 2015
JURNAL ILMIAH
Oleh :
FARID ABDI FAISAL
1431600467
PROGRAM STUDI MAGISTER MANAJEMEN
PROGRAM PASCASARJANA
UNIVERSITAS BUDI LUHUR
JAKARTA
ABSTRACT
Farid Abdi Faisal
1431600467
ANALYSIS OF EFFECT OF TIME STRAIT INDEX (STI), NIKKEI 225, DOW JONES
INDUSTRIAL AVERAGE (DJIA), AND INFLATION ON STOCK PRICE INDEX (CSPI)
IN INDONESIA STOCK EXCHANGE (IDX) YEAR 2011-2015
This research was conducted in order to test the effect of the analysis of the influence of the
Straits Time Index (STI), the Nikkei 225, the Dow Jones Industrial Average (DJIA), and
Inflation against Composite Stock Price Index (CSPI) in Indonesia Stock Exchange (IDX) in
the period of 2011-2015 . This study employed multiple linear regression analysis, with a
total sample of 60 data. The tool being used was SPSS version 19.0. The results suggested
that Strait Time Index (STI), the Nikkei 225, the Dow Jones Industrial Average (DJIA), and
inflation partially affect the Composite Stock Price Index (CSPI). Indicated with significant
levels of STI variable t to obtain t
count(4.468)> t
table(2.01537), and has a sig. <0.05 is (0.000
<0.05), Variable N225 have t
countequal (3.238)> t table (2.01537), and has a sig. <0.05 is
(0.002 <0.05), Variable DJIA has t
countequal to (6.552)> t
table(2.01537), and has a sig. <0.05
is (0.000 <0.05, t Variable Inflation has amounted to (2.835)> t table (2.01537), and has a
sig. <.05 Namely (0.004 <0.05). While simultaneously the results obtained are all variables
together significantly influence the Composite Stock Price Index of F (72.160> F
table(2.58)
and the value of Sig. F 0,000 less than significant level α = 0.05.
INTRODUCTION
The capital market is one of today's economic instrument which has developed very rapidly. It is inseparable from the development of investment activity lately due to the ease of investing, deregulation rules, and the free flow of information.
In Indonesia, investors are interested in investing in the stock market can invest in the Indonesia Stock Exchange (BEI). One index that is often overlooked investor when investing in Indonesia Stock Exchange is the Composite Stock Price Index. It is due to this index lists of all shares listed on the Indonesia Stock Exchange.
For the Indonesian capital market, the year 2011 is the year to demonstrate to the global and domestic investors how high resilience (resistance) of the Indonesian capital market to the global crisis triggered by the economic conditions of European countries. JCI and the stock market capitalization of the Stock Exchange is still increasing. Composite Index edged up 2.84% to a level of 3808.772 on December 29, 2011 from the position of closing the end of 2010 amounted to 3703.512. Composite Stock Price Index is an index of shares on the Stock Exchange with the third best performance in 2011 after the stock market the Dow Jones and the Philippines. CSPI posted a rise of 3.19 percent in 2011, an investment of approximately 250 billion related to Indonesia ratings are in investment grade level, yangdapat encourage foreign funds into Indonesia, investment opportunities in the country is quite large in the infrastructure sector due to these factors, the condition it will lure investors to place
their funds in Indonesia
(www.antaranews.com/).
In 2011, the Singapore stock market both fell 17.1 percent. Cumulatively, the increase in stock indexes Singapore exchange since the end of December amounted to 28 percent, a tenth of stock index over the same period (http://economy.okezone.com/read/).
Stock indices in Indonesia, and Singapore compact decrease with a decrease in
East Asian stock indexes. Of the seven Southeast Asian stock market indices are monitored, the index recorded in the three stock exchanges rose and 5 other indexes weakened. Singapore STI index recorded the slump with a decline of 1.39% to a level of 3281.95
(http://market.bisnis.com/read/20150106). Japan's Nikkei .N225 fell 1 percent is likely to post its largest decline, Dow Jones has been eroded by 5.2 percent since the end. So it is with the S & P 500 is down 4.9 percent since 31Desember 2015, or the worst level in four trading days at the beginning of the year (beritasatu.com).
IDENTIFICATION OF PROBLEMS
Based on the background described above, there are some problems in this study as the difference in the results of each stock market index. Stock Price Index (CSPI) in the capital market is very influential on portfolio investments will be made by the investor. the researchers identified the problem as follows:
What is the effect on the STI index Composite Stock Price Index in Indonesia Stock Exchange period January 2011 - December 2015. 1. Does influential Nikkei 225 index
on the Jakarta Composite Index in Indonesia Stock Exchange period January 2011 - December 2015. 2. Is the Dow Jones Industrial
Average influential Against Composite Stock Price Index (CSPI) in Indonesia Stock Exchange (BEI) in the period January 2011 - December 2015. 3. Is inflation affect the Composite
Stock Price Index in Indonesia Stock Exchange period January 2011 - December 2015.
5. Does the Straits Times Index, Nikkei 225, DJIA, and inflation affect the Composite Stock Price Index in Indonesia Stock Exchange period January 2011 - December 2015.
Strait Times Index (STI) Singapore
Straits Times Index (abbreviated: STI; English: Straits Times Index) is an index of the stock market by capitalization on the Singapore Exchange. This index is used to record and monitor daily changes of the 30 largest companies in the Singapore stock market and as a leading indicator of market performance in Singapore. This index is calculated together with Singapore Press Holdings (SPH), Singapore Exchange (SGX) and FTSE Group (FTSE).
Indeks Nikkei 225 Jepang
The Nikkei 225 is a stock market index for the Tokyo Stock Exchange (Tokyo Stock Exchange - TSE). It has been calculated daily by the newspaper Nihon Keizai Shimbun (Nikkei) since 1950. This index is a weighted average price (in yen), and the components are reviewed once a year. Currently the Nikkei is the average index of Japanese equities the most widely cited, as well as the Dow Jones Industrial Average in the United States. Even in advance between 1975-1985, the Nikkei 225 was once known as the "Dow Jones Nikkei established by The Wall Street Journal editor and Dow Jones & Company founder Charles Dow. Dow makes this index as a way to measure the
performance of the industrial component American stock markets. Currently the DJIA is the oldest existing market indexes in the United States and is still running today.
Inflation
One of the modern events are very important and are always found in almost every country in the world is inflation. A short definition of inflation is the price trend - for rising prices in general and continuously (Mankiw, 2006: 145). This does not mean that the price - the price of a wide range of goods rose by the same percentage. Perhaps the increase can happen simultaneously, which is important there is a general price increase of goods continuously for a specific period. The increase happened once though in a large percentage, are not inflation.
EARLIER RESEARCH REVIEW
Research conducted Wijayanti (2013) with the title Influence of Several Variables Macro Economic and Capital Market Index World Movement Against Composite Stock Price Index (CSPI) in BEI with GDP variables, Exchange Rate, Interest Rates, Index DJIA and Nikkei 225. With the method Quantitative approach to Regression and the results obtained are the growth of Gross Domestic Products (GDP) have a positive effect but not significant.
on the test results of the hypothesis by using the F test showed that the variables SBI positive effect was not significant to JCI, World oil prices positive effect was not significant to JCI, World gold price significant positive effect on stock index, Nikkei 225 positive effect significantly to the Dow Jones stock index and significant positive effect on the JCI during the period 2007-2011.
Nurwulandari (2013) with the title Effect Balance Long Term And Short-Term Index DJIA, FTSE 100, DAX 30, CAC 40, and NIKKEI 225 Against Composite Stock Price Index (JCI) with the results obtained correction value models are valid based on the significance of the data variables kenam market index, so it can be concluded that a change in short-term balance between FTSE, DAX, CAC, and the Nikkei against JCI. DJIA index does not happen the influence of changes in the balance in the short term.
Analysis of Effects of Inflation, Interest Rates, And Value Exchange Dollar As (USD) Against Composite Stock Price Index in Indonesia Stock Exchange Period January 2010 -December 2012 by Nilawati
Latumairisa (2013) concluded that individually (partial) no effect between inflation , interest rate BI Rate and Exchange Rate As Dollar (USD) against the Composite Stock Price Index in Indonesia Stock Exchange period January 2010 -December 2012.
Johan Halim (2011) with the research entitled Analysis of Effect of movement Stock International Against Movement Bursa Indonesia variables: JSX, Dow Jones, FTSE, Nikkei 225, STI and HSI with Regression obtain the result of the influence which the Indonesian market affect other markets in regional same even European markets (FTSE) and American (Dow Jones) resulting improvement in the economic situation in Indonesia is considered of resilience to the global crisis.
FRAMEWORK
Research hypothesis
According to Jonathan Sarwono (2013: 10) testing the hypothesis can be based by using two things: a significance level or probability (α) and the level of trust or confidence level. is the level of significance is the probability make a mistake that mistake to reject the hypothesis.
H1:STI index effect on JCI H2: The Nikkei 225 stock index influence the H3:CSPI effect on the DJIA Index H4: Inflation effect on JCI
H5: Strait Times Index, Nikkei 225, the Dow Jones Industrial Average, and the inflation effect on Composite Stock Price Index.
Descriptive statistics
Processing of the data in this paper using the program Statistical Package for the Social Sciences (SPSS). The analytical method used is multiple regression analysis. The data used in this research is secondary data, the index STI, .N225, DJIA and the inflation of the Composite Stock Price Index in the Indonesia Stock Exchange.
Descriptive Statistics
Mean Std. Deviation N
LN_IHSG 8.3910 .11897 49
LN_STI 8.0422 .06596 49
LN_225 9.4455 .30281 49
LN_DJIA 9.5930 .15072 49
LN_INFLASI .9866 1.11383 49
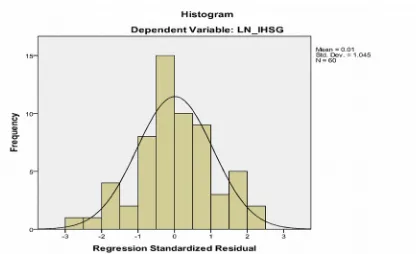
Gambar Histogram
Normality Test Data
Source: Sports Results SPSS Data
From the graph Histogram Figure 4.1 shows that the residuals in the regression model has to be normally distributed with a symmetrical
.
Test Heteroskidastity
Scatter plot
Figure 4.3 shows that the spread of the residuals tend to be irregular. Scatter plots and does not form a specific pattern, the data
points spread above and below zero (0), it can be concluded that there are no symptoms in the regression model heteroskedastisitas this.
Test Autocorrelation
According to Santoso (2012: 213), autocorrelation test is used to determine whether the linear regression model was no correlation between bullies error in period t with an error in period t-1 (previous).
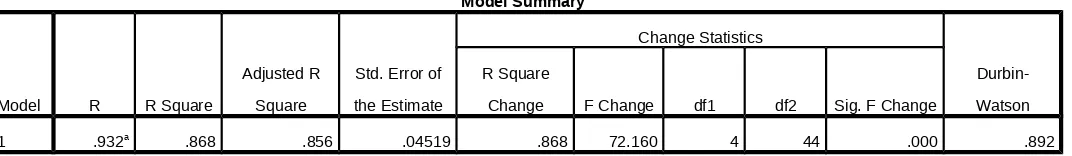
Tabel model Summary
Model Summaryb
Model R R Square
Adjusted R
Square
Std. Error of
the Estimate
Change Statistics
Durbin-Watson R Square
Change F Change df1 df2
Sig. F
Change
1 .932a .868 .856 .04519 .868 72.160 4 44 .000 .892
a. Predictors: (Constant), LN_INFLASI, LN_STI, LN_225, LN_DJIA
b. Dependent Variable: LN_IHSG
From the above data obtained from the regression DW value is 0.892, while the table D with significance and n = 0.05 and k = 4 DW values obtained between -2 to +2,
meaning no autocorrelation, then accept H0 and Ha refused, so it can be concluded that there is no autocorrelation in the data in the observations.
Uji Correlation coefficient
between the two variables. According to a strong or weak relationship between the measured distance (range) 0 to 1. Correlation unidirectional if the
correlation coefficient found to be positive, if the value of the coefficient negative correlation, the correlation is called not unidirectional.
Correlations
LN_IHSG LN_STI LN_225 LN_DJIA LN_INFLASI
Pearson Correlation LN_IHSG 1.000 .747 .779 .876 .198
LN_STI .747 1.000 .587 .627 .175
LN_225 .779 .587 1.000 .954 .238
LN_DJIA .876 .627 .954 1.000 .183
LN_INFLASI .198 .175 .238 .183 1.000
Sig. (1-tailed) LN_IHSG . .000 .000 .000 .086
LN_STI .000 . .000 .000 .115
LN_225 .000 .000 . .000 .050
LN_DJIA .000 .000 .000 . .104
LN_INFLASI .086 .115 .050 .104 .
N LN_IHSG 49 49 49 49 49
LN_STI 49 49 49 49 49
LN_225 49 49 49 49 49
LN_DJIA 49 49 49 49 49
LN_INFLASI 49 49 49 49 49
According to the table 4:11 can be seen the correlation of each independent variable on the dependent variable, namely:
a. Great relationship between the variables STI with Composite Stock Price Index (JCI) with the amount of data as the data 49 is 0.747, meaning that the strong relationship between both variables. The positive correlation indicates that the relationship between STI with JCI unidirectional, meaning that if the STI decreased the composite index decreased and vice versa. If seen from the figures of significance (Sig.) 0,000 less than 0.05 (0.000 <0.05), meaning that the variable occurs STI and JCI significant correlation.
b. Great relationship between the variables .N225 the Composite Stock
Price Index (JCI) with the amount of data as the data 49 is 0.779, which means that relations between the two variables is very strong. The positive correlation indicates that the relationship between JCI .N225 with unidirectional, meaning that if .N225 decreased the composite index decreased and vice versa .. If seen from the figures of significance (Sig.) Of 0.000 is less than 0.05 (0.000 <0.05), means the relationship between variables occurs .N225 JCI significant correlation.
JCI unidirectional, meaning that if the DJIA declined the composite index decreased and vice versa. If seen from the figures of significance (Sig.) Of 0.000 is less than 0.05 (0.000 <0.05), meaning that the relationship between the variables occur DJIA JCI significant correlation.
Inflation great relationship between the variables with JCI with the amount of data as the data 49 is 0.198, meaning that the relationship between the two variables is very weak. The positive correlation indicates that the relationship between inflation and JCI unidirectional, meaning that if inflation increases the composite index increased and vice versa. If seen from the figures of significance (Sig.) Of 0.085 greater than 0.05 (0.085> 0.05), meaning that the relationship between the variables inflation and JCI does not occur a significant correlation.
The coefficient of determination (R2)
The coefficient of determination used to determine the percentage
contribution of the influence of the independent variable (x) to the dependent variable (y). Adjusted R2 R2 is the adjusted value, this value is always smaller than R2 this figure could have a negative number, that's regression with more than two independent variables, use Adjusted R2 as the coefficient of determination (Priyanto, 2008: 81).
Model
Unstandardized
Coefficients
Standardized
Coefficients
t Sig.
Correlations
B Std. Error Beta Zero-order Partial Part
1(Constant)
-3.397
1.009 -3.369 .002
LN_DJIA .980 .150 1.242 6.652 .000 .747 .549 .239
LN_STI .569 .127 .315 4.468 .000 .779 -.456 -.186
LN_225 -.232 .072 -.591 -3.238 .002 .876 .708 .365
LN_INFLASI .023 .054 .157 2.835 .004 .198 .160 .059
Based on the table 4:12 (b) above can be seen that each independent variable has a value of
value of 92.77% (1,242 x 0,747 x 100%), STI obtain value KD amounted to 24,54% (0.315 x 0.779 x 100%), .N225 gain KD value of -51.77% (-0.591 x 0.876 x 100%), and Inflation obtain KD values of 2.51% (0.517 x
0.198 x 100%). Thus, in this study can be seen that the DJIA variable is the most dominant variable in influencing JCI compared to other variables.
The following shows the results of
the test R Square simultaneously:
Table 4.12 (b)
Table Model Summary
Model Summaryb
Model R R Square
Adjusted R
Square
Std. Error of
the Estimate
Change Statistics
Durbin-Watson R Square
Change F Change df1 df2 Sig. F Change
1 .932a .868 .856 .04519 .868 72.160 4 44 .000 .892
a. Predictors: (Constant), LN_INFLASI, LN_STI, LN_225, LN_DJIA
b. Dependent Variable: LN_IHSG
Based on the above table, the value of Adjusted R Square 0.856 or 85.6%. This coefficient shows that the Composite Stock Price Index is
affected by STI, .N225, DJIA and inflation while the remaining 14.4% (100% - 85.6%) caused by other variables not examined.
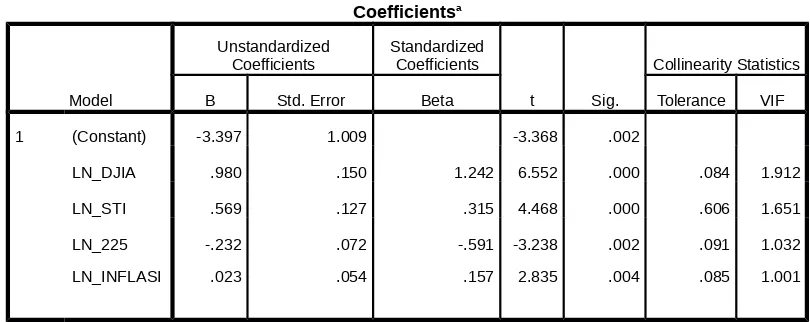
Multiple Linear Regression Test
Tabel 4.14
Tabel Coefficients
Coefficientsa
Model
Unstandardized Coefficients
Standardized Coefficients
t Sig.
Collinearity Statistics
B Std. Error Beta Tolerance VIF
1 (Constant) -3.397 1.009 -3.368 .002
LN_DJIA .980 .150 1.242 6.552 .000 .084 1.912
LN_STI .569 .127 .315 4.468 .000 .606 1.651
LN_225
LN_INFLASI
-.232
.023
.072
.054
-.591
.157 -3.238
2.835
.002
.004
.091
.085
1.032
1.001
a. Dependent Variable: LN_IHSG
From table 4.6 (2) can be obtained by multiple linear regression equation as follows:
Y = a + b1X1 + b2X2 + b3X3 + b4X4 + €
Testing Partial (t test)
If the column Sig. <Probability α = 0.05 and t> t table then Ho is rejected and Ha accepted. T table value is calculated α = 0.05,
df = N - (k + 1), where k = number of independent variables. So df = 49 - (4 + 1) = 44, so that the value t table = 2.01537.
Table 4.15
B Std. Error Beta Tolerance VIF
1 (Constant) -3.397 1.009 -3.368 .002
LN_DJIA .980 .150 1.242 6.552 .000 .084 1.912
LN_STI .569 .127 .315 4.468 .000 .606 1.651
LN_225
a. Dependent Variable: LN_IHSG
a. a. From t test results on variable STI has thitung (4.468)> t table (2.01537), and has a sig. <0.05 is (0.000 <0.05), which means a partial or individually a significant <0.05 is (0.002 <0.05), which means a partial or individually significant difference between .N225 with JCI.
e. H2: .N225 effect on JCI f.
g.
h. c. From t test results on variable t DJIA has amounted to (6.552)> t table (2.01537), and has a sig. <0.05 is (0.000 <0.05), which means a partial or individually a significant difference between the DJIA
with JCI.
H3: DJIA effect on JCI i.
j. d. From t test results on variable t Inflation has amounted to (2.835)> t table (2.01537), and has a sig. <0.05 is (0.004 <0.05), which means a partial or individually significant difference between inflation by JCI.
k. H4: Inflation effect on JCI
l.
m.
Simultaneous testing (test
F / ANOVA)
Test F is a simultaneous regressionvariable Composite Stock Price Index (CSPI).
n.
ooo. b. Dependent Variable: LN_IHSG ppp.
qqq.
rrr. Based on the test results simultaneously influence (Test-F) Model 2 in this study in Table 4.7.2 above, the known value of Fhitung 72.160 while Ftable value at =
Distribution F) then the resulting Ftabel 2.58, so the value of F (72.160> F table (2.58) and the value of Sig. F 0,000 less than significant level α = 0.05, thus the results of this study indicate that the H5 H0 rejected and accepted, meaning that simultaneous independent variable STI, .N225 , DJIA and inflation provide significant influence on the dependent variable is Analysis of the hypothesis shows that STI partially have a significant influence on JCI. This is supported by test results that show the Coefficients Statistic STI variable gain has thitung (4.468)> t table (2.01537), and has a sig. <0.05 is (0.000 <0.05), so that the results can be concluded that STI affect the JCI.
uuu.
b. Testing the Nikkei 225 Composite Stock Price Index Analysis of the hypothesis shows that .N225 partially have a significant influence on JCI. This is shown by the test results that show variable Coefficients Statistic .N225 gained t test results on variable t .N225 have amounted to (3.238)> t table (2.01537), and has a sig. <0.05 is (0.002 <0.05) so that the results can be concluded that the effect on the Nikkei 225 stock index.
c. DJIA Tests on Stock Price Index Gabunganv Analysis of the hypothesis shows that the DJIA is partially have a significant influence on JCI. This is supported by test results that show the Coefficients Statistic t test results on variable t DJIA has amounted to (6.552)> t table (2.01537), and has a sig. <0.05 is (0.000 <0.05) so that the results can be concluded that DJIAberpengaruh against JCI.
vvv.
d. Inflation Tests on Composite Stock Price Index Analysis of the hypothesis shows that inflation is partially have a significant influence on JCI. This is supported by test results that show the Coefficients Statistic t test results on variable t Inflation has amounted to (2.835)> t table (2.01537), and has a sig. <0.05 is (0.004 <0.05) so that the results can be concluded that the inflation effect on JCI.
www.
xxx. The results of this study indicate index Strait Times Index, Nikkei 225, the Dow Jones Industrial Average and Inflation jointly affect the Composite Stock Price Index. It is powered by ANOVA test known value Fhitung 72.160 while Ftable value at = 0.05 and DF1 = (k-1) where k = number of variables X and Y, then DF1 = 5-1 = 4, while DF2 = ( nk) where n = number of samples forming data, then DF2 = 49-4 = 45 (see table Distribution F) then the resulting Ftabel 2.58, so the value of F (72.160> F table (2.58) and the value of Sig. F for 0,000 less than the significant level α = 0.05, thus the results of this study indicate that the H5 H0 rejected and accepted, meaning that simultaneous independent variable STI, .N225, DJIA and inflation provide significant influence on the dependent variable is the Composite Stock Price Index ( JCI).
yyy.
zzz.Conclusion
aaaa. Based on the description in previous chapters, it can be concluded that:
bbbb.
1. The Strait Times Index is partially significant effect on the Composite Stock Price Index.
2. The Nikkei 225 is partially significant effect on the Composite Stock Price Index.
3. The Dow Jones Industrial Average is partially significant effect on the Composite Stock Price Index.
4. Inflation partially significant effect on Composite Stock Price Index.
Average and inflation affect the Composite Stock Price Index.
cccc. Appeal recommended to add either the objects of the study sample and study period, so as to have more observation data
and reflect the real situation.
2. Further studies should be done by incorporating other variables to know is there any other variables that affect the JCI, and how the relationship is going.
3. For the investors who will invest in the stock market analysis is required in advance by observing or add other factors that could affect the JCI apart from STI, .N225, DJIA and inflation.
ffff.
llll. Irianto Agus, (2009), Statistik
Konsep Dasar dan
Aplikasinya, Jakarta: Kencana Prenada Media Group
mmmm.
nnnn. Iskandar, Syamsu, (2013), Bank dan Lembaga Keuangan Lainnya, Jakarta : Inmedia
oooo.
pppp. Jogiyanto, 2008,
Teori Portofolio dan Analisis Investasi, Edisi Ketiga,
tttt. Kumorotomo, Wahyudi dan Agus Subando Margono, 1998, Sistem Informasi
Manajemen dalam
Organisasi-Organisasi
Public,Yogyakarta: Gadjah Mada University Press
uuuu.
vvvv. Mankiw Gregory, 2006, Pengantar Ekonomi
Makro, Edisi Ketiga,
Jakarta:Salemba Empat wwww.
xxxx. Mankiw, N, Gregory, 2007, Makroekonomi , Edisi Keenam, Jakarta: Erlangga, yyyy.
bbbbb. Nugroho, Agung, 2005, Strategi Jitu memilih Metode statistic Penelitian dengan SPSS, Jogyakarta : Andi
ccccc.
ddddd. Pramesti, Getut, 2011,
Aplikasi SPSS dalam
hhhhh. Priyatno,Duwi, 2008,
Mandiri Belajar SPSS, Yogyakarta, Mediakom iiiii.
jjjjj. Priyatno, Duwi, 2013,
Mandiri Belajar Analisis Data Dengan SPSS, Yogyakarta:
Mediakom kkkkk.
Manajemen Portofolio, Jakarta:Erlangga
mmmmm.
nnnnn. Santoso, Singgih, 2012, Analisis SPSS pada Statistik Parametrik, Jakarta: PT, Elex Media Komputindo ooooo.
ppppp. Sarwono, Jonathan, 2006, Metode Penelitian Kuantitatif dan Kualitatif, Yogyakarta: Graha Ilmu qqqqq.
rrrrr. Sarwono, Jonathan 2013, 12 Jurus Ampuh SPSS untuk Riset Skripsi , Jakarta: Elex Media Komputindo sssss.
ttttt. Suharyadi dan Purwanto, 2004, Metodologi Penelitian, Gramedia Pustaka Utama, Jakarta
uuuuu.
vvvvv. Sukirno, Sadono, 1994, Pengantar Ekonomi Cetakan Ketujuh, Jakarta: Erlangga
cccccc.
dddddd. Supranto, J, M,A,,APU, 2011, Pengukuran Tingkat Kepuasan Pelanggan Untuk Menaikkan Pangsa Pasar ( Cetakan Keempat), Jakarta : PT, Rineka Cipta
eeeeee.
ffffff. Tandelilin, Eduardus, 2008, Analisis Investasi dan
Manajemen Portofolio,
Yogyakarta: BPFE
gggggg.
hhhhhh. Tandelilin, Eduardus, 2010, Portofolio dan Investasi teori dan aplikasi, Edisi Pertama, Yogyakarta: KANISIUS
iiiiii.
jjjjjj. Trihendradi,
Cornelius, 2009, Step by Step SPSS 16 Analisis Data Global, Indeks Regional, Dan Harga Minyak Dunia Terhadap Produk Indeks Hangseng Pada Bursa Berjangka Jakarta”, Fakultas Ekonomi Universitas Esa Unggul Jakarta, Volume 4 Nomor 2, November 2013 nnnnnn.
oooooo. Aditya Novianto, (2012), “Analisis Pengaruh Nilai Tukar (Kurs) Dolar Amerika/Rupiah (Us$/Rp), Tingkat Suku Bunga Sbi, Inflasi, Dan Jumlah Uang Beredar (M2) Terhadap Indeks Harga Saham Gabungan (IHSG) Di Bursa Efek Indonesia (BEI) Periode 1999 – 2010”, Fakultas Ekonomi Industrial Average, BI Rate Dan Kurs Dollar Terhadap Indeks Harga Saham Gabungan (IHSG) : Studi Kasus Pada IHSG Bursa Efek Indonesia Tahun 2008-2013”, Fakultas
Ekonomi Dan Bisnis
Universitas Brawijaya. Vol. 9 No. 2 April 2014
ssssss. Nurwulandari, Andini, NIKKEI 225 Terhadap Indeks Harga Saham Gabungan (IHSG)”, Jurnal Ilmiah Akuntansi dan Bisnis, Vol. 8 No. 1 Januari 2013
tttttt.
uuuuuu. Budi Sutanto, (2013), “Analisis Pengaruh Ekonomi Makro, Indeks Dow Jones, Dan Indeks Nikkei 225 Terhadap Indeks Harga Saham Gabungan (IHSG) Di Bei Periode 2007-2011”, Jurnal
Ilmiah Mahasiswa
Universitas Surabaya, Vol. 2 No. 1 April 2013
vvvvvv.
wwwwww. Venska, Dewa Ayu Kartika and Suhadak, Siti Ragil Handayani, “Dow Jones Industrial Average, Nikkei 225, Hang Seng, And Strait Times) On Jakarta Composite Index At Indonesian Stock Exchange (Period Of 2010 – 2012) the variables are Global Stock Jakarta Composite Index Indonesian Stock Exchange”, Jurnal Administrasi Bisnis (JAB, | Vol. 9 No. 2 April 2014 xxxxxx.
yyyyyy. Marjohan, Masno, “Effect of Stock Price Index in Global Stock against Composite Stock Price Index (CSPI) Study on the Indonesia Stock Exchange”, IOSR Journal of Economics and Indonesia Terhadap Krisis Subprime Mortgage Di Amerika Serikat”, National
Conference on Management Research 2008, 979-442-242-8 Makassar, 27 November 2008
aaaaaaa.
bbbbbbb. Utama, I Wayan Agus Budi 2015, “Pengaruh Indeks Bursa Dunia Pada Indeks Harga Saham Gabungan Bursa Efek Indonesia, Fakultas Ekonomi dan Bisnis Universitas Udayana, Bali-Indonesia”, Jurnal Manajemen, Strategi Bisnis dan Kewirausahaan, Vol. 9, No. 1, Februari 2015
ccccccc.
ddddddd. Halim, Johan, (2011), “ Analisis Pengaruh
Pergerakan Bursa
Internasional Terhadap Pergerakan Bursa Indonesia dengan variabel : JSX, Dow Jones, FTSE, Nikkei 225, STI dan Indeks Hangseng”,
Journal of Applied Finance and Accountin, 3(2) 181-203 eeeeeee. Fernando, Nico,
2012, “Pengaruh Return Indeks Bursa Global Terhadap Return Indeks Harga Saham Gabungan Pada Bursa Efek Indonesia Periode Tahun 2009-2011”, Manajemen S-1, Vol. 1 (2013) No. 1
fffffff.
ggggggg. Tamara, Shevanda Febrilia, (2012), “Pengaruh Dow Jones Industrial Average, Deutscher Aktienindex, Stock Exchange Composite Index, dan Straits Times Index Terhadap Indeks Harga Saham Gabungan di Bursa Efek Indonesia (Periode 2010 – 2012)”, Jurnal Ilmiah Mahasiswa Feb, Vol 1, No 2 hhhhhhh.
iiiiiii. jjjjjjj. kkkkkkk.
Indeks KLSE, Indeks PSEI, Dan Indeks STI Terhadap Indeks Harga Saham Gabungan, dengan variabel atas Suku Bunga, SBI Kurs, Inflasi, Indeks KLSE, Indeks PSEI dan Indeks STI”,Volume 2, Issue 9, February 2016 mmmmmmm.
nnnnnnn. Suhadak dan Handayani , 2014, “The Role of Corporate Governance, Dividend Policy, and Capital Structure on Ownership Structure Toward the Firm Value”, European Journal of Business and Management ISSN 2222-1905 (Paper) ISSN 2222-2839 (Online) Vol.6, No.8, 2014
ooooooo.
ppppppp. Wijaya, Trisnadi, (2013), “Pengaruh Berbagai Faktor Internal Dan Eksternal Terhadap Pergerakan Indeks Harga Saham Gabungan (Ihsg) Di Bursa Efek Indonesia”, Jurnal EMBA 1309,Vol.3 No.3 Sept. 2015 qqqqqqq.
rrrrrrr. Wijayanti, Anis, (2013), “Pengaruh Beberapa Variabel Makro ekonomi Dan Indeks Pasar Modal Dunia Terhadap Pergerakan Indeks Harga Saham Gabungan (IHSG) Di BEI dengan variabel GDP, Nilai Tukar Rupiah, Suku Bunga, Indeks DJIA, dan Nikkei 225”, Jurnal Ilmiah Mahasiswa FEB, Vol 1, No 2
sssssss. ttttttt.
uuuuuuu. Website :
vvvvvvv. www,bps,go,id
wwwwwww. http://www,bp s,go,id
xxxxxxx. http://www,bi,go,id
yyyyyyy. http://www,cnnindone sia,com
zzzzzzz. http://www,bps,go,id aaaaaaaa. http://finance,yahoo,c
om/q/hp?s=GE
bbbbbbbb. Tempo, Rabu, 29
April 2015
cccccccc. http://www,cnnindone sia,com/ekonomi/2015121012 0939-78-97267/ihsg-kuat-di- akhir-tahun-bos-bei-jamin-bukan-window-dressing/
dddddddd. http://finance,detik,co m/read/2012/04/09/114259/18 87703/65/pengaruh-indeks-dow-jones-terhadap-ihsg eeeeeeee. www.antaranews.com
/).
ffffffff. (http://vibiznews.com ).
gggggggg. (http://www.monexne ws.com).
http://bisnis.liputan6.com/read /2154209).
hhhhhhhh. (http://market.bisnis.c om/read/20150106).
iiiiiiii. www.indonesia-investments.com).
kkkkkkkk. llllllll.
mmmmmmmm.
nnnnnnnn.
oooooooo.
pppppppp.
qqqqqqqq.
rrrrrrrr.