Jurnal Penelitian Kehutanan Wallacea
Akreditasi LIPI: 764/AU1/P2MI-LIPI/10/2016 Akreditasi KEMENRISTEKDIKTI: 36b/E/KPT/2016
www.jurnal.balithutmakassar.org
http://dx.doi.org/10.18330/jwallacea.2018.vol7iss2pp151-163 ©JPKW-2018. Open access under CC BY-NC-SA license.
SEVERAL PHYSICAL PROPERTIES OF
Eucalyptus pellita
F. Muell FROM DIFFERENT
PROVENANCES AND SAMPLING POSITION ON TREE
(Beberapa Sifat Fisik Eucalyptus pellita
F. Muell dari Provenan dan Posisi
Pengambilan Sampel pada Pohon yang Berbeda)
Karnita Yuniarti1 and Arif Nirsatmanto2
1Pusat Penelitian dan Pengembangan Hasil Hutan
Jl Gunung Batu 5 Po. Box. 182 Bogor Kode Pos 16610, Jawa Barat, Indonesia Telp. +62 2518633378, Faks. +62 2518633413
2Balai Besar Bioteknologi dan Pemuliaan Tanaman Hutan
Jl. Palagan Tentara Pelajar Km. 15, Purwobinangun, Pakem, Sleman, Kode Pos 55582, Yogyakarta, Indonesia Telp. +62 274895954, Faks. +62 274896080
Article Info ABSTRACT
Article History:
Received 05 February 2018; received in revised form 02 August 2018; accepted 02 August 2018. Available online since 31 August 2018
Eucalyptus pellita F. Muell is one of the species selected for the development of the plantation forest in Indonesia. In order to obtain a superior plant for the continuity of the plantation forest program, various tree breeding techniques are often applied, one of which is through best provenance selection. Conventional or advanced tree breeding program generally aims to obtain a fast-growing plant with good physical appearance. The program rarely gives attention to the properties/characteristics of timber produced. This aspect becomes the main background of this particular study which aims to investigate the effect of four provenances and also to examine the effect of sampling position on the trees on several physical properties of E. pellita. The result showed that the highest moisture content (97.34 + 15.67%) was found in the bottom part of trees from Indonesia provenance. While, the highest air-dry moisture content (15.15 + 0.20%) was observed in the top-part samples from Provenance North Kiriwo PNG. Samples from Provenance Serisa Village PNG have the highest density ranges, approximately 590 + 90 kg/m3 and 630 + 80 kg/m3 in the bottom-part samples and in the top-part
samples, respectively. The highest T/R ratio, approximately 1.91 + 0.26, was observed in the bottom-part samples from Provenance South Kiriwa, PNG. The T/R ratio values of all provenances were less than 2, indicating the lumber will be possibly stable during its uses or further processing. Further result showed provenance factor significantly affect initial moisture content and density. Sampling position on trees only affect affects the initial moisture content. Based on the results, the timber of E. pellita being examined can be further used for light-to-medium construction purpose.
Keywords: Moisture content Density
T/R ratio Eucalyptus pellita Provenance
Kata Kunci:
Kadar air Kerapatan Rasio T/R Eucalyptus pellita Provenan
ABSTRAK
Eucalyptus pellita F. Muell merupakan salah satu jenis tanaman terpilih untuk program pembangunan hutan tanaman di Indonesia. Untuk memperoleh bibit tanaman unggul yang dapat mendukung kelangsungan program hutan tanaman, aneka teknik program pemuliaan tanaman dapat dilakukan, salah satunya melalui melalui seleksi provenan unggul. Pada umumnya, program pemuliaan tanaman yang dilakukan secara konvensional maupun modern bertujuan untuk memperoleh bibit tanaman yang cepat tumbuh dan memiliki penampilan fisik yang bagus. Sifat atau karakteristik kayu yang dihasilkan biasanya jarang diperhatikan sebagai tujuan program tersebut. Aspek tersebut yang melatar belakangi penelitian ini yang bertujuan untuk mengetahui pengaruh dari perbedaan 4 kelompok provenan dan posisi sampel pada batang pohon terhadap beberapa sifat fisik E. pellita. Hasil yang diperoleh menunjukkan bahwa bagian pangkal pohon contoh dari Provenan Indonesia memiliki kadar air awal tertinggi (97,34 + 15,67%). Sampel dari bagian ujung pohon yang berasal dari provenan Kiriwa Utara PNG mengandung kadar air kering udara tertinggi (15,15 + 0,20%). Sampel dari Provenan Serisa Village PNG memiliki kerapatan tertinggi, 590 + 90 kg/m3 untuk bagian pangkal dan 630 + 80 kg/m3 untuk bagian ujung. Bagian pangkal pohon contoh asal Provenan Kiriwa Selatan PNG memiliki rasio T/R tertinggi yaitu 1,91 + 0,26. Nilai T/R yang kurang dari 2 untuk semua provenan mengindikasikan kayu akan stabil selama pemakaian atau pengolahan lanjutan. Hasil lebih lanjut menunjukkan provenan memiliki pengaruh nyata terhadap kadar air awal dan kerapatan kayu E. pellita. Faktor posisi sampel pada batang pohon hanya mempengaruhi nilai kadar air awal. Berdasarkan hasil penelitian ini, kayu E. pellita yang diperiksa dapat digunakan untuk keperluan konstruksi ringan hingga sedang.
Corresponding author. Tel.: +62 81236000221
152
I. INTRODUCTION
Eucalyptus pellita is naturally distributed in North Queensland, Papua New Guinea, and Irian Jaya (Bristow, 2008). This species is one of those selected for the establishment of plantation forest in Indonesia and across South East Asia (Lukmandaru et al., 2016; Setyaji et al., 2016; Hii et al., 2017). The reasons for selecting this species include its fast growth, short rotation, straight stem, high tolerance to various types of soil and location, and high resistance to pest and diseases (Nadalia, 2013; Lukmandaru et al., 2016; Sulichantini, 2016).
Besides to fulfill the need of pulp and paper industry, this hardwood species has been considered as well as potential raw material for construction purposes and veneer and/or plywood production in Malaysia (Hii et al., 2017). Hopewell
et al. (2008) reported that E. pellita will be ready as pulp and paper material at harvesting age of 8 years and 10 years up for other purposes. Due to its popularity in the market, Indonesia has also established the average selling price of sawn timber made of this species for export purpose is approximately US$ 300 per m3 (Direktur Jenderal
Perdagangan Luar Negeri, 2017).
To support the success of plantation forest program, sufficient quality seed is required. Conventional breeding or open pollination is no longer reliable to meet this need (Setyaji et al.,
2016). In order to obtain adequate quality seed to grow superior plants, an advanced breeding strategy should be adopted to replace the conventional one. Various advanced breeding strategies that can be applied include clonal test, plus tree selection, best provenance selection, tissue culture or genetic engineering (Nirsatmanto
et al., 2015; Haggman et al., 2016; Leksono, 2016). For E. pellita case, the breeding program has been initiated since the early 1990s by Center for Forest Biotechnology and Tree Improvement (CFBTI) in Yogyakarta collaborated with Japan International Cooperation Agency (JICA). The establishment of the 1st generation (F1) of E. pellita in several sites
used genetic material from the best provenances from Queensland, Papua New Guinea, and Indonesia. This phase resulted in the production of superior seed of E. pellita which was further released for commercial purpose on 11th October
2004 (Leksono, 2016). In 2003, the 2nd progeny
trial plots (F2) were developed in Wonogiri (Central Java Province) and Pelaihari (South Borneo Province) using the superior seed obtained from the F1 generation (Leksono, 2016; Lukmandaru et al., 2016).
The general target for implementing any breeding strategy is to obtain a fast-growing plant with a good physical appearance in a short time. The strategy rarely gives attention to the
properties/characteristics of the timber produced. On the other hand, information on the wood characteristics is often required especially when the wood is being used for furniture or building purpose. Quang et al. (2010) reported that progeny trial could significantly influence some physical and chemical properties of the wood such as density, cellulose and lignin contents. Nevertheless, no information has been found for the effect of progeny trials on the wood properties of E. pellita. Considering the discrepancy in the existing information, this study then aims to investigate any significant influence of different provenances on several physical properties of E. pellita such as initial moisture content, density, and tangential-radial (T/R) shrinkage ratio. Physical properties, in particular density, are often questioned by users who will further utilize the timber for construction purposes. T/R shrinkage ratio indicates the dimensional stability of a particular wood species during its use. Any wood with a value of T/R shrinkage ratio of less than 2 will usually have a stable dimension during its service. In addition, together with density, T/R shrinkage ratio can also affect the wood during its drying process (Basri et al., 2009; Cáceres et al.,
2017). Therefore, T/R shrinkage ratio is one of the parameters that can or should be considered during the selection of provenances for construction timber production (Cáceres et al.,
2017).
II. RESEARCH METHOD
A. Material and Equipment
The main material used for this research was 10-year old E. pellita from the research forest area in Wonogiri, Central Java; one of many research plantation areas owned by the Ministry of Environment and Forestry of Indonesia. The
Wonogiri’s research forest is currently managed by
the Center for Forest Biotechnology and Tree Improvement (CFBTI) in Yogyakarta. The E. pellita
collected consisted of 4 provenances (i.e. S. Kiriwo PNG; N. Kiriwo PNG; Serisa Village PNG; and Bupul-Muting Indonesia).
153
Other supporting materials used includedsealant, spray gun, aluminum foil, plastic film (clingwrap), plastic spatula, vape, binder clips bulldog, writing tools, notebooks, etc. The equipment used included sawing machine, small band-saw, oven, fridge, caliper, moisture meter, ruler, measuring tape, and scale.
B. Time and Place
The field trips to select the trees in the plantation area and the trees collection were executed from mid to late of October 2016. The whole experiment started from November 2016 to February 2017. All sawing and drying processes were carried out in the sawing and drying facilities of CFPRD.
C. Research Procedures
1. Time and the purposes of the activity The activity was carried out from mid-November 2016 to February 2017. The measurements of density, tangential-radial (T/R) shrinkage ratio, and initial moisture content (M) were carried out for all 4 provenances of E. pellita.
2. Sample preparation
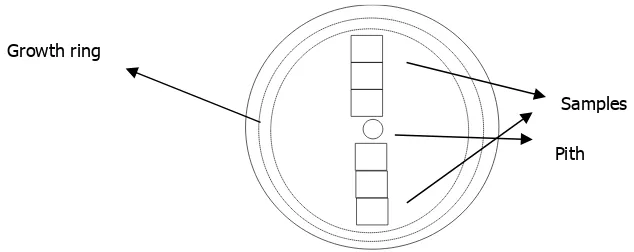
The bottom and the top logs of 2 trees from the 6 trees collected for each provenance of E. pellita were randomly selected, resulted in 4 logs for each group. The disks, measuring 50 mm in thickness, were sawn from the end-part of each log with the largest diameter for the bottom-logs or the smallest diameter for the top-logs (Figure 1). These disks were then cut following the specific pattern (Figure 2). The number of samples obtained from each disk could be different depending on the disk diameter. 3. Experiment method
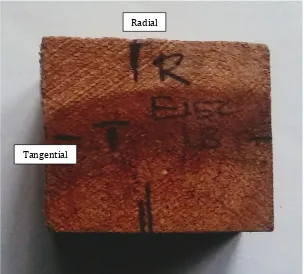
British Standard 373-1957 was used to examine the physical properties (BSI, 1957). A modification was applied to sample dimension due to the limitation in the log diameter and this practice has been previously used by another study (Basri, 2011). The dimension sample was 20 mm (width) x 20 mm (length) x 20 mm (thickness). Tangential and radial directions were marked for each sample (Figure 3).
Initial weight and dimension of each sample were measured. Samples were then placed at room Figure 1. The cutting pattern for 50-mm thick disk from the bottom part (A) and the top part (B) of the logs of E. pellita
Gambar 1. Pola pengambilan disket dengan ketebalan 50 mm dari bagian pangkal (A) dan ujung (B) dolok E. Pellita
Figure 2. Sampling process from the 50-mm thick disk for physical properties test Gambar 2. Pengambilan sampel dari disket dengan ketebalan 50 mm untuk uji sifat fisis
50 mm
Bottom Middle
Cutting direction
50 mm Top Middle
Cutting direction
Samples
Pith Growth ring
A
154
temperature (at a range of 20-22°C) and humidity (at a range of 70-88%). Weight and dimension change of each sample were recorded daily. When the samples reached air-dry condition, in 54-56 days averagely and indicated by constant weight or no weight change, the samples were dried in an oven at a temperature of 60°C. When the samples
reached constant weight under this condition (within 2 days averagely), the oven temperature was raised to 100°C. All samples were removed from the oven when their weight showed no change. The final weight and initial dimension of each sample were measured again.
4. Data collection and analysis
The data collected were the initial and final weight and dimension of the samples (post-oven drying condition at 100°C). The initial moisture content, the air-dry moisture content, density, and T/R ratio were calculated according to Formulas 1-4. The distribution of each physical property from bark to pith was further graphed separately.
Initial moisture content
= Green weight – oven dry weight = x 100% (1) Oven dry weight
Air-dry moisture
content = Green weight
– air-dry weight = x 100% (2) Air dry weight
Density = Oven dry weight (kg) = x 100% (3) Green volume (m3)
T/R ratio = Shrinkage in tangential direction (Ts) (4) Shrinkage in radial direction (Rs)
Tangential/radial
shrinkage = Initial dimension- oven dry dimension Initial dimension (5)
Two-way analysis of variance (ANOVA) was used to examine the effect of different provenances, sampling position, and their interaction on each physical property. The replications used were 2 or 3, indicating the number of trees used. The value for each tree was the average of all samples produced from the same disk. A post-hoc Tukey test was carried out when the ANOVA result showed a significant result.
III. RESULTS AND DISCUSSION
A. Initial Moisture Content
The green or initial moisture content in samples from the bottom parts of the trees for all provenances was higher than that observed in the top-part samples (Table 1). According to Yuniarti (2017b), higher moisture content found in the bottom parts of the trees is an acceptable fact as this part is very close to the ground. The presence of roots in the plant base, hidden underground, facilitates the transport of moisture and any other nutrients from the soil into the plant. Therefore, the bottom parts of the trees could uptake moisture from the ground easily and in large amount. Another species from this genus, 4 to 17-year old Eucalyptus regnans, has also shown the same trend for its tendency of green moisture content (Frederick et al., 1982).
Figure 3. Tangential and radial directions were marked for each sample Gambar 3. Penandaan
arah tangensial dan radial untuk setiap sampel
Tangential
155
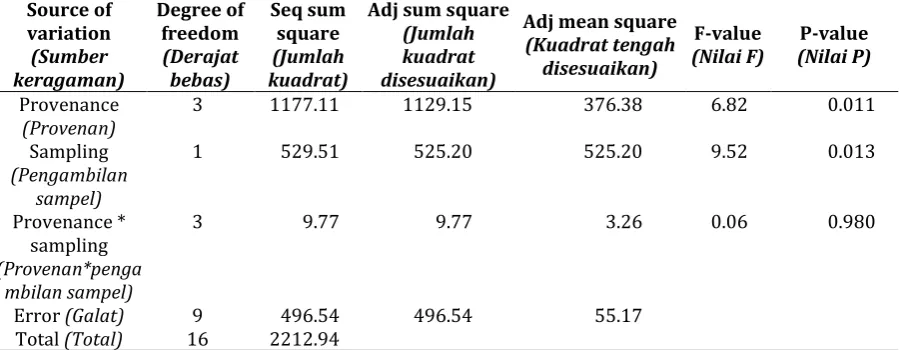
Table 1. Average and standard deviation values ofinitial moisture content of E. pellita from 4 provenances
Tabel 1. Nilai rata-rata dan standar deviasi kadar air awal E. pellita dari 4 provenan
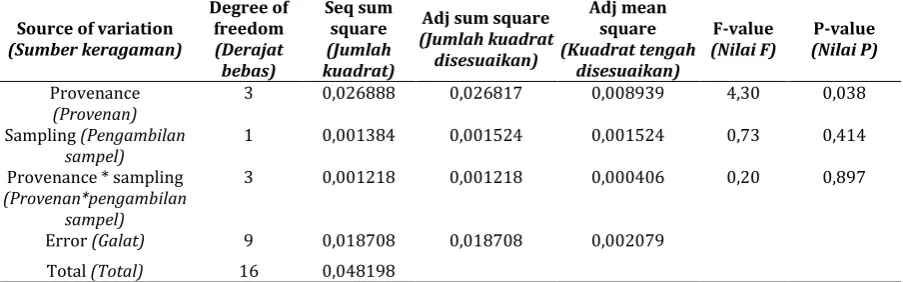
Provenance Indonesia) have the highest initial moisture content (Table 1), reached 97.34 + 15.67% and 89.21 + 19.24%, respectively. The lowest initial moisture content was observed in samples from Provenance 3, reached 76.00 + 20.00% for the bottom-part samples and 64.45 + 14.01% for the top-part samples. Further ANOVA test confirmed the significant effect of provenance and sampling position on trees on the initial moisture content values, but not their interaction (Table 2). Subsequent Tukey tests showed the samples from Bupul Muting Indonesia (Provenance 4) have the highest moisture content and significantly different from the others except from N. Kiriwo, differences in initial moisture content between provenances
Tabel 3. Hasil uji Tukey untuk menyelidiki perbedaan nilai kadar air awal antar provenan
Provenance
Keterangan: Huruf yang sama menunjukkan nilai tengah faktor tidak berbeda nyata.
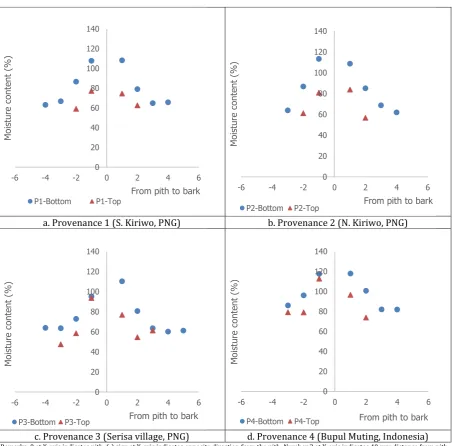
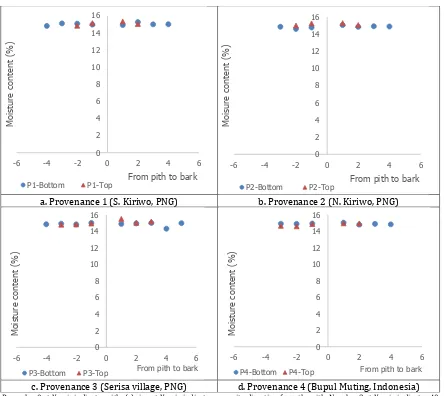
The initial moisture content tended to decrease toward the barks in all samples (Figure 4). Possibly because the outer part of the wood, which is close to the bark, consists of younger cells than the inner part, thus it is easier to evaporate moisture than the inner part. High initial moisture content should be taken into attention when the wood is further dried. The combination of high initial moisture content and the presence of deposits in wood cells, such as tyloses, minerals or others, could cause the development of drying defects, such as an initial check, deformation or even collapse, during the initial stage of drying. It is observed that the vessels of this species contain tyloses (Yuniarti, 2017a). Therefore, careful attention during its drying process will be required to prevent or minimize the development of serious defects.
Table 2. ANOVA test result to investigate the factors affecting the initial moisture content of Eucalyptus pellita
156
B. Air-Dry Moisture Content
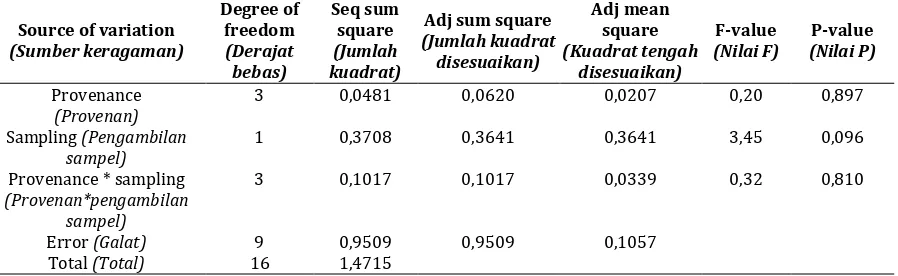
The bottom-part samples from all PNG provenances were found to have lower air-dry moisture content than their top-part counterparts (Table 4). The lowest air-dry moisture content was observed in the top-part samples from Provenance 4 (14.83 + 0.20%), whilst the highest one was observed in the top-part samples from Provenance 2 (15.15 + 0.20%). Nevertheless, the air-dry moisture content was actually not affected significantly by provenance, sample position on the tree, and the combination of both factors (Table 5).
Table 4. Average air-dry moisture content for E. pellita from 4 provenances
Tabel 4. Nilai rata-rata kadar air kering udara pada kayu E. pellita dari 4 provenan
Provenance
a. Provenance 1 (S. Kiriwo, PNG) b. Provenance 2 (N. Kiriwo, PNG)
c. Provenance 3 (Serisa village, PNG) d. Provenance 4 (Bupul Muting, Indonesia) Remarks: 0 at X-axis indicates pith; (-) sign at X-axis indicates opposite direction from the pith; Number 2 at X-axis indicates 40 mm distance from pith; 4 indicates 80 mm distance from pith; 6 indicates 100 mm distance from pith
Keterangan: 0 pada sumbu X mencirikan empulur; tanda (-) pada sumbu X mencirikan arah yang berlawanan dari empulur; Angka 2 pada sumbu X
mencirikan jarak 40 mm dari empulur; 4 mencirikan jarak 80 mm dari empulur; 6 mencirikan jarak 100 mmdari empulur
Figure 4. Initial moisture content distribution from pith to bark for samples from each provenance of E. pellita
Gambar 4. Distribusi kadar air awal dari empulur ke kulit kayu E. pellita dari setiap provenan
157
Table 5. ANOVA test result to investigate the factors affecting the air-dry moisture content of E. pellitaTabel 5. Hasil uji ANOVA untuk memeriksa faktor-faktor yang mempengaruhi kadar air kering udara E. pellita
a. Provenance 1 (S. Kiriwo, PNG) b. Provenance 2 (N. Kiriwo, PNG)
c. Provenance 3 (Serisa village, PNG) d. Provenance 4 (Bupul Muting, Indonesia) Remarks: 0 at X-axis indicates pith; (-) sign at X-axis indicates opposite direction from the pith; Number 2 at X-axis indicates 40 mm distance from pith; 4 indicates 80 mm distance from pith; 6 indicates 100 mm distance from pith
Keterangan: 0 pada sumbu X mencirikan empulur; tanda (-) pada sumbu X mencirikan arah yang berlawanan dari empulur; Angka 2 pada sumbu X mencirikan jarak 40 mm dari empulur; 4 mencirikan jarak 80 mm dari empulur; 6 mencirikan jarak 100 mm dari empulur.
Figure 5. Air-dry moisture content distribution from pith to bark in trees from each provenance of E. pellita
Gambar 5. Distribusi kadar air kering udara dari empulur ke kulit kayu E. pellita dari setiap provenan
158
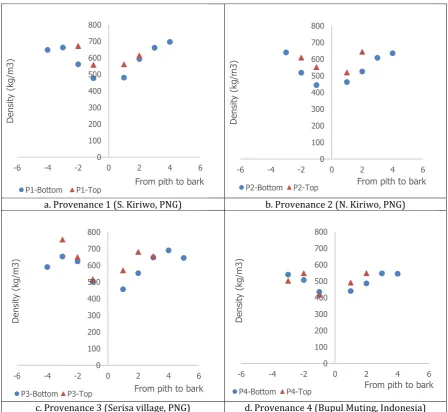
Both bottom- and top-part samples from all provenances generally showed the same trend (Figure 5). The moisture content at air-dry condition was found to be distributed evenly from the pith to bark. This result indicates that under a natural air-drying condition, the species is possibly permeable thus the liquid can flow easily from the inner part of the wood to its outer part. Further study is required to determine the exact value of the permeability of this species to confirm the assumption.
C. Density
The average density of the samples from both the top and bottom parts of the trees was not much different (Table 6). Between provenances, the
differences in density were also not that large. Samples from Provenance 4 (Bupul Muting, Indonesia) have the lowest density ranges, approximately 500 + 50 kg/m3 for the bottom-part
samples and 500 + 70kg/m3 for the top-part
samples. On the other hand, samples from Provenance 3 have the highest density ranges, approximately 590 + 90 kg/m3 for the bottom-part
samples and 630 + 80 kg/m3 for the top-part
samples. Provenance 3 was found to have thicker cell wall than Provenance 2 or 4 (approximately 4.04 m), but still lower than that observed in Provenance 1 (4.23 m) (Yuniarti, 2017a). Therefore, the densest structure of Provenance 3 is possibly contributed by other components which will need further study.
a. Provenance 1 (S. Kiriwo, PNG) b. Provenance 2 (N. Kiriwo, PNG)
c. Provenance 3 (Serisa village, PNG) d. Provenance 4 (Bupul Muting, Indonesia) Remarks: 0 at X-axis indicates pith; (-) sign at X-axis indicates opposite direction from the pith; Number 2 at X-axis indicates 40 mm distance from pith; 4 indicates 80 mm distance from pith; 6 indicates 100 mm distance from pith.
Keterangan: 0 pada sumbu X mencirikan empulur; tanda (-) pada sumbu X mencirikan arah yang berlawanan dari empulur; Angka 2 pada sumbu X mencirikan jarak 40 mm dari empulur; 4 mencirikan jarak 80 mm dari empulur; 6 mencirikan jarak 100 mm dari empulur.
Figure 6. Density distribution from pith to bark in trees from each provenance of E. pellita
Gambar 6. Distribusi kerapatan dari empulur ke kulit kayu E. pellita dari setiap provenan
159
Table 6. The average and standard deviationvalues of density of E. pellita from 4 provenances Tabel 6. Nilai rata-rata dan standar deviasi kerapatan E. pellita dari 4 provenan
Provenance Nevertheless, their values are still lower than those
of E. pellita from Australia, which was
approximately 748 kg/m3 (McGavin et al.,2015).
The difference is possibly due to the age difference between the samples used, where the trees sampled in Australia was 1 year older than that sampled in Indonesia. Further, the density values were significantly affected by the provenance factor, but not by the sampling position on trees or interaction between the 2 main factors (Table 7). The mean density value of the Bupul Muting provenance was found significantly lower than that of the Serisa Village (Table 8).
Table 8. Tukey test results to investigate the differences in density between provenances Tabel 8. Hasil uji Tukey untuk menyelidiki perbedaan kerapatan antar provenan
Provenance
Keterangan: Huruf yang sama menunjukkan nilai tengah faktor tidak berbeda nyata.
The density values tended to increase toward the bark for all provenances (Figure 6). Possible factors causing this trend are not clear yet. The presence of additional extractives in the cell lumen could be one of the factors. However, it will need further and more detail study to confirm the decreasing density from pith to the middle part and then increasing again toward the bark; and Group 3 for those with decreasing density toward the
D. T/R Shrinkage Ratio
The T/R shrinkage ratio of the samples from the top parts of the trees was averagely lower than
Table 7. ANOVA test result to investigate the factors affecting the density of Eucalyptus pellita
Tabel 7. Hasil uji ANOVA untuk memeriksa faktor-faktor yang mempengaruhi kerapatan Eucalyptus pellita
160
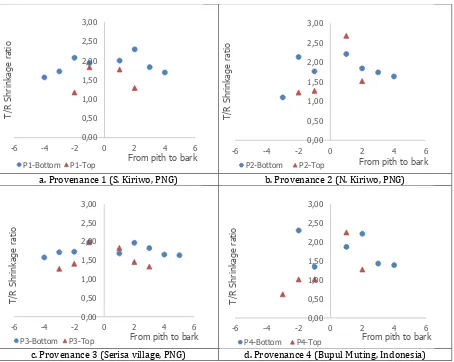
that in the bottom-part samples (Table 9). However, between provenances, the difference in T/R shrinkage ratio was not that large. The highest T/R ratio, approximately 1.91 + 0.26, was found in the bottom-part samples from Provenance 1 (South Kiriwa, PNG). The lowest T/R ratio, approximately 1.31 + 0.63, was observed for the top-part samples from Provenance 4 (Indonesia origin). Nevertheless, the values of T/R shrinkage ratio were not significantly affected by provenance, sampling position on trees, and interaction between both main factors (Table 10).
Table 9.Average and standard deviation values of tangential/radial shrinkage ratio (T/R ratio) of E. pellita from 4 provenances
Tabel 9. Nilai rata-rata dan standar deviasi rasio penyusutan tangensial/radial kayu E. pellita dari 4 provenan
The trend of T/R ratio values for, in particular, the 3 provenances (PNG), were generally decreasing toward the barks, with values are less than or close to 2 (Figure 7). This trend, in general, starts from 400-mm distance from the pith. This finding indicates the samples dimension obtained, starting from that position, will be quite stable during the uses. As for samples from Provenance 4 (Bupul Muting, Indonesia), only the top-part samples show a decreasing trend toward the bark
and the bottom-part samples did not show the same trend. Possible factors causing this irregular pattern should be further studied. It is possible that the values of tangential or radial shrinkage obtained from each sample contribute to this irregular pattern. Nevertheless, this assumption needs further study to be confirmed.
The T/R shrinkage ratio values of samples from the top part of the trees from all provenances generally were less or close to 2, and lower than those for samples from bottom-part of the trees (Figure 7). This particular result indicates the dimension of samples from top-part of the trees will be possibly more stable during uses or drying process.
The tendency of top – part samples to have lower T/R values than their bottom – part samples is actually unforeseen previously. However, to recall, as shown in Figure 4 and Figure 6 proviously, the top –part samples of all provenancos generally have lower moisture content and higher density than or similar to their bottom – part counterpart samples. Therefore, it can be understood why top-part samples have lower T/R shrinkage ratio than the bottom – part samples.
The T/R value, as well as density, is rarely being taken into formal, consideration when the suitability of a specific wood species for any construction purpose is being evaluated. Whilst the requirement for moisture content is often set up to 14% in any national standards related to the use of sawn timber, the same treatment is not given for density or T/R values. Considering the density of wood will affect its strength and T/R value will govern its dimensional stability, these 2 parameters should be given sufficient attention in any standards. As a matter of fact, these 2 parameters could act as a quick, initial estimator in deciding which wood species will be proper for heavy or light construction.
Table 10. ANOVA test result to investigate the factors affecting the T/R shrinkage ratio of E. pellita.
161
IV. CONCLUSION AND RECOMMENDATIONA. Conclusion
This study showed that the bottom-part of E. pellita samples from all provenances have higher Indonesia) have the highest initial moisture content ranges(97 – 34 ± 15,67% for the bottom – part samples and 89.21 ± 19.24% for the top – part sample ), whilst the lowest range is observed in provenance 3 sample. The highest air – dry moisture content range ( 15.15 ± 0.20) is observed in the top – part samples of provenance 4.
Samples from provenance 3 ( Village, PNG) have the highest density ranges (approximatply 590 ± 90 kg /m3 for the bottom – part samples 630
± 80 kg /m3 for the top – part samples) and the lowes density range is found for provenance 4 samples. The highest T/R shrinkage ratio (1.91 ± 0.26) is obseved for the bottom – part samples of provenance1 ( S.Kiriwo, PNG) and the lowest one is in the top – part samples from provenance 4.
Provenance factor significantly affects the initial moisture content and density of E. pellita. The sampling position on the tree only affects the initial moisture content but not other response variables.
B. Recommendation
Samples from all provenances have the average T/R ratio of less than 2, indicating it will be resistant to deformation or any dimensional change during the drying process. As a further consequence, those provenances are also potential for lumber production. Their density value ranges make E. pellita from the 4 provenances grouped a. Provenance 1 (S. Kiriwo, PNG) b. Provenance 2 (N. Kiriwo, PNG)
c. Provenance 3 (Serisa village, PNG) d. Provenance 4 (Bupul Muting, Indonesia) Remarks: 0 at X-axis indicates pith; (-) sign at X-axis indicates opposite direction from the pith; Number 2 at X-axis indicates 40 mm distance from pith; 4 indicates 80 mm distance from pith; 6 indicates 100 mm distance from pith.
Keterangan: 0 pada sumbu X mencirikan empulur; tanda (-) pada sumbu X mencirikan arah yang berlawanan dari empulur; Angka 2 pada sumbu X mencirikan jarak 40 mm dari empulur; 4 mencirikan jarak 80 mm dari empulur; 6 mencirikan jarak 100 mm dari empulur
Figure 7. T/R ratio distribution from pith to bark in trees from each provenance of E. pellita
Gambar 7. Distribusi rasio T/R dari empulur ke kulit kayu E. pellita dari setiap provenan
162
into strength class II-III and possibly suitable for light-to-medium-strength construction purpose. Further study to obtain information on proper drying schedule and process/technique for this species will be required in order to support its use for construction purposes.
ACKNOWLEDGMENT
The authors would like to express their gratitude to ACIAR for the grant provided to conduct this research; the team from CFBTI for assisting in selecting the trees samples in the field; Mr. Rachmat, Mr. Aftoni, Mr. Darta and Mr. sifat densifikasinya untuk bahan mebel (Thesis). Yogyakarta: Universitas Gadjah Mada.
Basri, E, Saefudin, Rulliyati, S, & Yuniarti, K. (2009). Drying conditions for 11 potential ramin substitutes. Journal of Tropical Forest Science
21(4): 328-335. doi:
https://www.frim.gov.my/v1/JTFSOnline/jtfs/V2 1n4/328-335.pdf.
Bristow, M. (2008). Growth of Eucalyptus pellita in mixed species and monoculture plantations (Thesis). Lismore, New South Wales: Southern Cross University.
BSI. (1957). British Standard 373-157: Methods of Testing Small Clear Specimens of Timber. London. Cáceres, CB, Hernández, RE, & Fortin, Y. (2017).
Shrinkage variation in Japanese larch (Larix kaempferi, [Lamb.]Carr.) progenies/provenances trials in Eastern Canada. Wood Material Science &
Engineering: 1-7. doi:
10.1080/17480272.2017.1327460.
Direktur Jenderal Perdagangan Luar Negeri. (2017). Peraturan Kementerian Perdagangan Republik Indonesia 59/M-DAG/PER/8/2017: Penetapan harga patokan eskpor atas produk pertanian dan kehutanan yang dikenakan bea keluar.Jakarta. Frederick, DJ, Madgwick, HAI, & Oliver, GR. (1982). Wood
basic density and moisture content of young
Eucalyptus regnans grown in New Zealand. New Zealand Journal of Forestry Science 12(3): 494-500. doi: http://citeseerx.ist.psu.edu /viewdoc /download?doi=10.1.1.705.7772&rep=rep1&type =pdf.
Haggman, H., Sutela, S, & Fladung, M. (2016). Genetic engineering contribution to forest tree breeding efforts. In: Biosafety of Forest Transgenic Trees. Netherland: Springer.
Hii, SY, Ha, KS, Ngui, ML, Ak Penguang, S, Duju, A, Teng, XY, & Meder, R. (2017). Assessment of plantation-grown Eucalyptus pellita in Borneo, Malaysia for solid wood utilisation. Australian Forestry 80(1): 26-33. doi: 10.1080/00049158.2016.1272526.
Hopewell, GP, Atyeo, WJ, & McGavin, RL. (2008). Evaluation of wood characteristics of tropical post-mid rotation plantation Eucalyptus cloeziana and E. pellita : part (d) veneer and plywood potential. Research Report. Melbourne, Australia: Forest and Wood Products Australia (Unpublished).
Knapic, S, Louzada, JL, Leal, S, & Pereira, H. (2008). Within-tree and between-tree variation of wood density components in cork oak trees in two sites in Portugal. Forestry: An International Journal of Forest Research 81(4): 465-473. doi: 10.1093/forestry/cpn012.
Leksono, B. (2016). Seleksi Berulang pada Spesies Tanaman Hutan Tropis untuk Kemandirian Benih Unggul. Bogor: Badan Penelitian, Pengembangan dan Inovasi.
Lukmandaru, G, Zumaini, UF, Soeprijadi, D, Nugroho, WD, & Susanto, M. (2016). Chemical properties and fiber dimensions of Eucalyptus pellita from the 2nd generation of progeny tests in Pelaihari, South Borneo, Indonesia. Journal of Korean Wood Science
Technology 44(4): 571-588. doi: Plantation Hardwoods. Bio Resources, 10(4), 6395
– 6416. doi: HTTP:
//ojs.enr.ncsu.edu/index,PhP/BioRes/article/vie w/BioRes_10-4_6394_McGavin_Stiffness_Density_ Analysis_Rotani_Venerr/4272.
Nadalia, D. (2013). Model keterkaitan produksi Eucalyptus pellita dengan karakteristik lahan sebagai dasar penyusunan kriteria kesesuaian lahan
(Thesis). Bogor: Institut Pertanian Bogor.
Nirsatmanto, A, Setyaji, T, Sunarti, S, & Kartikaningtyas, D. (2015). Genetic gain and projected increase in stand volume from two cycles breeding program of
Acacia mangium. Indonesian Journal of Forestry Research 2(2): 71-79. doi: http://ejournal.forda-mof.org/ejournal litbang / index.php /IJFR /article /view /1521 /1357.
Panshin, AJ, & De Zeeuw, CJ. (1980). Textbook of Wood Technology. New York: McGraw-Hill Book Company.
Quang, TH, Kien, ND, von Arnold, S, Jansson, G, Thinh, HH, & Clapham, D. (2010). Relationship of wood composition to growth traits of selected open-pollinated families of Eucalyptus urophylla from a progeny trial in Vietnam. New Forests 39(3): 301-312. doi: 10.1007/s11056-009-9172-5.
163
Sulichantini, ED. (2016). Pertumbuhan tanamanEucalyptus pellita F. Muell di lapangan dengan menggunakan bibit hasil perbanyakan dengan metode kultur jaringan, stek pucuk dan biji. Zira'ah 41(2): 269-275. doi: https://ojs.uniska-bjm.ac.id/index.php/ziraah/article/view/430. Yuniarti, K. (2017a). The mechanosorptive behaviour of
wood during intermittent drying. Final report: ACIAR project no C2015/250. Research Report.
Bogor: Forest Products Research and Development Center. (Unpublished).
Yuniarti, K. (2017b). Pengaruh pohon induk dan posisi sampel pada batang pohon terhadap beberapa sifat fisis mangium (Acacia mangium Willd) usia 4 tahun