Alamat Korespondensi: Dedi Mulyono, Faculty of Economics and Management Bogor Agricultural University, Jurnal Aplikasi Manajemen ( JAM) Vol 14 No 4, 20 16 Terindek s dalam Google Scholar
JAM
14, 4
Diterima, September 2016 Direvisi, September 20 16 Disetujui, Oktober 20 16
The Influence of Social Media in Brand Awareness, Word
of Mouth, Intention and Donation Decisionat Rumah Zakat
Dedi Mulyono Muhammad Syamsun
Mukhamad Najib
Management Department, Faculty of Economics and Management Bogor Agricultural University
Abstract: This study was conducted for examining the influence of social media in brand awareness, word of mouth, and intention to donate and decision making to give donation at Rumah Zakat, Indonesia. Social media as an exogenous variable. Endogenous variables consist of brand awareness, word of mouth (WOM), willingness to donate, and decision to give donation. This study uses primary data that was collected from 156 respondents which active on social media. The analysis method applies the estimation model of Structural Equation Modeling (SEM) that operated by SmartPLS program version 2.0. The result re-vealed that social media has significant influence to the word of mouth and brand awareness of Rumah Zakat. Brand awareness of Rumah Zakat significantly gives effect in marketing of word of mouth and willingness to donate. The establishment of word of mouth’s marketing significantly effect to willingness to donate. Willingness to donate significantly influences the decision of giving donation. Meanwhile, social media indirectly influence in willingness to donate to Rumah Zakat.
Keywords: social media, brand awareness, decision in donation, rumah zakat
The development of Internet in Indonesia has increased sig-nificantly. Ministry of Commu-nication and Information (2014) states that internet users in Indonesia in 2014 had reached 82 million people and 75 million of them are active users of social media. Based on a survey by WAS (2015) aworld social marketing agency, Indonesia is a country that has the most active social media users in Asia. Indonesia has 79.7% of active users on social media, which beats Philippines 78%, Malaysia
According to Solis and Brian (2007), social media has made a new culture in the process of dissemi-nation of information. This attracts many companies and nonprofit organizations to use social media as a marketing communication strategy to build brand awareness in the consumers’mind. Aside from being able to build brand awareness, one of the benefits of social media is the formation of talks that spreads rapidly through word of mouth. High connectivity among the users of social media makes information easily spread into the issue, rumors, or trendsetter quickly. Positive or negative rating of a brand that is discussed in social media will very quickly spread and eventually will bring up the desire to buy or not to buy a product (intention to buy orintention not to buy).
the influence of social media on donation toRumah Zakat non-profit institution, which is engaged in social and humanitarian.
Rumah Zakat is a nonprofit organization that collectssocial donations from the people of Indonesia to be donated to some humanitarian programs. The research results of IPB and BAZNAS in 2011 states that the zakat potential in Indonesia reached 217 billion rupiahs, while during2011 zakat collected was only 1.8 billionrupiahs (Ayuniyyah 2011). In the same year, Rumah Zakat collected Zakat, Infak, Sadaqah (ZIS) and other humanitarian donation of 146 million rupiahs. From these figures, it can be concluded that there is still a very large gap betweenthe value of zakat collection performance with a potential value of zakat in Indonesia. Thus, the educational measures that is more appropriate in improving the collection of zakat is necessary, one of them is through social media. Thus, the deeper study in order to determine the extent of the influence of social media on the effectiveness of zakat collection is also necessary, especially at Rumah Zakat.
Therefore, this study aims to: (1) determine the effect of social media on brand awareness at Rumah Zakat, (2) the effect of social media on the formation of word of mouth, (3) the effect of word of mouth and brand awareness on the public’swillingness to givehumanitariandonation through Rumah Zakat, and (4) determine the impact of willingness to donate that is formed onthe decision to give humanitarian donation to Rumah Zakat.
RESEARCH METHOD
Framework
The higher zakat potential in Indonesia becomes a major opportunity for zakat collector institutions, including Rumah Zakat, to optimize the collection of zakat from public. The greater the Zakat funds collected, the greater the benefits that can be provided by the agency for social and humanitarian activities. To collect the funds that are in the large niche, educational strategy and effectivelymarketing of institute program are required. Currently, one of the strategies which is effective and able to spread rapidly is social media. Social media continues to grow into
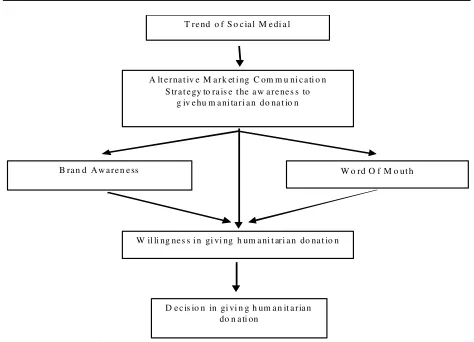
one of the alternative marketing communication strategy undertaken by Rumah Zakat in addition to other forms of promotion that has been done so far (advertising on television, newspapers, magazines, brochures, and others). Marketing in social media is expected to improve brand awareness and the establishment of word of mouth, which in turn will increase the interest of donors to give humanitarian donation. This study is expected to analyze the extent of the influence of social media as a marketing communications strategy of Rumah Zakat in shaping brand awareness, word of mouth, willingness to donate, and the decision to make donations to the Rumah Zakat. The framework of this study is fully presented in Figure 1.
Variables of Research
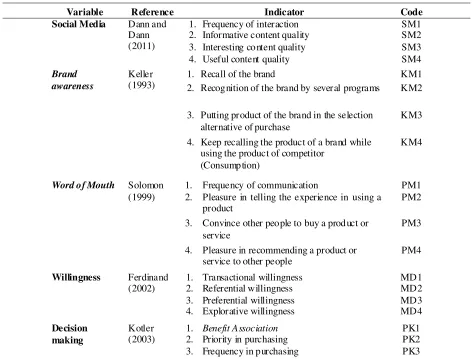
In this study, there are five latent variables used, namely social media (SM), brand awareness (KM), word of mouth (PM), willingness to give donation (MD), and the decision to donate (PK). Social media variable is an exogenous variable, whilethe variables ofbrand awareness, word of mouth, willingness to give donation and donation decisions are endogenous variables. Each latent variable is explained by several indicators. Latent variables and research indicators are presented in Table 1.
Hypoteses of Research
In this research, the hypotheses which are developed are as follow:
H1 : Social media influences significantly onbrand awareness
H2 : Social media influences significantly on word of mouth
H3 : Social media influences significantly on will-ingness in donation
H4 : Brand awarenessinfluences significantly on word of mouth
H5 : Brand awareness influences significantly on willingness in donation
H6 : Word of mouthinfluences significantly on will-ingness in donation
Population and Techniqueof Sampling
The population in a study is a group of individuals or objects which are common traits. Arikunto (2010) explains that the population is the entire subjects of research. Meanwhile, according Sugiyono (2010) population is generalization region which consists of objects or subjects that have certain qualities and characteristics defined by the researchers to learn and then to draw the conclusion.
Sample is a bunch of certain parts or portions which istaken from the population (Sugiyono, 2010). While the process which involves taking some groups of the population and the observation in the overall population is called or sampling. (Arikunto, 2010). The sampling method used in this research is non probability sampling. This study did not use probability sampling because there is no sampling frame which is complete. The type of sampling is purposive sampling, the sampling technique with certain
particular considerations, where sample is selected with conditions that are viewed to have essential features that are relevant to the research (Soeratno and Arsyad L, 1999).
In this study, the population used is social media users who have at least one active account of facebook, twitter and instagram, know the offer of Zakat House in facebook, twitter and instagram, and have become donors in Rumah Zakat. While the number of samples used was as many as 156 respon-dents. The data collectionin this study was conducted by distributing research questionnaires via online through Google form application.
Procedure of Data Analysis
The data which have been collected further is processed in order to have meaning to solve the research problems. The data processing was done descriptively and quantitatively. Descriptive analysis Figure 1. Framework of the Research
T r e nd o f S o c ia l M e di a l
A lt e r na t iv e M a r k et i ng C om m u ni c a ti o n S tr a t e gy to ra is e t he a w a r e ne s s to
g iv e hu m a ni ta r i a n do na t io n
W il li ng ne s s i n gi vi ng h um a ni t ar i a n do na t io n
B ra n d A w a r e n e ss W o rd O f M o ut h
respondents including gender, age, last education, occupation, and monthly income. Descriptive analysis is done by making a simple frequency tabulation based on respondents’ answers.
For the respondents’ answer related to percep-tion, the process was done by using a Likert scale. Likert scale was used to measure the observable variables on the research questionnaire. Likert scale used was divided into five scales. The higher the scale obtained, themore positive theratingof an object. Conversely, the lower scale of an object, the more negative the rating. This can be seen in Table 2
Analysis Method
Data processing was done descriptively and quantitatively. Descriptive analysis was used to describe the characteristics of the respondents
including gender, age, last education, occupation, and monthly income. While quantitative analysis used Structural Equation Modelling (SEM) with the help of the SmartPLS 2.0program.
Wijanto (2008) says that the equation modeling of Structural Equation Modeling (SEM) is a statistical technique to test and estimate the causal relationships by using a combination of statistical data and quali-tative causal assumptions. That equation describes all relationships between variables that build the model Table 1. Variableand Indicator of Research
Variable Reference Indicator Code
Social Media Dann and Dann (2011)
1. Frequency of interaction SM1
2. Informative content quality SM2 3. Interesting co ntent quality SM3
4. Useful content quality SM4
Brand awareness
Keller (1993)
1. Recall of the brand KM1
2. Recognition of the brand by several programs KM2
3. Putting product of the brand in the selection alternative of purchase
KM3
4. Keep recalling the product of a brand while using the product of competitor
(Consump tion)
KM4
Word of Mouth Solomon
(1999)
1. Frequency of communication PM1 2. Pleasure in telling the experience in using a
product
PM2
3. Convince other people to buy a prod uct or service
PM3
4. Pleasure in recommending a product or service to other people
PM4
Willingness Ferdinand (2002)
1. Transactional willingness MD1
2. Referential willingness MD2
3. Preferential willingness MD3
4. Explorative willingness MD4
Decision making
Kotler (2003)
1. Benefit Association PK1
2. Priority in purchasing PK2
3. Frequency in purchasing PK3
Table 2. Likert scale criteria for structural equation model
Source: Rangkuti (2005)
(the dependent variables and independent variables) in an analysis (Hair, et al., 1998).
The hypothesis testing in this study used Partial Least Square (PLS). PLS is an alternative method of analysis by using variance-based SEM. This method has advantages: it does not require assump-tions and it can be estimated with a relatively small sample size.
The data from the questionnaires were recapi-tulated by using MS Excel 2013 then they were stored in the form of a csv file. The csv file was input and analyzed by using SEM method using theassistance of SMART PLS 2.0program. The first stage was path diagram analysis to interpret the output of PLS soft-ware. The second was the analysis of the measure-ment model (outer model or also called measuremeasure-ment model) to evaluate the relationship between construct variables with indicator or manifest variables. Then it was continued the structural analysis (inner model) to evaluate the results of path coefficient parameter estimation and the level of significance.
Analysis of the measurement model or outer modelwas conducted through confirmatory factor analysis with convergent validitytest (convergent validity), discriminant validity test (discriminant validity), and reliability test (composite reliability).
In the analysis of structural models (inner model), the model was evaluated by looking at the value of R-Square and significance value. According to Chin (1998), the R Squarevalue of 0.67 shows powerful model, the value of 0.33 shows a moderate model and a value of 0.19 indicates that the model is weak. As for the significance value by Chin (1998) conducted by bootstrapping analysis to know the influence between the variables by comparing tcountand ttable with confidence interval95%.
FINDING AND DISCUSSION
Analysis of
Outer Model
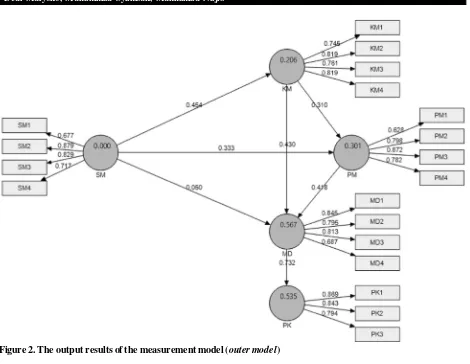
Analysis of the measurement model or outer models was done through confirmatory factor analysis by using convergent validity test, discriminant validity test, and reliability tests (composite reliability). Outer result of the output model is presented in Figure 2.
Based on the analysis result, it is known that the
According to Ghozali (2008) indicator is considered accepted if it has loading value of0.5. In addition to outer loading values, convergent validity test also saw the average variance extracted (AVE)value. AVE value is said to be good if it is more than 0.5. This means that 50% or more variants of indicator can be described. In this study, the analysis result of AVE value was more than 0.5for each variable (Table 3). Based on the loading outer and AVE value, then in this convergent validity test all indicators that reflect latent are declared to have validity.
The consistency of measurement was tested with composite reliability and cronbachs alpha value. Composite reliability and Cronbachs alpha are said to be good if they have a value of more than 0.6. In Table 3 above, it can be seen that all of the latent variables in this study had a composite reliabilityvalue and Cronbachs alpha above 0.6. This means that the indicators used in the study has a good consistency in measuring latent variables.
Discriminant validity test can be seen from the values of AVE square root for each variable which were compared against other correlations between the latent variables in the model. The model is considered to have good discriminant validity if the value of AVE square root is greater than the value of the correlation between one variable with other variables in the model. Based on the comparison of the value of AVE square root and the correlation value between variables in Table 4, it can be concluded that the indicators used in this study met the criteria of discriminant validity.
Analysis Result of
Inner Model
Figure 2. The output results of the measurement model (outer model)
Source: result of data processing (2016)
Table 3. Value ofcomposite reliability, andcronbachs alpha
Composite reliability Cronbachs alpha AVE Value
Brand awareness 0.866343 0.794334 0.618815
Willingness in Donation 0.866565 0.794301 0.620187 Donation decision 0.874052 0.784621 0.698478
Word of mouth 0.855817 0.773645 0.600587
Social Media 0.859751 0.783531 0.607786
Table 4. Correlation of latent variable andsquare root value of AVE
Source: result of data processing (2016)
KM MD PK P M SM Square root of AVE
Brand awareness 1.000 0.786648
Willingness in donation 0.646 1.000 0.787520 Donation decision 0.591 0.732 1.000 0.835750
From Table 5 above, it is known that the R-square value for the variable of brand awareness is 0.206460. This shows that the variability of brand awareness that can be explained by social media amounted to 20.64%, while 79.36% is explained by other variables outside the model studied. Word of mouth variable has the R-square value of 0.300828. This suggests that the variability of Word of mouth can be explained by social media and brand aware-ness by 30.01%, while 69.99% is explained by other variables outside the model studied. Variable of willingness to donate has R-square value of 0.567067. This suggests that the variability of willingness to donate can be explained by social media, brand awareness, and word of mouth amounted to 56.67%, while 43.33% is explained by other variables outside the model studied. The variable ofdonationdecision has R-square value of 0.535230. This suggests that the variability of donation decision that can be explained by the model is equal to 53.52%, while the rest is explained by other variables outside the model studied.
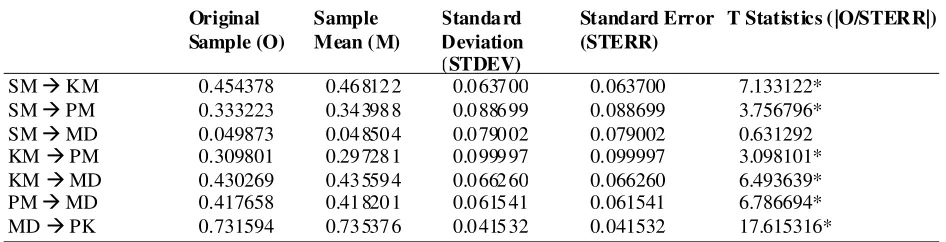
The analysis result of bootstrapping can be seen from tcount value. If the tcount value is greater than the ttable value, it can be concluded that exogenous variables affect the endogenous variables. The analysis result of bootstrappingis presented in Table 6. Table 5. R-Squarevalue
Source: result of data processing (2016)
R-Squarevalue Information
Brand awareness 0.206460 Weak
Willingness in donation 0.567067 Mo derate
Donation Decision 0.535230 Mo derate
Word of mouth 0.300828 Weak
Social media provides a significant positive effect on the brand awareness of Rumah Zakat and the word of mouth. This can be seen in Table 6, the t-count values are equal to 7.133122 and 3.756796 which are larger than the value of t-table (1.96). This means that the higher the increase of social media, the higher the level of brand awareness of Rumah Zakat , and the higher the formation of word of mouth. Thus hypotheses H1 and H2 are acceptable. The great influence of social media on brand awareness is because social media can help spread the content very quickly. This is consistent with that what was stated by Smith and Zook (2011), that social media has to facilitate and improve the flow of information by making it easier to disseminate useful information to many people.This finding fits with previous research, ie Hutter (2013) in his research about the effect of interaction through facebook pages on the increase of the brand awareness of a company. Social media also have positive significant effect on the formation of the mouth to mouth marketing. This is consistent with the results of a research done by Andriyanto and Haryanto (2010), which shows that internet marketing is a positive influence on the formation of Word of Mouth. The different result was shown by the influence of social media on the willingness to donate. Based on Table 6, social media
Table 6. Analysis result of bootstrappinginpath coefficients
variables did not significantly affect the willingness to donate. The value oft-count of 0.631292 is smaller than t-table (1.96). Thus hypothesis H3 is rejected. This is supported by a research conducted by Solomon (1999), who states that a person will have more confidence to the recommendation of their closest people and people who have used the product or service than direct offers or advertising from the company. In this study, although social media is a marketing tool that is interactive and can build interaction between Rumah Zakat with followers, it still can not make the followers immediately decide to make a donation. It should pass through a phase of brand awareness improvement of Rumah Zakat and the emergence of word of mouth in advance.
Brand awareness of RumahZakat provides a significant positive effect on the variable formation of word of mouth. It can be seen from the t-count value, which is equal to 3.098101, is greater than t-table (1.96). This means that the higher the brand awareness, the higher the formation of word of mouth. Thus, hypothesis H4 is acceptable. Brand awareness of Rumah Zakat also provides a significant positive effect on the willingnessto donate. The t-count value of 6.493639 is greater than the t-table (1.96). This means that the higher the brand awareness, the higher the willingnessto donate. Thus, hypothesis H5 is acceptable. This is consistent with the result of a research undertaken by Do Paco et al. (2014) that brand awareness of significantly gives positive effect on a person’s willingness to make a donation to NGO institution. According to Rossiter and Percy (1987), brand awareness is very important because it is the first step in the process of communicating products or services to consumers. Without the brand
awareness, people are not aware of a brand and there is no other effect of communication that may occur. Macdonald and Sharp (2000) say that the continuous repetition in an advertisement is carried out by the company in order to keep the brand remains in consumer consideration when making purchasing decisions.
Word of mouth gives positive effect which is significant on the variable of willingness to donate to Rumah Zakat. It can be seen from the t-count value which is equal to 6.786694, greater than t-table (1.96). The higher the formation of word of mouth, the higher the willingness to donate to Rumah Zakat. Thus, hypothesis is H6 acceptable. This is in accordance with Solomon (1999) who says that word of mouth is stronger than the advertisements made by the company. In a study conducted by Cleland (2000), it is also found that word of mouth tend to be more effective in marketing a product or service. Willingness to donate provides a significant positive influence on the variable ofdecision to donate to Rumah Zakat. It can be seen from the t-count value, which is equal to 17.615316, larger than t-table (1.96) with a beta coefficient of 0.731594. Thus, hypothesis H7 is acceptable. Ajzen and Fishbein (2005), put forward the theory, which states that the stronger the intention of doing a particular behavior, the greater the possibility do the behavior.
Result of Hypotesis Test
Based on the evaluation result of inner model, conclusion on the results of the hypothesis test proposed at the beginning of the study is presented in Table 7.
Table 7. Result of Path CoefficientT-test
Hypothesis of the research Result
Hypothesis 1 : Social media significantly influencesbrand awa reness Accepted Hypothesis2 : Social media significantly influences word of mou th Accepted Hypothesis3 : Social media significantly influences donation decision Rejected Hypothesis4 : Brand awa renesssignificantly influences word of mouth Accepted Hypothesis5 : Brand awa renesssignificantly influenceswillingness of
donation
Accepted
Hypothesis 6 : Wo rd of mo uthsignificantly influences willingness of donation Accepted Hypothesis 7 : Willingness of donation significantly influences donation
decisio n
CONCLUSION AND SUGGESTION
Conclusion
The management of social media of Rumah Zakat which is growing better would make the higher level of brand awareness of Rumah Zakat, and the higher formation Word of mouth. The high brand awareness of Rumah Zakat will increase the formation of mouth to mouth marketing and increase the public’s willingness to donate to Rumah Zakat, which will ultimately improve the donors’ decision to give donations to Rumah Zakat.
Suggestion
Based on the result of this research, some things can be used as input and concern for Rumah Zakat, especiallyother philanthropyinstitutions in general which use social media to promote the program and get the donator, that the management of social media as a marketing tool should be maximized by forming a special directorate of social media and recruiting professional human resources in running the fundraising campaign in social media. Rumah Zakat also needs to increase the intensity of the interaction (engagement) with social media users. Interactive activities with users of social media can make a positive impact on brand awareness, formation of word of mouth that will indirectly bring the desire to make a donation to Rumah Zakat.
REFERENCES
Ajzen, I., and M. Fishbein. 2005. The influence of attitudes on behavior. The handbook of attitudes. Halaman 173-221.
Andriyanto, R.D., J.O. Haryanto. 2010. Analisis pengaruh internet marketing terhadap pembentukan word of mouth dan brand awareness untuk memunculkan intention to buy. Jurnal Manajemen Teknologi Vol-ume9, Nomor 1, Halaman 20-35.
Arikunto, S. 2010. Prosedur penelitian : Suatu Pendekatan Praktik (Edisi Revisi). Jakarta: Rineka Cipta. Ayuniyyah, Q. 2011. Factors Affecting Zakat Payment
Through Institution of Amil: Muzaki’s Perspectives Analysis (Case Study of Badan Amil Zakat Nasional[BAZNAS]). Al Infaq: Jurnal Ekonomi Islam. Volume 2, Nomor 2, Halaman: 46-61.
Chin, W.W. 1998. The partial least squares approach to structural equation modeling. Modern methods for
Cleland, R.S. 2000. Building successful brands on the internet. Cambridge: University of Cambridge. Dann, S., and S. Dann. 2011. E-marketing: theory and
ap-plication. Palgrave macmillan.
Do Paço, A.,R.G., Rodrigues, and L. Rodrigues. 2014. Brand-ing in NGOs-its Influence on the Intention to Do-nate. Economics & Sociology. Volume 7, Nomor 3, Halaman 11-21.
Ferdinand, A. 2002. Structural Equation Modeling Dalam Peneltitian Manajemen: Aplikasi Model-Model Rumit Dalam Penelitian Untuk Tesis Magister & Disertasi Doktor (Ed ke-2). Semarang: BP Universi-tas Diponegoro.
Ghozali I. 2008. Structural Equation Modeling: alterna-tive method with Partial Least Square (PLS). Semarang: BP Universitas Diponegoro.
Hutter, K. 2013. The impact of user interactions in social media on brand awareness and purchase intention: the case of MINI on Facebook. Journal of Product & Brand Management. Volume 22, Nomor 5, Halaman 342-351.
Keller, K.L. 1993. Conceptualizing, measuring, and ma-naging customer-based brand equity. Journal of Mar-keting. Volume 57, Nomor 1, Halama 1-22.doi: 10.2307/ 1252054.
Kementerian Komunikasi dan Informasi. 2014. Pengguna Internet di Indonesia. [online].From:http://kominfo. go.id/index.php/content/detail/3980/Kemkominfo% 3A+Pengguna+Internet+di+Indonesia+Capai+82+Juta/ 0/berita_satker#.Vg1QuPmqqko [2014 Mei 12] Kotler P. 2003. Marketing Management. (eleventh ed.).
New Jersey: Prentice-Hall International, Inc. Macdonald, E.K., and B.M. Sharp. 2000. Brand awareness
effects on consumer decision making for a common, repeat purchase product: A replication. Journal of business research. Volume 48, Nomor 1, Halaman 5-15.
Rossiter, J.R., and L. Percy. 1987. Advertising and promo-tion management. Virgina: McGraw-Hill Book Com-pany.
Sugiyono. 2010. Statistika untuk Penelitian. Bandung: Alfabeta
Smith, P.R., and Z. Zook. 2011. Marketing communica-tions: integrating offline and online with social media (fifth ed.). Philadelphia: Kogan Page Ltd. Soeratno, dan L. Arsyad. 1999. Metodologi Penelitian
untuk Ekonomi dan Bisnis. Yogyakarta: UPP AMP YKPN.
Solomon, R.M. 1999. Consumer Behavior, Buying, Hav-ing and BeHav-ingupper. Saddle river: Prentice Hall. WAS. 2015. Special Report: Digital, Social & Mobile in
2015. [online]. From: http://wearesocial.com/sg/spe-cial-reports/digital-social-mobile-2015 [2016 April 14]