HIGH SCHOOL DEPARTMENT St. Paul Rd., Brgy. Ugong, Pasig City
Determining Math Anxiety Levels in Grade 11 Students
of St. Paul College, Pasig School Year 2015 to 2016
ARAMBULO, Hannah Kristianne Marie P. XI-7 BUENAVENTURA, Elisse D. XI-7 FELIX, Maria Justine Anne T. XI-7 HILARIO, Isabella R. XI-7 LAGUERDER, Krizelle G. XI-7 MANALOTO, Adrianne Alexis A. XI-7
DATE SUBMITTED: March 21, 2016, Monday
ABSTRACT
In preparation for the implementation of the K-12 system, the pioneering batch were required to take three math courses in the span of 10 months. The researchers believe that the limited coverage of the courses has affected the students' performance in senior high school, as they struggle to incorporate what they have learned into their current math topics and become mentally prone to math anxiety. Math anxiety is a negative feeling that can interfere with one's mathematical abilities & potential (Curtain-Phillips, 1999), which can limit one's actualizations in the field of math.
Math is a crucial component in every curriculum, especially in the STEM track. In an effort to offer insight to this problem, the researchers conducted a systematically random sampling technique-based survey to determine the anxiety levels amongst select Grade 11 students. The survey was retrieved from Pearson Custom and was utilised in similar studies as seen in the review of related literature. The survey clearly determined math anxiety levels and this served as a basis for the follow-up interview given to purposively-selected students, chosen by the degree of their math anxiety. The study features detailed accounts of students with varying levels of math anxiety, with a limit of two representatives per math anxiety level in a track.
In comparison, "math-oriented" tracks such as ABM & STEM have a relatively high percentage of non-existent math anxiety levels as seen in Figure 3. A particular trend is observable in the math anxiety level results of ABM & STEM students: as the level of math anxiety increases, the percentage of their results decreases, except in Figures 5 & 6 wherein STEM's percentage increased by a negligible 1%. These results suggest that there is a correlation between the amount of exposure to math and math anxiety levels, since the ABM & STEM tracks have more math-related subjects than HUMSS & SAD.
The data collected in the briefness of this study suggests that there is an indisputable correlation between a student's chosen track and their levels of math anxiety, probably because of the limited exposure as stated beforehand. The study encountered difficulty in acquiring willing participants, thus affecting the amount of data we've gathered, particularly during the interviews. Similar studies might be able to examine this correlation further if they have more respondents per track and conduct thorough interviews.
Page
Abstract………..….…....1
List of Tables……….………..…...5
List of Figures……….………...…….6
Chapters 1. Introduction………..……..7
2. Review of Related Literature………..………..9
2.1. Definition of Math Anxiety………....……...9
2.2. People Affected by Math Anxiety………...10
2.2.1. Students………...…..10
2.2.2. Teachers………...11
2.3. Causes of Math Anxiety………....12
2.3.1. Personal………..12
2.3.2. Societal………...13
2.4. Effects of Math Anxiety……….15
2.4.1. Individual………...15
2.4.2. National………...17
2.5. Solutions and Preventive Measures of Math Anxiety………...18
2.5.1. How the Students Can Help Themselves………..18
2.5.2. How the Teachers Can Help the Students………...19
3. Methodology………..22
3.1. Research Site………...22
3.3. Participants……….…23
3.4. Data Gathering Procedure………..23
3.4.1. Survey Questions………...…...24
3.4.2. Interview Questions………...…...25
3.5. Ethical Considerations………...26
4. Results………....27
4.1. Determining Levels of Math Anxiety…..………...27
4.2. Grading System of St. Paul College, Pasig……….…...28
4.3. Summary of Data Gathered from the Surveys………..29
4.4. Summary of Data Gathered from the Interviews………...39
5. Discussion………...52
5.1. Summary………....52
5.2. Interpretation of Findings………..52
5.2.1. Major Findings………...52
5.2.2. Causes………..……...55
5.2.3. Solutions………....56
5.3. Application………....57
5.4. Limitations……….57
5.5. Future Research...………58
5.6. Implications...58
6. References...59
Tables Page
Table 1. Scores and their Corresponding Level of Math Anxiety………...27
Table 2. Levels of Proficiency and their Equivalents…………...……….…..28
Table 3. Average Scores for the Second Part………..31
Table 4. Summary of Interviews for High Math Anxiety Levels………....39
Table 5. Summary of Interviews for Moderate Math Anxiety Levels………....44
Table 6. Summary of Interviews for No Levels of Math Anxiety………...48
Figures Page
Figure 1. Perception of Students Towards Math………30 Figure 2. Average Scores for the Second Part………...32 Figure 3. Percentage of Non-existent Math Anxiety Levels within Batch 2017………...35 Figure 4. Percentage of Low Math Anxiety Levels within Batch 2017………....36 Figure 5. Percentage of Moderate Math Anxiety Levels within Batch 2017………37 Figure 6. Percentage of High Math Anxiety Levels within Batch 2017………38
At the beginning of the research process, the researchers first thought of the question “Do students see math as an essential subject?”. Through further research, the researchers were able to determine to answer to that: Yes, students do see math as an essential subject. Math has been part of the standard curriculum for students since grade school. In fact, math is already introduced to students as early as nursery. This led the researchers to another question: “What makes math a challenging subject, particularly for high school students?”. They tried to determine the reasons as to why students find math challenging and to find solutions for this particular learning predicament. Solutions such as developing exciting activities related to math that schools can offer to make math more interesting for students.
While rigorously researching, the researchers encountered the term ‘math anxiety’, which is later on fully defined in this paper. There are a lot of answers as to why students may see math as a challenging subject and having math anxiety could be one of the reasons. This led to the researchers to focus on math anxiety and how it can be cured or avoided.
They have observed that the Grade 11 students did not have enough time to learn all their math subjects, which is probably the reason behind why they are struggling to remember and incorporate what they learned last year, into what they are doing now in their math subjects. They want to try to determine if any traces of math anxiety have resulted in the Grade 11 students since the change in curriculum.
This research is being conducted in order to encourage more students take the STEM (Science, Technology, Engineering, Math) track in Senior High School and to make students appreciate the subject of math more. This also aims to find the solutions to math anxiety and how it could be prevented.
CHAPTER 2. REVIEW OF RELATED LITERATURE
Math Anxiety is a debilitating emotional reaction to mathematics that is increasingly recognized in psychology and education. It has been defined as "a feeling of tension and anxiety that interferes with the manipulation of numbers and the solving of mathematical problems in ordinary life and academic situations" (Curtain-Phillips, 1999). It ranges from feelings of mild tension to a strong fear of mathematics and is not restricted to test or classroom settings, with the result that those affected develop a severe avoidance of situations involving any kinds of mathematics.
Math anxiety is a serious and pervasive problem, especially in the community-college setting. Students may experience math anxiety in many forms and degrees, from “freezing up” during a math exam, to attempting to avoid anything having to do with numbers. Symptoms may be physical or psychological. Physical symptoms include nausea, shortness-of-breath, sweating, heart palpitations and increased blood pressure. Some psychological symptoms are memory loss, paralysis of thought, loss of self-confidence negative self-talk, math avoidance and isolation (thinking you are the only one who experiences it). These symptoms and other negative math experiences may lead to a vicious cycle in which fear of math interferes with learning math which leads to more negative math experiences (Preis & Biggs, 2001).
and in biology labs and they're enabling marketers to forge new one-on-one relationships with customers. As this occurs, more of the economy falls into the realm of numbers.” (Baker, 2006).
Math anxiety implies more than “bad at math.” It implies that someone would be better at math if he or she weren’t so anxious -- there is evidence that’s true. A growing body of work shows that math anxiety robs people of working memory. Working memory can be thought of as a kind of mental scratch pad. It makes keeping several things in mind simultaneously possible. Math anxiety essentially prompts students to do two things at once: solve the math problem and deal with worries about the math (including worries about getting the problem wrong, looking foolish, and what others may think of them). As a result, students have less working memory to devote to the math, and their math performance suffers (Beilock & Willingham, 2014).
People Affected By Math Anxiety
Students
Cognitively predisposed children are more vulnerable to negative social influence. In link to the previous statement, elementary students are likely to be influenced by their primary source of information: teachers. Studies do imply that negative attitudes towards math may be passed down from teacher to student (Maloney & Beilock, 2015).
Teachers
Math anxiety can also occur in teaching professionals. A recent study by McAnallen (2010) involving 691 teachers from eight states with diverse geographic locations determined that majority of the participants have only taken Algebra I as their highest level of mathematical education. Nearly 33% of the total applicants reported that they feel anxious towards math and consequently negatively received the idea of pursuing higher levels of mathematical education. Participants who reported to have math anxiety noted that "negative elementary or secondary interactions with teachers about mathematics, poor teaching practices while they were in school, and/or negative experiences taking algebra or geometry in high school," were the primary causes of their anxiety.
Causes of Math Anxiety
The reasons for math anxiety can be classified by three main factors: environmental, having negative experiences in math subjects or with bad teachers; personal, the lack of confidence, low self-esteem, and the influence of previous negative experiences with mathematics or; cognitive, the innate qualities such as failure to naturally adept at math, which fuels a sense of inadequacy (Adelson, 2014). Since math demands correct answers, it may bring about more anxiety over making mistakes compared to reading and understanding (Menon, 2012). In the case of other students, factors such as the fear of not finishing a timed test, being placed in math courses above level of competence, or feeling not in control of one’s life situation, can also contribute to one’s math anxiety (Diaz, 2009).
According to Pekrun (2006), a leading researcher in the area of emotions in the classroom, the Control-Value theory of Achievement Emotions helps explain this. The theory is centered in the trigger of achievement emotions, which includes activity-related emotions such as enjoyment, and anxiety. There are two components in his theory: (1) how much as student values what they are doing. and (2) how much control the student believes that he or she has over a task. When a student highly values what they are doing and has a high level of control over the task, he would find enjoyment. On the other hand, when a student highly values a task but has no control, anxiety is experienced.
math task. Researchers from the study concluded that the reason of the decrease in the performance of math was not caused by the skill level of the individual but the ability to manage anxiety at the anticipatory stage and focus to the task at hand (Buckley, 2011).
Societal
Unconsciously, society facilitates the development of math anxiety as it is considered a cultural norm. Each culture has a different source for math anxiety as a nation but two distinct cultures would be the Western countries and the Asian perspective.
For the Asian perspective, Shields (2006), a student from the University of Hong Kong, conducted a study on 91 college students to gather their personal insights on math anxiety, and to determine how and when math anxiety surfaced throughout their school lives. Results showed that 61% of respondents related their math anxiety to teachers. 19% being the largest percentage, started to experience math anxiety in the ninth grade, followed by 15% in the seventh grade, 12% in fourth grade, and 11% by the eighth or eleventh grade. Joining grades seven, eight, and nine, which are the years that students are introduced to Algebra, 45% of respondents first felt math anxiety during then. Likewise, 51% expressed their beginning of math anxiety during Algebra class.
seeing that they felt that they could not do what society (may include parents and/or significant others) expected of them (Shields, 2006.; Diaz, 2009). On the topic of teaching methods, it was examined that being taught in smaller groups and working in pairs seemed to create less anxiety, whereas individual and team competitive math activities made the majority of respondents more anxious (Schenkel, 2009).
On the other hand, the Western perspective was explained by Buckley (2011) who stated that "negative community beliefs about maths are often heavily endorsed in adolescence throughout high school per culture norm". The majority of society share the commonality of math anxiety that it has been socially accepted to be normal. Due to the association of math with the idea of intelligence, the rest of society that don't show high levels of math anxiety are labeled as a 'nerd' due to their enthusiasm and ability to perform better than others.
with math, a logical subject. At a young age, girls may not have as much opportunity given to them to investigate the world (mathematically) the same way with boys. This discourages girls enrolling for any advance math subjects in upper secondary school (Bohrd, Blazek, & Verkhovtseva, 2011; Buckley, 2011).
All in all, most students perceived their math anxiety as a result of lacking cognitive skills, and even believing that it becomes worse as they attempt to improve those skills (Shields, 2006).
Effects of Math Anxiety
Individual
Doing math naturally triggers an effect on our brains, which includes the release of stress hormones like cortisol, which is what triggers our flight or fight response. Studies have proven that anticipating a math test activates the brain’s “pain matrix” or the region that gets triggered when you injure yourself (Robson, 2015).
have due to the reason that they'd prefer to avoid not only the subject math but also the courses and careers that involve it (Buckley, 2011). This also results to excessive reliance on other people to accomplish simple math tasks. The student or adult does not believe that he or she can accomplish any task related to mathematics.
According to Newman (1985), the math processing center of the brain is overwhelmed by math tasks and shuts down when experiencing math anxiety. Poor encoding, decoding, memory, processing, and retrieval of math facts are also symptoms that people with math anxiety encounter. Researchers conducted a study on what occurs inside a person’s brain when they performed math. Through fMRI scans, it was evident that the worry of upcoming math events triggered a response in the brain much similar to physical pain. A person’s anxiety about math will activate their posterior insula, a piece of tissue deep in the brain located above the ear, and is connected to acknowledging threats to a person’s body such as physical pain.
More specifically, as proven by Young, Wu, and Menon (2012), heightened activity occurs in the right amygdala, the same area that responds with fear to trigger stimuli, heightened activity in the hippocampus, which helps us form memories, reduced activity in parts of the prefrontal cortex involved with working memory, attention, and number reasoning, and greater connective strength between the amygdala and a part of the prefrontal cortex that regulates negative emotions.
High levels of math anxiety is seen to negatively affect an individual's ability to run working memory - the information needed to make mental calculations. The Chief Scientist of the Australian Council for Educational Research stated that "the understanding of the pervasiveness in and importance of mathematics, engineering and science to Australia's Future needs to be promoted and nurtured across the community" (Buckley, 2011). The development of a negative response towards the subject would greatly affect the country's progressive development as a chain reaction towards the national level.
Studies conducted in both the countries, Australia and USA, showed that a significant amount of people have avoided careers with math degrees causing a decrease of college and university enrollees (Buckely, 2011). This would limit the country's employee resource in STEM fields. Careers holding such degrees play an important role in the development of society such are engineers, architects, physicists, math teachers, accountants, economist and etc. The U.S. Department of Education (as cited in Andrews & Brown, 2015) claims that the lack of work force in the STEM field has been a pressing issue for decades; wherein they are forced to find manpower abroad. The percentage of that dependence have increased by 8% between the years, 1990 and 2000 (Brown & Andrews, 2015).
Solutions and Preventive Measures of Math Anxiety
An important step in overcoming math anxiety is changing one’s attitude toward it. It is recommended that students not view mathematics as something to be dreaded, and instead as something they can look forward to learning, or as a challenge they are willing to beat like games (Perles, 2012; Crowder, 2011). Similarly, many games are based on math concepts such as cards, and battleships (Curtain-Phillips, 1999). It is also recommended for students to train themselves not to engage in negative self-talk (Crowder, 2011; Freedman, 2010; Mission College, 2009) and replace it with more positive messages. A simple principle to follow because a person's mind has a great influence with success (Curtain-Phillips, 1999). Students should also practice relaxation techniques such as deep breathing and visualization to help release the tension and anxiety (Blazer, 2011). A study conducted by professor Sian Beilock and PhD student Ian Lyons in 2011 showed through brain scans the connection between activity in a network of regions in the frontal and parietal lobes and the anxiety that students face when performing math-related tasks. It was seen that a highly math-anxious student’s ability to focus their attention and control emotions has a large impact on how they perform in math-related tasks. Students should practice taking control of their emotions and concentrating on the task at hand before the anxiety fully sets in when anticipating math-related tasks (Adelson, 2014).
linked to stress, and can amplify the symptoms of anxiety (Sherman, 2015). By learning to organize their notes, schedules, school things and study habits, students will become less affected by the anxiety that comes with math (Mission College, 2009). Another recommended strategy is for students to adopt a new style or modify their current style of studying. Students should play to their strengths and find a good studying technique (Freedman, 2010; Rispoli, 2011), and should use these studying techniques to better understand the processes in the lesson. Students should ask questions about concepts that they do not understand or want to clarify (Freedman, 2010; Mission College, 2009).
If none of the mentioned solutions work, it is highly recommended for students to seek assistance from teachers, peers, family, or hire a tutor that best suits their learning style. Because of this, students should not rely solely on memorization (Freedman, 2010; Rispoli, 2011), and should use these studying techniques to better understand the processes in the lesson. Students should ask questions about concepts that they do not understand or want to clarify (Freedman, 2010; Mission College, 2009).
How Teachers Can Help the Students
connection that the teacher has with their students can have the potential to help promote an effective learning environment.
Every teacher must remember that the purpose of teaching is to understand and not to replicate and memorize (Haralson, 2002). Researchers have conducted a study that by focusing on using different teaching styles, methods of assessment, and extra tutorial lessons helped improve math anxiety. One effective method is the investigative method wherein students are independently making their own decisions on how to solve the problem and even create their own problems. In order to help ease the process, it is highly suggested by Schwartz (as cited in Smith, 2004) that it should be in an ascending manner -starting from simple problems to more complex ones.
It is advisable for teachers to show their concern and care for their students in order to build a more comfortable environment for learning (Haralson, 2002). This helps encourage students to ask more questions openly and recite during classes, since students learn best when they are active rather than passive (Curtain-Phillips, 1999). In the situation where in a student would incorrectly answer, teachers must deal with their response with positive reinforcement as not to cause any 'trauma' to the students (Haralson, 2002).
see his students are still people. He must learn not only to put himself in their shoes and relate to their struggles but to also have patience to assist them to the best of his capabilities in understanding the concepts that he teaches.
According to Prescott (as cited in Smith, 2004), the teacher must also allow his students to make up their own questions and problems to encourage critical thinking. It is more important that does not emphasize with right or wrong but the correct process. He stresses the need of math students to realize that math is more than computations. Steele & Alfred (as cited in Smith, 2004) supports this by explaining that flexibility in math helps facilitate cooperation, reduce stress and anxiety, and create positive attitudes.
CHAPTER 3. METHODOLOGY
The study occurred in Saint Paul College, Pasig, an internationally accredited all-girls catholic school that serves students from nursery to the 12th grade. The school is compliant with the requirements of the Department of Education, and was accredited by the Philippine Accrediting Association of Schools, Colleges, and Universities (PAASCU), garnering a level three status for the grade school and high school department. The school was also accredited by Western Association of Schools and Colleges (WASC), from the 9th to 12th grade, consisting of students with an approximate class size of 30-40. Despite the large student body, the study focuses on Grade 11 students.
Study Design
This study on the causes of math anxiety on students was done using a qualitative method. The data was encoded into a Microsoft Excel file, where it was analyzed. The survey was extracted from the Pearson Custom website, which was properly cited. There was also an additional question added by the researchers to validate and deepen their understanding on the result gathered from the respondents. The aim of this study was to find the causes of math anxiety in students in order to propose the most effective solution to alleviate the condition.
Participants
(Science, Technology, Engineering, and Mathematics) and ABM (Accounting, Business, and Management). We decided to not only focus on STEM students because we needed a diverse group of respondents to get a general view of Paulinians. This batch of students, specifically Batch 2017, is the pioneering batch for the K-12 curriculum. They were chosen to get a view on the anxiety acquired by students undergoing the new curriculum.
Data Gathering Procedure
The systematic random sampling technique was used by picking specific class numbers to choose as respondents for the survey. These were class numbers 3, 5, 7, 13, 17, 21, 23, 30, 34, 36 chosen from rooms 1-9 in the 11th Grade. For the interviews, the purposive non-probability sampling method was used. The interviewees were chosen by the degree of their math anxiety. Two interviewees were chosen per track from none, low, moderate, and high levels of math anxiety.
Survey Questions
The first question included in the survey was “How do you feel about math?” This could be answered by three choices, which were “I like it”, “I hate it”, and “I have mixed emotions on it”. This was then preceded by statements that the respondents rated from 1 to 5, where in 5 being the most relatable and 1 being the least relatable. The ten statements used were the following:
● I cringe when I have to go to math class.
● I am uneasy about going to the board in a math class. ● I am afraid to ask questions in math class.
● I am always worried about being called on in math class.
● I understand math now, but I worry that it’s going to get really difficult soon. ● I tend to zone out in math class.
● I fear math test more than any other kind. ● I don’t know how to study for math tests.
Interview Questions
The following were questions asked:
1. State your name, track; ask them “What do you feel about math?” 2. Do you think that math is needed or can be applied in real life?
3. Depending on the respondents, discuss the statements that were rated with 5’s (for high levels of math anxiety), 1’s (for no levels of math anxiety), or the lowest/highest rated statement (for moderate levels of math anxiety).
4. What is your ideal learning environment and style? 5. How did you fare in your math subjects this school year?
6. Where in particular did you experience difficulties? (these include teachers, lessons, etc.)
7. Who are your teachers and what do you think about their teaching styles?
*the teachers’ names are concealed in the results because the interviewees’ opinions are considered confidential
8. Was there a particular teaching method that your previous/current teachers employed that you felt was very effective? Why?
Ethical Considerations
accountancy, and management. The HUMSS track is focused with social sciences and humanities. The STEM track is focused with science, math, engineering, and technology. And the SAD track is focused with sports, arts, and design. They have different views on math based on their current track and future careers.
CHAPTER 4. RESULTS
Table 1. Scores and their Corresponding Level of Math Anxiety
RANGE OF SCORES LEVEL OF MATH ANXIETY
40 - 50 High
30 - 39 Moderate
20 - 29 Low
10 - 19 None
In order to determine the level of math anxiety based on the assessment, Pearson Custom developed a method that the sum of the scores would determine the level of math anxiety. As seen in Table 1, there is a corresponding range of scores per level of math anxiety.
Grading System of St. Paul College, Pasig
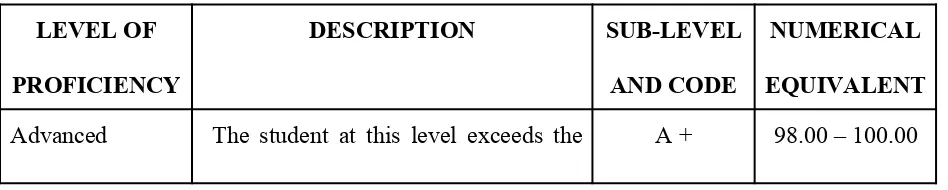
Table. 2 Levels of Proficiency and their Equivalents
LEVEL OF
PROFICIENCY
DESCRIPTION SUB-LEVEL
AND CODE
NUMERICAL
EQUIVALENT
core requirements in terms of knowledge, skills, and understandings, and can transfer them automatically and flexibly through authentic performance.
A 95.00 – 97.99
Proficient The student at this level has developed the fundamental knowledge, skills, and core understandings, and can transfer them independently through authentic performance tasks.
P + 93.00 – 94.99
P 90.00 – 92.99
P - 88.00 – 89.99
Approaching Proficiency
The student at this level has developed the fundamental knowledge, skills, and core understandings and, with little guidance from the teacher and/or with some assistance from peers, can transfer these understandings through authentic performance tasks.
AP + 86.00 – 87.99
AP 83.00 – 85.99
AP - 81.00 – 82.99
Developing The student at this level possesses the minimum knowledge and skills and core understandings, but needs help throughout the performance of authentic tasks.
D + 78.00 – 80.99
D 75.00 – 77.99
her understanding; prerequisite and fundamental knowledge and/or skills have not been acquired.
Table 3 shows the updated grading system of St. Paul College, Pasig, effective by the start of school year 2015 - 2016. This table will be the comparative basis on the results yielded from the interviews since the grades of the interviewees in math was requested.
Summary of Data Gathered from the Surveys
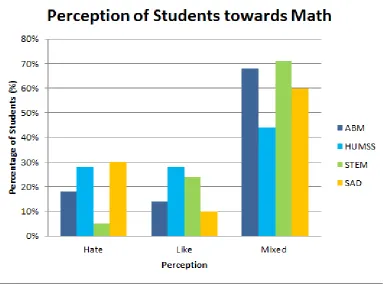
Figure 1. Perception of Students Towards Math
Figure 1 shows the different perceptions of Batch 2017 towards the subject of math.1 The Grade eleven students were given three options to answer as their perception; those are namely hate, like, or mixed emotions.2 In examining all Senior high tracks, it was seen that the SAD students hate math the most, while the HUMSS students seem to appreciate math the most.3 Then the students of STEM, with ABM close behind, were observed to have mixed emotions towards the math subject.4 With these findings, it can be concluded that the majority of SAD does not enjoy math, whereas the opposite goes for the majority of HUMSS.5 As for STEM and ABM though, most of them are still contemplating about their love or hate towards math.6
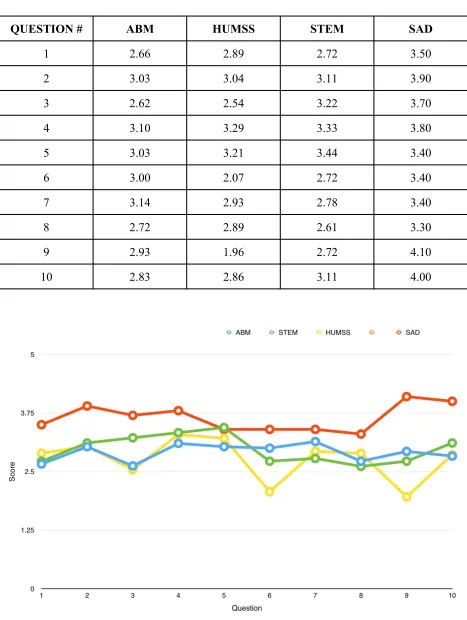
QUESTION # ABM HUMSS STEM SAD
1 2.66 2.89 2.72 3.50
2 3.03 3.04 3.11 3.90
3 2.62 2.54 3.22 3.70
4 3.10 3.29 3.33 3.80
5 3.03 3.21 3.44 3.40
6 3.00 2.07 2.72 3.40
7 3.14 2.93 2.78 3.40
8 2.72 2.89 2.61 3.30
9 2.93 1.96 2.72 4.10
10 2.83 2.86 3.11 4.00
Table 3 and Figure 2 shows the average of scores of each track per question. The first survey question, I cringe when I have to go to math class.1 Out of the four senior high tracks, SAD was shown to have strongly agreed with the statement, leading with the highest average score of 3.50.2 Following SAD are HUMSS, STEM, and ABM, with average scores of 2.89, 2.72, and 2.66 respectively.3 These findings overall suggest that students in the track of SAD do not look forward to attending math class as compared to the students of ABM who do not mind as much.4
The second survey question, I am uneasy about going to the board in a math class.1 Based on the data, it is observable that the students of SAD are the ones who feel most uneasy about carrying out the task, followed by STEM, HUMSS, and ABM.2 Thus, it can be concluded that the SAD students are not as confident in their abilities to solve board works in comparison with ABM, HUMSS, and STEM students.3
The third survey question, I am afraid to ask questions in math class.1 After conducting this specific question, it was noticed that mainly the SAD students were afraid to ask questions in math class as compared to STEM, ABM, and HUMSS students.2 Therefore, it can be said that SAD students feel uncomfortable in seeking further clarification on math topics much more than other tracks such as ABM and HUMSS.3
students of the other different tracks.3
The fifth survey question, I understand math now, but I worry that it’s going to get really difficult soon.1 Looking at Figure 2, it can be observed that STEM students can connect to that statement the most, as they have the highest average score of 3.44.2 To follow STEM are SAD, HUMSS, and ABM with lower average scores of 3.40, 3.21, and 3.03.3 With these results, it is suggested that STEM more than any other track feels that they are currently capable of doing math, but fear that they would not be able to understand the math lessons later on if it gets more complex.4
The sixth survey question, I tend to zone out in math class.1 In examining the data, it is shown that mostly SAD students tend to zone out in math class as compared to the students of ABM, STEM, and especially HUMSS.2 This may indicate that SAD students have a harder time focusing in math class more than any other track in senior high.3
The seventh survey question, I fear math tests more than any other kind.1 Out of the four tracks, SAD is the track who fears math tests the most following with ABM, HUMSS, and STEM.2 It can then be inferred that the students of SAD feel uncomfortable in undergoing math periodical tests much more than the other tracks like STEM.3
The ninth survey question, It’s clear to me in math class, but when I go home it’s like I was never there.1 With the highest average score, SAD can connect with this statement the most as compared to ABM, STEM, and HUMSS.2 This data possibly conveys that the students of SAD easily forget what happens during their math classes more than their fellow batchmates in the rest of the senior high tracks.3
The last survey question, I’m afraid I won’t be able to keep up with the rest of the class.1 In observing Figure 2, it is evident that SAD strongly agrees with this statement as they have the highest average score among the four tracks.2 These findings overall suggest that the students of SAD, more than any other track, are nervous that they would not be able to catch up with the pacing of the math subject, and with the learning abilities of each other as well.3
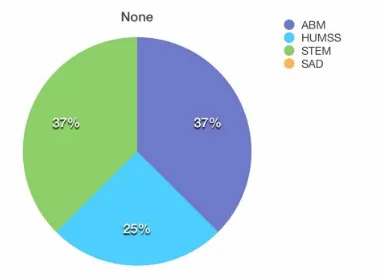
Figure 3 refers to the percentage of students in Batch 2017 who do not have any levels of math anxiety.1 All the senior high tracks, 37% of both STEM and ABM students have no levels of math anxiety, while HUMSS follows by 25%.2 SAD however, is not considered in the pie chart.3 Therefore, it can be concluded that both STEM and ABM are not exactly anxious when it comes to dealing with math.4 However, the same cannot be said for the track of SAD.5
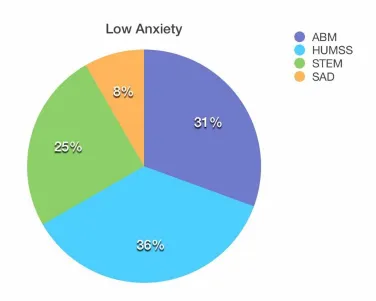
Figure 4. Percentage of Low Math Anxiety Levels within Batch 2017
data, it is seen that mainly HUMSS students are living with low math anxiety more than any other track.3
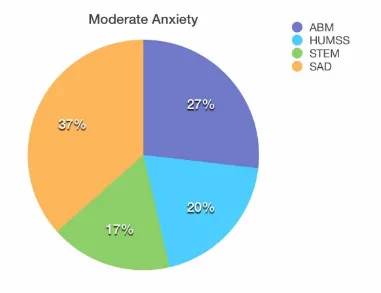
Figure 5. Percentage of Moderate Math Anxiety Levels within Batch 2017
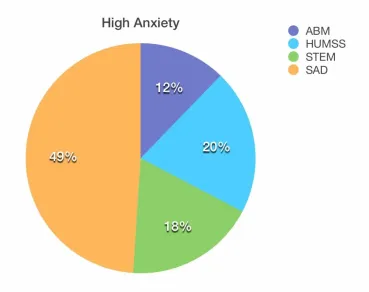
Figure 6. Percentage of High Math Anxiety levels within Batch 2017
Summary of Data Gathered from the Interviews
Table 4. Summary of Interviews for High Math Anxiety Levels
INTERV
STEM
grade below Favourite ⁃
teacher: Sir Bill - “Actually, ayokong ako In 3rd ⁃
biased
Table 4 shows the interview responses of students who were seen with high levels of math anxiety.1 Based on the answers above, it is observable that the majority of these respondents understand the importance of math in real life, but feel very intimidated by their classmates and subject teachers if they are unable to solve math problems given to them.2 Therefore, it can be concluded that their high anxiety is a result of not being able to keep up with the pace of their classmates, and their teachers’ way of giving out lessons.3
Table 5. Summary of Interviews for Moderate Levels of Math Anxiety
INTERV
IEWEE BACKGROUND ACADEMICRESULTS EXPERIENCESPAST DIFFICULTIES OTHERS
crammed
Apilado) - “I like
mistakes
Table 5 pertains to the interview responses of those seen with moderate levels of math anxiety.1 Looking at their replies, most of these students stated that they don’t have much of a problem with the pacing of their math teachers, but find the lessons that they teach more difficult to comprehend.2 These findings also further indicate their moderate math anxiety as these students are afraid to seek assistance and embarrass themselves in front of their classmates.3
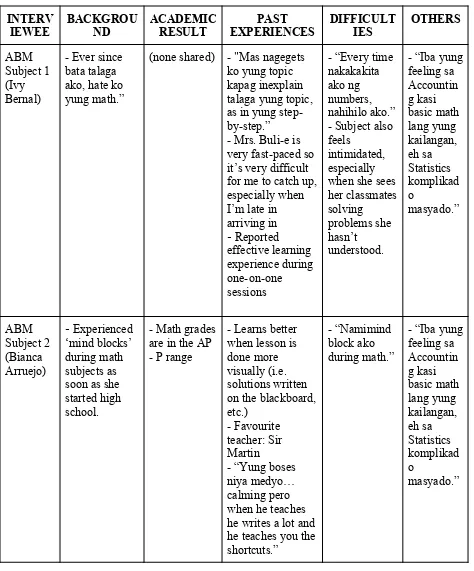
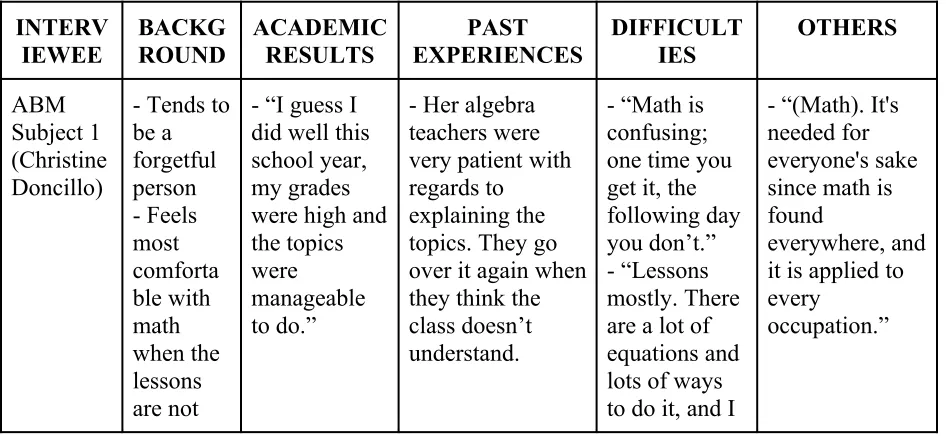
Table 6. Summary of Interview for No Levels of Math Anxiety
big on
understanding & patience.” - “If you want to get good scores, just trust the process & practice a LOT.”
Table 6 makes reference to those students who showed no levels of math anxiety whatsoever.1 Looking at Table 6, it is seen and commonly advised by these students to know that having practice, patience, and a positive mindset towards math are the keys to getting better at it.2 In saying this, this therefore proves that the students do not possess math anxiety since they do not exhibit nervousness when touching upon the topic.3
CHAPTER 5. DISCUSSION
Summary
Based on the data, researchers discovered that the 73% from the Grade 11 students have math anxiety levels from low to moderate, 18% resulted in high, and only 9% scored none, out of the 85 respondents. Among the four tracks, SAD resulted the highest amount of math anxiety followed by HUMSS, STEM, and the lowest ABM.
Interpretation of Findings
Based on the results found in Table 3 and Figure 2, it was observed that SAD had no results of no levels of math anxiety and had the highest averages in the 10 questions. According to Figure 6, they had the highest percentage with 49% of respondents had high levels of math anxiety. According to an interview with SAD Subject 1 in Table 4, she stated that "In art, it's mostly stuff like interpretation & understanding so I have more liberty there than in math wherein it's all about logic.". This finding implies for this is that their right brain is more dominant than their left brain.
It is believed in brain lateralization, our brains are divided into two parts: the left brain, and right brain. The left brain is associated with skills and characteristics of: reading and language, locating details and facts, logical, analytical, systematic, sequential, and etc. On the other hand, the right brain is associated with skills and characteristics of: Visualization, feelings and emotions, creativity, spatial relationships, art expression, and patterns. Both right and left brain have different preferred teaching style (Pogoy, 2015). This also helps explain why STEM and ABM students are less anxious than the rest of the tracks. As opposed to the more dominant right brain students of SAD, STEM and ABM students are more dominant with their left brain as they possess more skills and characteristics associated with it.
excel in math. This places pressure on those students who are struggling with math and results in high levels of math anxiety (18% of respondents) that is seen in Figure 6.
St. Paul College, Pasig provides a program called Mathematics and Science Excellence Program (MSEP) for students who excel in the subjects math and science. MSEP is a program that has an annual qualifying test offered to select students from Grade 3 to Grade 10. It was observed that in Table 6, ABM Subject 1 shared that she backed out twice in this program due to the intimidation she felt from the other MSEP students as she stated “I asked to be transferred away from MSEP twice because I got scared like, people there are smarter than you.” Another finding from Table 6 is that HUMSS Subject 1 shares the same problem of zoning out or having mind blocks in class just as most of the the interviewees with high levels of math anxiety have. Regardless of these facts, both have no levels of math anxiety. This finding helps explain Pekrun’s Control-Value theory of Achievement Emotions that can be found in chapter 2. Both ABM and HUMSS Subject 1 of Table 6 an example of a student who highly values what they are doing and has high level of control over the task which explains her result.
corresponds to the responses of students with high and moderate levels of math anxiety from Tables 4 and 5.
Teachers are most effective when their teaching style corresponds with the preferred teaching style of the student. Most of the interviewees preferred teaching methods that are visual. This includes a step by step explanation on the board, and more items or examples to work on. For most of them, the ideal learning environment are one-on-one sessions or small groups, and an adaptive pace of academic discussion.. In Table 5, HUMSS Subject 1 shared that her Grade 4 and 8 math teachers did a one-on-one session with her and as a result, she was able to grasp the lessons better. Another effective method a teacher can do depends on their attitude toward teaching, and the concern or empathy they show towards their students (in reference of chapter 2). For example, if the teacher teaches in a lively manner and shows concern or empathy to the student, the student would be encourage to learn. If the teacher teaches in a monotonous voice and has no regard for the emotions of the student, the student will tend to have difficulties paying attention or even develop a negative perspective with math.
Causes
Other than teacher’s impact on the student, STEM track stereotype, dominance of the left and right brain, there are other factors that affect the students with math anxiety. One would be the feeling of ‘being left behind’ or failing to keep up with the pacing of the teacher during lessons. Most of them have troubles raising questions or reciting during class because they would feel embarrassed. Others are intimidated from the former MSEP students in their class. STEM Subject 1from Table 4 was a previous MSEP student yet she is also intimidated by their presence. Also from Table 4, ABM shared that she especially feels intimidated when her classmates can solve a problem she failed to understand. Some have a fear with long solutions like STEM Subject 1 and inconsistency in solving like ABM Subject 1 from Table 5.
Margaret (2016) believed that “... the biggest reason why people have math anxiety is because of the pre-conceived idea that math is hard. Like, you hear it from people so many times that you begin to think the same and start saying “mahirap yan, ayaw ko na (It’s hard, I give up).” This finding was mentioned in the review of related literature. Buckely (2011) explained that it was culturally and socially accepted norm to ‘hate’ or find math unnecessary. This attitude would account for the relation of grades of the the interviewees in Tables 4 and 5 to their level of math anxiety.
average when compared to Advanced (A+) and Beginning (B). Some of the respondents were surprised at their results because they were expecting a lower grade.
Solutions
Interviewees from Table 6 stated that there is no direct cure to math anxiety. Having yourself be comfortable with math is a long process. It requires a great deal of patience and hard work on the student’s part. Although it is the job of the teacher to adjust to the class’ pacing and preferred teaching style, if students want to get good scores, they should just trust the process & keep practicing (Malaya, 2016). In order to understand math, you have to repeat and repeat the process all over again until it’s almost instinctive. Students also should not panic, most especially when something unfamiliar to them is written on the board. Panicking would not help. Only when they calm down, they would realized that it would not be so bad (Malaya, 2016). You have to understand each principle in order to solve each problem. It is also recommended to take advance lessons in math to avoid being left behind (Reyes, 2016). Just always keep in mind that mathematics isn’t an instant process so get the negative thinking out of the way, sit down, learn it, and practice it (Cabigao & Gamalinda, 2016).
Application
possible solutions in dealing with math anxiety issues. With the knowledge, teachers and parents of the students with math anxiety issues can help them cope and improve in math. These people can help the students develop a positive attitude in math and breed a better environment for learning since they play a great role in the student's success in math.
Limitations
The researchers feel that based on the data that was collected, several limitations could have influenced the data. The lack of time allocated in conducting the research. The distributions of surveys, interviews, and summarization of data were rushed. If time allotment were given more generously, the scope of the research could have been expanded and a more in-depth understanding of the relations of the factors related to math anxiety could've have been generated. The lack of the cooperation from the respondents was another limitation to the study. During the course of surveying, the researchers struggled to distribute and collect the surveys since not all surveys were returned. The researchers also struggled to interview the chosen respondents due to the unavailability of the interviewees. This is one of the greatest limitation during the course of this study since the data needed can only be given by the respondents and the interviewees.
Future Research
quizzes and seatworks given?’, and ‘how many hours does it take to teach a lesson in math?’. If permitted, another addition to the process would be to look at the numerical grade the students received in math during the school year. This is to know accurately discover the effectivity of the teaching style to the students and identify the batch’s preferred teaching style for math.
Implications
Multiple concepts and factors that were found in the review of the related literature was applicable to the results of the study. From the restricted analysis, the researchers highly recommend to focus on the interaction of the teacher with the students. This includes teaching style, personality of the teacher during math class, pacing of the teacher during lessons, and other similar to these. The results that were gathered from the surveys and interviews implied that the interaction of the student and teacher is one of the greatest cause and solution to math anxiety.
REFERENCES
Andrews, A. & Brown, J. (2015). The Effects of Math Anxiety. Retrieved January 13, 2016 from https://www.questia.com/read/1G1-406162569/the-effects-of-math-anxiety
Adelson, R. (2014). Nervous About Numbers. Retrieved January 13, 2016 from
http://www.psychologicalscience.org/index.php/publications/observer/2014/september-14/ nervous-about-numbers.html
Baker, S. (2006). Math Will Rock Your World. Retrieved January 13, 2016 from http://www.bloomberg.com/news/articles/2006-01-22/math-will-rock-your-world
https://hpl.uchicago.edu/sites/hpl.uchicago.edu/files/uploads/American%20Educator, %202014.pdf
Blazer, C. (2011). Strategies for Reducing Math Anxiety. Retrieved January 11, 2015 from http://files.eric.ed.gov/fulltext/ED536509.pdf
Buckley, S. (2011). Deconstructing maths anxiety: Helping students develop a positive attitude towards learning maths. Retrieved January 10, 2016 from
https://www.acer.edu.au/occasional-essays/deconstructing-maths-anxiety-helping-students-to-develop-a-positive-attitud
Bohrd, N., Blazek, C. & Verkhovtseva, S. (2011). How to Overcome Math Anxiety.
http://www.weber.edu/wsuimages/vetsupwardbound/StudySkills/overcomemathanxiety.pd f
Bradley, L. M. (2010). Working With Adults With Math Phobia.
Crowder, B. (2011). 8 Empowering Ways to Beat Math Anxiety. Retrieved January 10, 2016 from http://mathfour.com/math-anxiety
Curtain-Phillips (1999). The Cause and Prevention of Math Anxiety. Retrieved January 14, 2016 from http://www.mathgoodies.com/articles/math_anxiety.html
Diaz, N. (2009). Math Anxiety: Causes and Cures. Retrieved January 14, 2016 from http://www.thetentacle.com/ShowArticle.cfm?mydocid=3456
Freedman, E. (2010). Ten Ways to Reduce Math Anxiety. Retrieved January 12, 2016 from http://www.mathpower. com/reduce.htm.
Haralson, K. (2002). Math Anxiety: Myth or Monster? [PowerPoint slides]. Retrieved January 14, 2016 from
Hembree, R. (1990). The nature, effects, and relief of mathematics anxiety. J. Res. Math. Educ.
21, 33–46. doi: 10.2307/749455
Maloney, E. A. & Beilock, S. L. (2015). Math Anxiety: A Factor in Math Achievement Not to Be Ignored, 2(1), 4-12.Retrieved January 12, 2016 from
file:///C:/Users/Manaloto/Downloads/1443720506k-4-12.pdf
McAllan, R. R. (2010). Examining Mathematics Anxiety in Elementary Classroom Teacher
(Doctoral dissertation). Retrieved from ERIC Institute of Education Science. (ED530770) Mission College. (2009). Overcoming Math Anxiety. Retrieved January 12, 2016 from
http://salsa. missioncollege.org/mss/stories/storyReader$9.
Newman, R. M. (1985). Math Anxiety. Retrieved January 11, 2016 from http://www.dyscalculia.org/dyscalculia/math-anxiety
Pekrun, R. (2006). The Control-Value Theory of Achievement Emotions: Assumptions, Corollaries, and Implications for Educational Research and Practice. Educational Psychology Review, 18(4), 315-341. Retrieved January 14, 2016 from
http://link.springer.com/article/10.1007%2Fs10648-006-9029-9
Perles, K. (2012). Math Anxiety: 7 Simple Solutions. Retrieved January 13, 2016 from http://www.education.com/slideshow/math-anxiety-solutions/does-your-child-freeze/ Pogoy, M. (2015). Powers of the Brain [Powerpoint slides]. Class Lecture.
Preis, C. & Biggs, B. (2001). Can Instructors Help Learners Overcome Math Anxiety?, 28(4), 6-10. Retrieved January 13, 2016 from http://eric.ed.gov/?id=EJ627573
Rispoli, F. (2011). Twelve Ways to Reduce Math Anxiety. Dowling College, Oakdale, NY. Retrieved January 13, 2016 from
Robson, D. (2015). Do You Have ‘Maths Anxiety’?. Retrieved March 20, 2016 from http://www.bbc.com/future/story/20150619-do-you-have-maths-anxiety
Scarpello, G. (2007). Helping Students Get Past Math Anxiety. Connecting Education and Careers, 82(6), 34-35.
Schenkel, B. (2009). The impact of an attitude toward mathematics on mathematics performance. Unpublished MA Thesis, Mariette College.
Sherman, A. (2015). The Link Between Depression, Anxiety, and Disorganization. Retrieved January 13, 2016 from http://psychskills.com/the-link-between-depression-anxiety-and-disorganization/
Shields, D.J. (2006).Causes of math anxiety: The student perspective. Unpublished doctoral dissertation, University of Pennsylvania, Indiana.
Smith, M.R. (2004). Math Anxiety: Causes, Effects, and Preventative Measures (Senior Thesis), 11-14. Retrieved January 14, 2016 from
http://digitalcommons.liberty.edu/cgi/viewcontent.cgi?article=1263&context=honors St. Paul College, Pasig (2015). Levels of Proficiency [Table]. Retrieved from March 17, 2016
from Updates on the Systems of Assessment, Evaluation, and Awards.
Young, C. B., Wu, S. S., & Menon, V. (2012). The neurodevelopmental basis of math anxiety. Psychological Science, 23(5), 492–501. Retrieved January 10, 2016 from