Addressing Palm Biodiesel as Renewable Fuel
for the Indonesian Power Generation Sector:
Java-Madura-Bali System
Natarianto Indrawan1 and Muhammad Ery Wijaya2
Abstract—Energy security defined as how to equitably provide available, affordable, reliable efficient, environmentally friendly, proactively governed and socially acceptable energy services to end user. It has in recent years taken attention of policymakers in different parts of the world. Formulating policy to improve energy security is mandatory, not only because of depleting fossil resource, but also implementing diversity of energy source since utilization abundant renewable energy resources can increase the security of energy supply. One of the abundant renewable energy resources in Indonesia is palm oil. This study analyses the utilization of palm biodiesel for Indonesian power generation sector in the Java-Madura-Bali (JAMALI) system. Two scenarios were created by projecting the demand and environmental impact as well as GHG emissions reduction over the next 25 years. The first scenario subjects on current energy policy, while the second scenario is to substitute of fossil fuel which is still used in the JAMALI power generation system. Effect of palm biodiesel on emission of Carbon Dioxide, Carbon Monoxide, Sulfur Dioxide, Nitrogen Oxides, Particulate Matter, and Volatile Organic Compounds were estimated for each scenario. An externality analysis to complete the environmental analysis was conducted and resource analysis of palm oil plantation based biodiesel was also estimated. Finally, the economics feasibility of palm biodiesel in the power generation sector was analyzed.
Keywords—alternative scenario, energy security, GHG emission, JAMALI power generation system, palm biodiesel, trend scenario
Abstrak—Energy security atau ketahanan energi didefinisikan sebagai kemampuan untuk menyediakan pasokan energi yang handal, terjangkau, efisien, ramah lingkungan, proakftif terorganisir dan dapat diterima secara baik bagi para konsumen akhir, dimana dalam beberapa tahun belakangan ini mendapat sorotan dan perhatian besar dari para perumus kebijakan di berbagai belahan dunia. Perumusan kebijakan untuk meningkatkan ketahanan energi bagi setiap negara merupakan suatu keharusan, tidak hanya disebabkan oleh semakin berkurangnya sumber daya fosil, namun juga sebagai implementasi keragaman penggunaan sumber energi primer dimana penggunaan sumber daya energi khususnya energi terbarukan dengan jumlah melimpah akan meningkatkan kehandalan pasokan energi. Salah satu sumber energi terbarukan yang berjumlah melimpah di Indonesia adalah minyak kelapa sawit. Studi ini memberikan analisis mengenai penggunaan biodiesel berbasis minyak kelapa sawit untuk aplikasi di bidang pembangkit listrik pada sistem Jawa-Madura-Bali (JAMALI). Dua skenario dirumuskan untuk memberikan proyeksi tingkat permintaan dan pengaruhnya terhadap lingkungan khususnya terhadap pengurangan emisi gas rumah kaca (GHG) dalam kurun waktu 25 tahun mendatang. Skenario pertama dirumuskan berdasarkan kebijakan energi saat ini, sedangkan skenario kedua berdasarkan penggunaan biodiesel kelapa sawit untuk mensubstitusi penggunaan bahan bakar fosil yang saat ini masih digunakan di sistem pembangkit JAMALI. Pengaruh dari penggunaan biodiesel kelapa sawit terhadap emisi Karbon Dioksida, Karbon Monoksida, Sulfur Dioksida, Nitrogen Oksida, Debu, dan Senyawa Organik Volatile kemudian ditelaah dan dikaji pada masing-masing skenario. Analisis eksternal untuk melengkapi dan memberikan tambahan informasi analisis lingkungan juga dilakukan serta analisis sumber daya perkebunan kelapa sawit sebagai bahan baku biodiesel juga ditelaah dan dikaji. Akhirnya, kajian dan analisis terakhir berupa studi kelayakan ekonomi penggunaan biodiesel berbasis kelapa sawit di sistem pembangkit listrik.
Kata Kunci—skenario alternatif, ketahanan energi, emisi GHG, sistem pembangkit listrik JAMALI, biodiesel palm, skenario utama
I.INTRODUCTION67
nergy security – defined as how to equitably provide available,affordable,reliable,efficient, environmental benign, proactively governed and socially acceptable energy services to end-user–has in recent years taken attention of policymakers in different part of the world. Since it is estimated that in the coming years, the fossil oil and natural gas price will increase becausethe oil and natural gas production cannot meet the projected demand
Natarianto Indrawan is with School for Bioenergy and Biomaterials Interdisciplinary Program of Graduate School, Chonnam National University, Gwangju, 500-757, Korea. Email: indrwncnslt@yahoo .com.
Muhammad Ery Wijaya is with School of Energy Science, Kyoto University, Kyoto, 606-8501, Japan.
due to resource depletion, government in different part of the world has to formulate its energy policy to assure the security of supply, the sustainable development, and economic growth.
attractive alternative fuel for sustainable development as well as Greenhouse Gas emission (GHG) reduction.
Biodiesel (Greek, bio, life + diesel from Rudolf Diesel) refers to a diesel-equivalent, processed fuel derived from biological sources. Biodiesel, as an alternative fuel for internal combustion engines, is defined as a mixture of monoalkyl esters of long chain fatty acids derived from renewable lipid feedstock, such as vegetable oil or animal fat. Biodiesel typically comprises alkyl fatty acid (chain length C14-C22) esters of short-chain alcohols,
primarily, methanol or ethanol. Several sources for producing biodiesel have been studied such as rapeseed oil, palm oil, sunflower oil, soybean oil, jathropha oil, waste cooking oil, and lard oil. Other sources include almond, andiroba (carapa guianensis), babassu (orbignia sp.), barley, camelina (Camelina sativa), coconut, copra, cumaru (Dipteryx odorata), Cynara cardunculus, fish oil, groundnut, karanja (Pongamia glabra), laurel, Lesquerella fendleri, Madhuca indica, microalgae (Chlorella vulgaris), oat, piqui (Caryocar sp.), poppy seed, rice, rubber seed, sesame, sorghum, tobacco seed, and wheat. As a renewable fuel, biodiesel can be used in neat form or mixed with petroleum diesel. Biodiesel is produced by chemical reaction such as transesterification to reduce the viscosity of oils, where in that reaction, triglycerides are converted into Fatty Acid Methyl Ester (FAME), in the presence of short chain alcohol, such methanol or ethanol, and a catalyst, such as alkali or acid, with glycerol as a by-product. Another altenrnative way to produce biodiesel is through thermal cracking or pyrolysis.
Biodiesel is non-toxic, biodegradable and a better lubricant, producing lower exhaust emissions than petroleum diesel. Biodiesel is also free of sulfur and MJ/kg). Therefore, nowadays Biodiesel has been used in some countries as a substitute for diesel fuel in the transportation sector.
In the power generation sector, at the best of our knowledge, until now there are still few investigation reveals on biodiesel application for producing electricity or power. Most research works including their field test was conducted and contributed by General Electric (GE) research group within the last five years. Compared to petroleum diesel, biodiesel has created evidence that it produces lower smoke opacity, and no visible plume. Biodiesel produces lower of Carbon Monoxide, Nitrogen Oxides and Sulfur Dioxide emission. However, it has slightly higher of Carbon Dioxide emission since lower HHVs of biodiesel creates more fuel consumption. In contrast to automobile system, the Nitrogen Oxides emission is higher and the Carbon Dioxide emission is lower for biodiesel. Also, biodiesel produces low Particulate Matter (PM), Volatile Organics Compounds (VOCs), Polyaromatic Hydrocarbons (PAH), and aldehyde emission [1-2].
Currently, global biodiesel production was increased by 1,800% in the last ten years, growing from 1 billion liter in 2000 to 18 billion liters in 2010 [3], which was dominated by OECD europe countries which use rapeseed oil as the feedstock [4]. Meanwhile, production of biodiesel in United States mainly derived from soybean oil was 2,252 kt/year in 2010, which represented an increase of 55% to the year of 2009 [5]. Similar situation occurs in Asia, where biodiesel producing countries, such as Indonesia, Malaysia, Thailand, Philippines, the PRC and India are now enhancing their production capacity using the most abundant resource in their locality; Indonesia and Malaysia from palm oil, Thailand from palm oil and Jatropha, Philippines from Jatropha, (the) PRC from animal fat, waste cooking oil, sunflower seeds, Chinese pistachio, peanuts, rapeseed, sesame seeds, barbados nuts, fufang vines, yousha bean and Chinese dogwood nuts, India from Jatropha [6].
Considering security of supply, government in different parts of the world have responded to the current situation by formulating policy to improve energy security. Indonesia is not exempt from the problem of declining proven oil reserves; and official sources estimated them only less than 11 year [7]. Since 2004, Indonesia has turned from one of oil exporting countries into the importing ones, providing the fact that energy security must be formulated in quantifiable goals to fulfill domestic energy demand. On the other hand, Non-OECD Asian countries including Indonesia predictably contribute GHG emissions about 5,000 million tonnes of Carbon Dioxide equivalent towards 2030 [8], while in 2008, Indonesia emitted 406.03 million tonnes of Carbon Dioxide (Mt CO2), of which 36.58% and 29.26% were
generated by the Industry and power generation sector [9-11]. As of year 2010, internal demand of diesel fuel in Indonesia still accounted for 44.9% in relation to other fuels [11], which is clearly indicated the high dependancy of fossil fuel in the energy system.
Addressing Biofuels in Indonesia has been recently encompassed by the formation of Directorate General of New Energy, Renewable and Energy Conservation, under Ministry of Energy and Mineral resources, by Precidential decree No. 24/2010, which aims to formulate and conduct the policy and technical standard of renewable and conservation energy, achieving energy diversification and sustainable development [12]. The government of Indonesia also set a target of replacing 15% and 20% fossil fuel by bioethanol and biodiesel by 2025 [3].
Sulawesi, and Papua; with total palm plantation area of 4.52 million hectares in Indonesia, having the highest yield of production among all oilseeds [16]. In biodiesel production, at present Indonesia has reached the total biodiesel production as 2250 kt/year in 2010 [17], which having second lowest unit cost of energy production after latin america countries for ethanol production [18].
In term of power generation sector, at present Indonesia has 31.453 MW installed capacity – 25.6%, 10.7%, and 9.5% corresponds to combined cycle, gas, and diesel power generation. Around 77% total energy produced of the Indonesian power generation sector is still dominated in Java-Madura-Bali (JAMALI) region, which also describe as the most populated area in Indonesia [11]. The fact that those type of power generations, which consume natural gas as primary resource, still use fossil oil to support their operation, providing more amount of pollutants (Carbon Dioxide, CO2; Carbon Monoxide, CO; Sulphur Dioxide, SO2,
Nitrogen Oxides, NOx; Particulate Matter, PM; and
Volatile Organic Compounds, VOCs) emitted during their service. This phenomenon occurs since there is lack of natural gas supply for natural gas power plants. Therefore, those type of power plants still use fossil oil to generate electricity and sustain their operation.
This work analyses the feasibility of using palm biodiesel in the Indonesian power generation sector, JAMALI region. For this reason, the projection of an alternative scenario was made over the next 25 years. This scenario was evaluated in terms of a environmental analysis, the amount of pollutants reduced (CO2, CO,
SO2, NOx, PM10, and VOCs) and the area cultivated with
oil palm. Likewise, GHG mitigation costs were estimated, considering externality that may emerge from both scenario during the analyzed period.
II.METHOD
The power generation system in this work refers to Java-Madura-Bali (JAMALI) region. The power generating system in JAMALI can be classified in Table 1.
The operation of power generation can be run into merit order system, which is dispatch by the priority of power generation can be operated in based load. Merit order 1 indicates power plant for base load, merit order 2 indicates power plant for middle load, and merit order 3 indicates power plant for peak load. In practice, merit order system also indicates the power plant which is preferred to be operated with ascending order of operation cost. Merit order 1 has the lowest operation cost, and merit order 3 has the highest of operation cost (see Table 2).
In addition, planning reserve margin, which is defined as the difference in deliverable or prospective resources (i.e total power generation capacity) and net internal demand (i.e total peak load capacity) divide by net internal demand, described as follow:
PL MW. Module capacity for all processes in the module is defined as:
where PR is the peak system power requirement (MW), ER is the energy requirement (MWh), and LF is the load factor (%).
Furthermore, maximum availability of the power system is defined as the ratio of the maximum energy produced to what would have been produced if the process ran at full capacity for a given period (expressed as percentage).
Two scenarios were created. The first scenario, considered as trend scenario, correspond to the baseline scenario based on fossil fuel utilization while the other; the alternative scenario was developed in order to evaluate the feasibility to use in large scale the biodiesel in the Indonesian power generation sector, and will be discussed in this work.
Scenarios were built and simulated using LEAP (Long-range Energy Alternative Planning System). Windows based version of LEAP has been developed by the Stockholm Environment Institute at Boston Center (SEI-Boston). LEAP is scenario based energy-environment modeling tool, which allows for energy policy analysis most recent data were available for that year.
The period of analysis was based on 25 years time horizon.
Electricity consumption was obtained, while environmental loadings were calculated for each of the analyzed scenarios in term of the CO2, CO, SO2, NOx,
PM10 and VOCs. Then, the emission can be calculated by
following:
Emissions = ECt,y x EFt,y,p
Where EF is the emission factor, EC is the total energy consumed, t is type of technology (fuel), y is year, and p is pollutant.
While, on the other hand, the external and mitigation cost of the alternative scenario were calculated.
The oil-palm cultivated area requirements were further calculated for the alternative scenario, considering the technology advancement in biodiesel production.
Finally, the economics analysis was conducted to observe the biodiesel production cost in conjuction with its application for power generation.
III. RESULTS AND DISCUSSION A. Construction of Trend Scenario
Projection on power generation development and electricity demand in this study refers to electricity supply general planning 2010-2019, which was officially published by Indonesian State Electricity Enterprise (PLN) [11].
1. Power Generation Analysis
power plant, and geothermal power plant, having total capacity of 26.5 GW, as described in Figure 1.
The power plant types in this study are categorized as following:
a. Coal fired steam power plant; The current installed capacity of this power plant is 12.360 MW.
b. Oil fired steam power plant; The existing capacity of this power plant is 1500 MW.
c. Natural gas combined cycle power plant; The total capacity of this power plant is 4215 MW.
d. Diesel oil combined cycle power plant; The current installed capacity of this power plant is 2773 MW. e. Gas turbine (natural gas) power plant; The total
capacity of this power plant is 858 MW.
f. Gas turbine (diesel) power plant; The total capacity of this type is 1228 MW.
g. Diesel power plant; The current installed capacity of this power plant is 76 MW.
h. Geothermal power plant; The current installed capacity of this power plant is 1045 MW.
i. Hydro power plant; The current installed capacity of this power plant is 2536.5 MW.
It can be observed that the power generation system still use fossil fuels, ie. Diesel oil and Marine fuel oil, to generate electricity, which are counted as 21% from total capacity.
Therefore, the JAMALI power generation system clearly contribute negative effect to environment since the pollutants associated with burning fossil fuel can cause external costs, causing real economic impacts such as damage to human health and crops, which will be discussed further in this study.
2. Electricity Demand
The Ministry of Energy and Mineral Resources has responsibility for the electricity planning in Indonesia. The electricity planning is then executed by Indonesian State Electricity Enterprise (PLN) as a major power producer in Indonesia, representing of 85% from total power generation capacity [11]. In 2010, Indonesian State Electricity Enterprise has published the electricity supply general planning 2010-2019, which has function as guidance of electricity planning in Indonesia up to 2019.
Two common factors which are considered as an electricity development indicator are elasticity and energy intensity. Elasticity can be defined as ratio between growth of electricity demand and gross domestic product, which corresponds to the vital role of economic growth in electricity demand advancement, while energy intensity is the ratio between electricity demand and total consumer in a specific horizon. These two factors are determined as key indicator in this work. In 2010, JAMALI power generation system has growth of electricity demand and GDP as 7.6% and 6% respectively, therefore, represented by elasticity as 1.27.
Considering the growth of gross domestic product, as an economic development indicator, and total population in JAMALI region remains constantly increase by 6.2% and 0.7%, the electricity demand for Industry, commercial, residential and public are determined by characteristics as below:
a. Industry Electricity Demand
Electricity demand in Industrial sector is determined by several factors, such as political stability, enhancement
of investment climate and policy, as well as the infrastructure improvement and availibility. In 2010, current status of electricity demand in Industrial sector is 49.292 GWh, with 41.571 consumers, corresponding to 1.185 of energy intensity [11]. Gradually increasing of electricity demands since 2000 by totally 26% indicates better investment climate and advancement has been significantly promoted in Indonesia [7]. In this work, 9% and 5% is determined as the annual growth rate of electricity demand and total consumers for the projection, as coincided with electricity supply general planning 2010-2019 [11].
b. Commercial Electricity Demand
Commercial sector consumers use their electricity in business activities such as services and hospitality, banking industry, export import business, firms, stowage business, law firms, and other commercial business, as determined by International standard industrial classification of all economics activities [12].
Current status of electricity demand in this sector is 18.997 GWh, with 1.196.508 consumers in the year 2010. In this work, the annual growth rate of commercial electricity demand and total consumers are determined by 9.5% and 6% respectively.
c. Residential Electricity Demand
Residential sector is the second largest consumer in Indonesian power sector, with reaching by 40.69 GWh of total electricity consumed and 26.633.702 of total consumers. In this work, the annual growth rate of residential electricity demand and total consumers are determined by 9% and 5% respectively.
d. Public Electricity Demand
Public electricity demand corresponds to electricity used by public facility, such as street lighting, worship place, traffic light, etc. In 2010, the total electricity consumed in by this sector is 6340 GWh, with 582.625 consumers located in JAMALI region. This work determines 10% and 7% as the annual growth rate of electricity demand and total consumers.
3. Fosil Fuel
As previously described, fossil fuels are still used as 21% from total power generating capacity in JAMALI, Indonesia, which are dominantly used as Diesel and Marine Fuel Oil (MFO). Figure 2 shows the evolution of fossil fuel, indicating the trend by the year 2019 [11]. Therefore, as previously described this work focuses on natural gas power generations which still consume fossil fuel in their service, while several steam power generations also include in this category.
4. Emission Factor
In order to estimate the environmental loading associated to the trend scenario it is necessary to assign emission factors resulting from the combustion of fossil fuel. This work examines Carbon Dioxide (CO2), Carbon
Monoxide (CO), Sulfur Dioxide (SO2), Nitrogen Oxides
(NOx), Particulate Matter (PM10), and Volatile Organic
Compounds (VOCs) emissions generated under this scenario.
Currently, there are several methods officially published to calculate emission from electricity and power generation. Table 4 shows emission factors used to estimate the environmental loading under trend scenario. Emission factors of CO2, CO, SO2, NOx, PM10
IPCC inventory [13-14] and a measured direct emission for fossil fuel power generation in Indonesia [15].
Thus, the LEAP software model calculates resulting emissions by multiplying emission factors of each pollutant by the total annual consumption of fossil oil. B. Construction of Alternative Scenario
The alternative scenario identifies the main variables that determine palm biodiesel use when taking into account aspects related to biodiesel production and potential resource. This scenario consider the same evolution in JAMALI power generation system, and aims at identifying the main parameters related to the substitution of fossil oil, mainly diesel and marine fuel oil, coinciding with the frame of policy on promotion of the biofuel and renewable energy in Indonesia.
Thus the alternative scenario considers the use of palm biodiesel from 2013 until 2035 in JAMALI power generation sector. Finally it is assumed that all requirements such as plantations and infrastructure for production and distribution of biodiesel have been developed at national level during the analyzed period. This works consider that biodiesel is produced in plants with a capacity of 2.647.570 KL/year [16-18].
1. Emission Reduction Factor
Palm biodiesel has been promising alternative fuel in power generation sector, especially for gas turbine, as described in previous section. Unlike automobile system, biodiesel combustion process creates mainly lower emission for Sulfur Oxides (SOx)and Nitrogen Oxides
(NOx). As previously described, biodiesel has low level
of sulfur in its physical properties, creating evidence that it produces less Sulfur Dioxide during combustion process. The NOx emission level for palm biodiesel is
lower than that diesel fuel at the same fuel atomizing pressure and SMD. SMD, which stands for Sauter Mean Diameter is a function of the atomizing pressure and volumetric fuel flow rate. Decreasing a SMD reduces NOx emission since fuel kinematic viscosity also
reduces. Lower fuel kinematic viscosity of palm biodiesel cause NOx emission level decrease even under
constant-fuel-flow rate and constant air-flow-rate condition [19]. Other factor may lead that biodiesel produce less NOx emission is the typical process of fuel
combustion in power generation is the lean flame combustion process, also 10% higher content of oxygen in biodiesel create reverse effect because of the presence of oxygen in the FAME molecule that increase the actual oxygen/fuel ratio in the flame front [1]. In combustion process of gas turbine, adiabatic flame temperature is prominent factor affecting NOx emissions in a gas
turbine, representing the highest temperature that a combustion process can produce for a specific mixture whatever the combustion device. Diesel fuels tend to generate the highest temperatures, natural gas the lowest and biodiesel lies in-between [20]. Biodiesel exhibits higher modulus compressibility than diesel oil which causes an advance injection timing and an earlier start of combustion as compared with diesel oil. Gas turbines have a permanent fuel injection process and are exempt of this effect [19-24]
In term of Carbon Dioxide emission, biodiesel produces higher amount of CO2 released since it requires
higher fuel consumption since it has lower heating value [25]. For Carbon Monoxide (CO), biodiesel produce
similar amount of CO compared to diesel fuel [1]. However, the emission level is considered lower than diesel fuel since biodiesel has oxygen but no aromatic ring in the molecule, therefore, the effect of combustion is less generation of Polyaromatic Hydrocarbons (PAH), soot, Particulate Matter (PM), and CO [24].
Finally, Table 5 shows the structure of emission reduction in application of biodiesel in power generation sector, based on data biodiesel field by GE energy research group and similar field and laboratory tests performed during the last five years [1, 19, 21-23]. 2. Externality Factor
The previously emission discussed is a measured or direct emission factor, caused by power generation system. Another impact is externality factor, which refers to the impact pathway approach tackles issues such as the exposure-response functions; especially health impacts from air pollution, the monetary valuation of these impacts (“value of statistical life”), accidents in the whole energy supply chain, and the assessment of other impacts like global warming, acidification and eutrophication [26]. Those factors then converts to potential monetary unit that needed to recover the system, then called in this work as external cost.
a. Climate Damage
The major global warming potential that comes from power generation is the carbon dioxide emission. The external cost of the carbon dioxide emissions associated with a particular generation technology, in terms of a unit of power generated is given by [27]:
The unit external cost is adopted from ExternE, having value of euro 19 per tonnes of carbon dioxide, which will be consistently used in this work. The exchange rate adopted for this work is Euro 1 = USD 1.4, respectively. b. CO Emission
Carbon Monoxide (CO) is a colorless, odorless gas emitted from combustion processes. CO can cause harmful health effects by reducing oxygen delivery to the body's organs (like the heart and brain) and tissues. At extremely high levels, CO can cause death. The external cost of the carbon dioxide emissions associated with a particular generation technology, in terms of a unit of power generated is given by [27]:
used in this work is 1.06 euro per kg of carbon monoxide [28].
c. SO2 Emission
significantly reduce the acid rain potential, preserve the nature as well.
The external cost of the carbon dioxide emissions associated with a particular generation technology, in terms of a unit of power generated is given by [27],
in this work is 6 euro per kg of sulfur dioxide [26-27]. d. NOx emission
Nitrogen oxides cause a wide variety of health and environmental impacts because of various compounds and derivatives in the NOx family, including nitrogen
dioxide, nitric acid, nitrous oxide, nitrates, and nitric oxide. NOx is formed when fuel is burnt at high
temperature, especially in combustion process. Small particles can deep into sensitive parts of the lungs and can cause respiratory diseases, such as emphysema and bronchitis, and aggravate existing heart disease [29]. Since NOx emission is considered having the highest
level of global warming potential for given time horizon, approximately 289 higher than that of CO2, it is
necessary to develop various advance technology in order to reduce its effect to the environment [27].
The external cost of the nitrogen oxides emissions associated with a particular generation technology, in terms of a unit of power generated is given by:
The unit external cost of nitrogen oxides emission used in this work is 5 euro per kg of nitrogen oxides [26-27]. e. PM10 emission
Particulate Matter 10 (PM10) consists of particles with
less than 10 micrometers in size. Cummulative PM10
emission can effect on lungs disease, premature death, and leading to aggravated asthma. Particulate matter can be directly emitted or can be formed in the atmosphere when gaseous pollutants such as SO2 and NOx react to
form fine particles. The external cost of the PM10
emissions associated with a particular generation technology, in terms of a unit of power generated is
The unit external cost PM10 emission used in this work is
25 euro per kg of particulate matter [26-27]. f. VOCs emission
Volatile Organic Compounds (VOCs) are emitted as gases from certain solids or liquids. VOCs include a variety of chemicals, some of which may have short- and long-term adverse health effects. Cumulative VOCs emission can lead Eye, nose, and throat irritation; headaches, loss of coordination, nausea, damage to liver, kidney, and central nervous system. The external cost of the PM10 emissions associated with a particular
generation technology, in terms of a unit of power generated is given by :
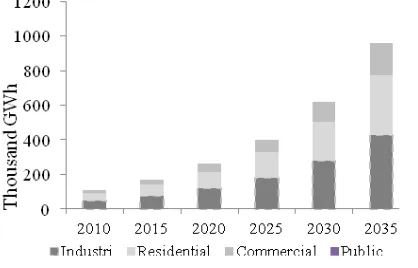
according to the estimated average annual growth rate of electricity demand for each consumer category.
As it observed, the industrial consumers require more electricity to support their operation compared with other consumer, followed by residential, commercial, and public consumer. The total electricity requirements until the last period of analysis is 10.294 thousand GWh, corresponding to 44.7% of industrial, 36.7% of residential, 18.6% of commercial and 0.01% of public consumer. At one point in time, by the year of 2035 the industrial, residential, commercial, and public consumers require 425, 349, 183.7, and 0.02 thousand GWh respectively. These indicate that the industrial activity has prominant role in economics development.
2. Emission Reduction
Utilization of biodiesel in power sector can reduce pollutant emissions, GHG contributors such as CO2, CO,
SO2, NOx, PM10, and VOCs. Figure 4 shows the amount
of CO2 pollutants emitted in both scenario. Direct CO2
emission would be increased by 172.3 million tonnes in the alternative scenario. This increase would also account 2.6% of these emissions. This result is contributed by biodiesel properties which has lower calorific value than that of diesel fuel, leading to higher fuel consumption during the combustion process of power generation, as described in previous section.
Figure 5 shows the emission reduction of CO. As previously described, since biodiesel has oxygen but no aromatic ring, the combustion process produces less soot and blue flame region than diesel fuel. Corresponding to this, in the alternative scenario the process can avoid 0.27 million tonnes CO emitted to the environment, accounting for 2.4% of these emissions respectively.
Figure 6 shows the emission reduction of NOx. This
pollutant, as previously described, can be presence in the atmosphere and has global warming potential by 289 higher than that of CO2. In the alternative scenario it can
be observed that the pollutants emitted would be reduced toward the end of analysis period by 0.17 million tonnes by 2035. This reduction would also account for 2.4% in relation to those emissions of trend scenario.
For SO2 emission, Figure 7 describe the emission
reduction of SO2. Since biodiesel has no sulfur content in
its properties, the biodiesel produces less amount of this pollutant. The reduction is approximately 3.6 million tonnes, indicating of 11.6% potential reduction of this pollutant. Compared to other result, the percent share indicates this emission reduction results the most prominant reduction effect in this work respectively.
Figure 8 shows the emission reduction on Particulate Matter (PM10). During the analyzed period this reduction
those emissions of trend scenario. PM10 can cause form
varnish deposit and sediments, in the combustion chamber. Usually to reduce its potential, some newer engines are equipped with filters that capture particles as small 2 µm to 10 µm [25].
Figure 9 shows the emission reduction on VOCs that may present during the combustion process. Most VOCs are very short lived in the atmosphere with 10-11 years. VOCs are also considered have been included in the CO2
calculation, in term of Global Warming Potential (GWP) [13]. Regarding to this, the alternative scenario can reduce the VOCs emission by 0.09 million ton by 2035, accounted for 10.7% in relation to those emissions of trend scenario. This percent share indicates the VOCs emission reduction results the second most prominent pollutant can be reduced in this work.
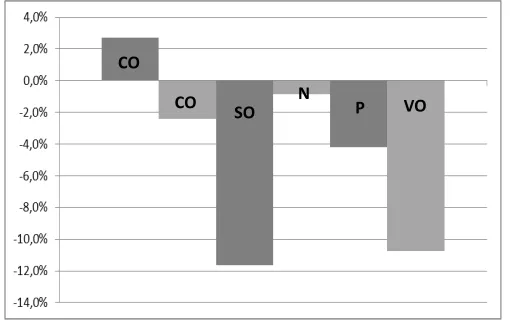
Finally, we can depict Figure 10 as below, showing the avoided and generated emission potential by addressing palm biodiesel in the power generation sector in Indonesia, JAMALI electricity system.
3. Externality Analysis
From emission analysis, it can be observed that applying palm biodiesel in the Indonesian power generation sector will reduce emissions to the environment. Current Indonesian power generation system still consume fossil fuel for generating electricity, especially power plants which are designed to be fuelled by cleaner and more environmental friendly fuel, like natural gas, however, in practice it still uses fossil fuel to generate the power since lack of natural gas. Therefore it enhances direct emissions to the air which cumulatively the emission can cause potential deterioration on human health, building, ecosystem, and other life aspects.
Thus converting the external effects into monetary units results in external causes, which is described in Figure 11.
As it observed, the utilization of biodiesel in the power sector can reduce the emission, as well as avoid external cost, which is then called mitigation cost in this work. Therefore, the mitigation cost can be an indicator of the long term horizon effect, both in environmental and economics perspective.
This work results that utilization of biodiesel in power generation can produce total mitigation cost as 43 billion USD within the analyzed period, corresponding to 0.3 billion USD from CO emission reduction, 30.8 billion USD from SO2 emission reduction, 1.2 billion USD from
NOx emission reduction, 15.1 billion USD from PM10
emission reduction, and 0.1 billion USD from VOCs emission reduction.
The only one reverse result is CO2 emission, which has
higher value than other GHG contributing emissions. As previously described, since biodiesel has lower HHVs then it requires higher fuel consumption during the
Therefore, in order to meet each scenario’s demand for biodiesel, it is necessary to determine the required biomass resource. In tropical region, like Malaysia and
Indonesia, current yield of this type of plantation is approximately 5,000 L/ha [31].
Figure 13 shows resource requirements in million of cultivated hectares as well as the corresponding ratio of projected production volume compared with current biodiesel capacity.
As it can be observed, it is required approximately 60 million hectares of cultivated area to satisfy the biodiesel demand. Compared to current oil palm area, approximately 8.1 million hectares [32], the total land required is approximately 7 times larger, which is to be unlikely the intent.
However, in technology advancement, it is necessary to invent the latest technology of biodiesel production by using other potential sources in oil palm, such as sludge oil and waste cooking palm oil, which has amount of more than 16.7 million ton in 2010 [33]. Therefore, in
order to meet each scenario’s demand for biodiesel, by collaboratively incorporating those sources, creating the production capacity which has 7 times higher than that of the current production capacity could be feasible.
These result indicate that the implementation of the alternative biodiesel scenario would be feasible in order to meet with palm oil-based biodiesel demand in the Indonesian power generation sector.
With regard to job creation, the cultivation of oil palm may lead to the creation of about 60 million direct jobs in the alternative scenario. These results are based on the assumption that a crop hectare creates 1 direct job in the agricultural and industrial sector, respectively [34]. 5. Cost-Benefit Analysis
In biodiesel production, it is estimated that the cost of biodiesel production is majority contributed by feedstock cost, accounted 77–88% of the total production cost. When the feedstock cost is USD 0.52/kg, the estimated biodiesel production cost is USD 0.53/lt [17]. Even some economics factors were excluded, such as internal rate of return, economic life span, corporate tax rate, salvage value, debt fracture, construction interest rate and long term interest rate, working capital, environment control equipment, marketing and distribution expenses, the cost of capital, and the existence of government credits or subsidies, the feedstock creates biodiesel selling price much higher than diesel fuel, as depicted in Figure 14 [35,18].
In order to overcome this situation, nowadays manufacturers are trying to use low-cost feedstock to develop biodiesel which brings more economical benefits, such as animal fats and waste cooking oil. The waste cooking oil based biodiesel has gained highly attention not only it can highly reduce the production cost but also it is widely available and easily obtained through out the countries. Another prominent advantage of using waste cooking oil as feedstock of biodiesel is its exemption of the dilemma between food and fuel controversy issue, reducing the environmental contamination as well. Table 6 shows the estimated waste cooking oil produced in selected countries.
Based on the table above, waste cooking oil generated is more than 18 million tonnes, which can give a picture that the actual amount of waste oil produced is much higher based on global production.
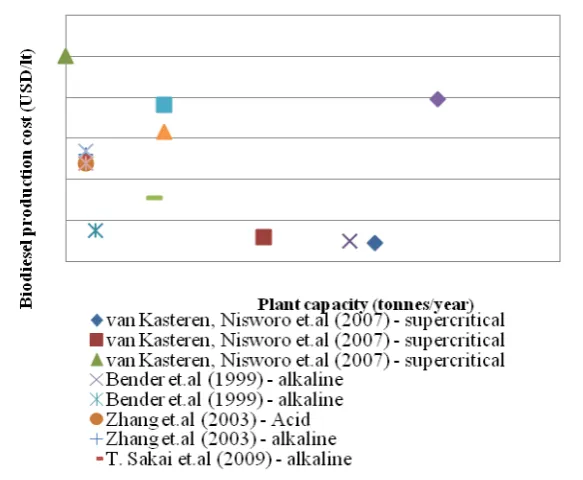
operating conditions, however, it can be concluded that plant capacity is important factor affecting production process. In addition, the technological option is another important factor to consider in production process. Figure 15 shows the recent progress of biodiesel researches, presenting the total production cost per liter for each size of plant with selected technological option.
It can be observed that the higher plant capacity of biodiesel production will generally tend to the lower cost of biodiesel production, with some consideration in the technological process.
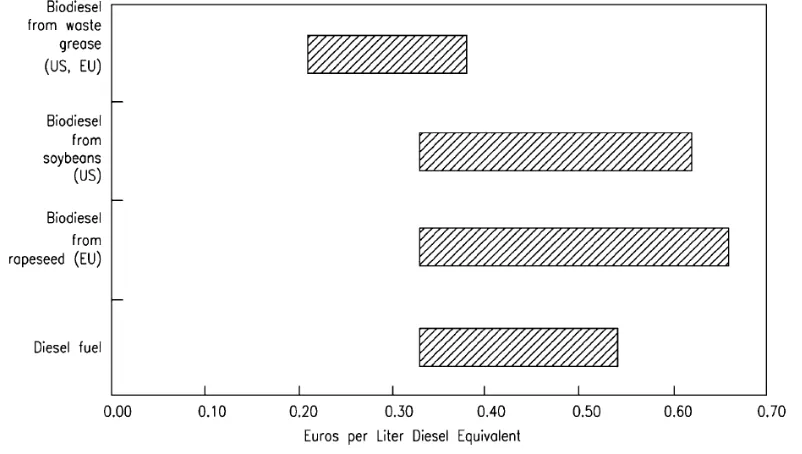
Apart from that, a recent study on waste cooking oil based biodiesel results that the overall production costs of biodiesel can be reduced by more than half compared to virgin vegetable oil. Furthermore, the production costs are even lower than fossil derived diesel as ilustrated in Figure 16 [35].
Finally, Table 7 shows the structure of production costs used in this work, which refers to the calculation from [31] for the plant capacity of 7.260 tonnes per year. In fact, several studies described the biodiesel production cost, however, the process selected in this study only utilizes alkaline transesterification process and uses caustic potassium as catalyst, which is commercially implemented in biodiesel refineries nowadays. This process is commonly used in the industries due to several reasons: i) able to catalyze reaction at low reaction temperature and atmorpheric pressure; ii) high conversion can be achieved in a minimal time; iii) widely available and economical, and iv) the rate for base-catalyzed reaction would be 4.000 times faster compared to acidic catalyst. However, the use of this process is limited only for refined vegetable oil with less than 0.5 wt% FFA or acid value less than 1 mg KOH/g [21]. In addition, T. Sakai et al. estimation is nearly close to the investment turnover of chemical industries, which is about 1.0; indicating the estimation of the fixed costs and the plant costs appears to be more realistic [31].
It should be noted that the estimation above still refers to basis of the price quoted by several engineering firms in Japan, especially for equipment specification. However, the result obtained, accounted as 0.415 USD/lt (0.8745 kg/lt of density), can give higher level of confidence that the biodiesel production cost may still be lower in case of the estimation uses all local prices in calculation. Furthermore, it is clearly observed that biodiesel production cost in Indonesia is still competitive compared to the diesel fuel, which is accounted as USD 0.5/liter using exchange rate of 9.000 Rp per USD [37]. It should be noted that the price still refers to the subsidized price and the biodiesel price is still exempt from the implementation of tax policy which is generally needed in biodiesel production practice [38]. Therefore, the price clearly gives picture that the actual or economical price of diesel fuel is still much higher so that the cost–benefit analysis regarding to biodiesel production cost obtained in this study is feasible, corresponding to biodiesel prospect in industrial practice in Indonesia.
IV. CONCLUSION
The result obtained in this work indicates that oil palm resources, under the assumption of a good resource potential, are more than enough to cover the needs of the alternative scenario, which is introducing palm biodiesel in the power generation sector from present to 2035.
During the entire period of analysis, cumulative emissions reductions would total 11.6% and 10.7% for Sulfur Dioxide and VOCs respectively. Total Particulate Matter would be reduced by 4.2%, while Carbon Monoxide and Nitrogen Oxides emission reduction would total 2.4% and 0.8% in relation to the trend scenario respectively.
In contrast, biodiesel use would lead to an increase of 2.6% in CO2 emission, which requires further
investigation on economics perspective. However, biodiesel is renewable source and can continuously be generated and developed through technology advancement.
External cost, considerably derived from fossil fuel use in the Indonesian power generation sector can be eliminated by addressing biodiesel in the alternative scenario, and would reach cumulative reductions of 43 billion USD, contributing from 71.7% SO2, 35.1% PM10,
2.8% NOx, 0.6% CO, and 0.3% VOCs.
The substitution of the fossil fuel for palm oil-based biodiesel can only be sustainable and feasible when production capacity rate reaches 7 times higher than that of current production capacity, which is to be unlikely the intent. The several technological advancement consequently needs to cover it, including the utilization of the low-cost feedstock for biodiesel production.
Finally, the cost-benefit analysis estimates that biodiesel cost can be competitive with the diesel fuel, where the biodiesel production cost highly subjects to plant capacity, technology choice, and utilization of low-cost feedstock such as waste cooking oil. The result obtained indicates that the substitution of diesel fuel for palm biodiesel derived from waste cooking oil is feasible to develop in Indonesian industrial practice, even without implementation of tax policy.
AKNOWLEDGEMENT
Figure1. Power generation configuration in JAMALI, 2009.
Source: own determination of total capacity based on data from electricity supply general planning 2010-2019 [37]
Figure 2. Evolution of fossil fuel consumption in JAMALI power generation system
Source: data from [37]
Figure 3. Electricity demand in the JAMALI electricity system, Indonesia
Source: own calculations based on data electricity supply general planning 2010-2019 [37]
Figure 4. CO2 emission under the trend and alternative scenario in the Indonesian power generation sector, JAMALI region
Figure 5. CO emission under the trend and alternative scenario in the Indonesian power generation sector, JAMALI region
Figure 6. NOx emission under the trend and alternative scenario in the Indonesian power generation sector, JAMALI region
Figure 7. SO2 emission under the trend and alternative scenario in the Indonesian power generation sector, JAMALI region
Figure 8. PM10 emission under the trend and alternative scenario in the Indonesian power generation sector, JAMALI region
Figure 9. VOCs emission under the trend and alternative scenario in the Indonesian power generation sector, JAMALI region
Figure 10. Avoided and generated emissions under biodiesel alternative scenario.
CO
2
CO SO
N
Figure 11. External and mitigation cost under the trend and alternative scenario in JAMALI power generation sector within 2010-2035
Figure 12. External costdispatched in 5 year increment
Figure 13. Land requirement for oil palm plantation in Indonesia Figure 14. The contributing effect of oil feedstock to the biodiesel production cost for fresh vegetable oil
Figure 16. Range of the production costs for biodiesel and diesel in year of 2006
TABLE 1.
POWER GENERATION CLASSIFICATION IN JAMALI
Type Description
Coal fired steam power plant The generation of electricity uses steam to rotate the turbine in order to produce electricity. The coal is used as the fuel to produce steam in a boiler.
Oil fired steam power plant This plant uses oil as fuel to generate steam to rotate the turbine. The steam generation takes place inside of a boiler.
Natural gas combined cycle power plant
The process of this power plant is using natural gas to produce heat and rotate the gas turbine, and the remaining heat, which is around 550oC exhausted from gas turbine is utilized to produce steam through Heat Recovery Steam Generating (HRSG) unit and rotate the steam turbine, similar process with steam power plant with using boiler in its process.
Diesel oil combined cycle power plant
This plant use oil to generate heat to rotate the gas turbine and steam to rotate the steam turbine, similar process with steam power plant.
Gas turbine (natural gas) power plant; The process of this plant is using natural gas to produce heat and rotate the gas turbine. Gas turbine (diesel) power plant The process of this plant is using diesel oil to produce heat and rotate the gas turbine.
Diesel power plant A diesel engine coupled with a generator is used to convert mechanical energy to electrical energy. Geothermal power plant This type of power plant is using geothermal resource to produce steam and rotate the steam
turbine.
Hydro power plant Water is used to generate electricity by rotating the turbine through mechanical work.
TABLE 2.
DISPATCH OF POWER PLANT
Type of power plant Merit order
Coal-steam 1
Geothermal 1
Hydro 1
Gas turbine (gas) 2 Gas turbine (diesel) 3 Combined cycle (gas) 1
TABLE 3.
PROPERTIES OF PALM BIODIESEL COMPARED TO DIESEL,BIODIESEL STANDARDS AND OTHER VEGETABLE OIL
FUEL Diesel Oil (ASTM D9975-04c)
Biodiesel Standard (ASTM D 6751-O3a)
Palm Biodiesel (PME) [22, 25]
Safflower Methyl Ester [26]
Flash point ≥ 52oC ≥ 130oC 174 -
Sediment & water* < 0.05 % w < 0.05 % w 0.01 288 ppm
Distillation 90%: 282-338oC 90%: <360oC 353 -
Viscosity (cSt) 1.9 – 4.1 1.9 – 6 4.5-5.5 4.1
Density @15oC - - 0.8745 0.89
Ester content - - 98.8 97.8
Ash < 0.01 % w < 0.02 % w (sulfated) 0.002 (sulfated) -
Sulfur (ppm w)
15; 500; 5000 15; 500 <0.0001 -
Carbon residue (% mass) - ≤ 0.05 (max. 0.05) <0.01 -
CFPP Regional Report 12.5 -7.5oC
TABLE 4.
IMPLIED EMISSION FACTORS FROM ELECTRICITY AND POWER GENERATION (KG/KWH)
Power Plant CO2 CO SO2 NOx PM10 VOCs
Coal fired steam 0.335 7.19 x 10⁻⁵ 0.0019 0.00108 6.69 x 10⁻⁴ 1.79 x 10⁻⁵ Oil fired steam 0.276 5.39 x 10⁻⁵ 0.0117 7.2 x 10⁻⁴ 2.88 x 10⁻⁴ 9.4 x 10⁻⁵ Oil combined cycle 0.261 5.4 x 10⁻⁵ 7.15 x 10⁻⁴ 7.2 x 10⁻⁴ 5.78 x 10⁻⁵ 8.07 x 10⁻⁵ Natural gas combined cycle 0.201 7.19 x 10⁻⁵ Negligible 5.4 x 10⁻⁴ Negligible 1.08 x 10⁻⁴ (Natural gas) Gas turbine 0.201 7.2 x 10⁻⁵ Negligible 5.4 x 10⁻⁴ Negligible 2.81 x 10⁻⁴ (Diesel) Gas turbine 0.261 5.4 x 10⁻⁵ 7.16 x 10⁻⁴ 7.2 x 10⁻⁴ 1.04 x 10⁻⁴ 2.45 x 10⁻⁴ Diesel generate 0.261 1.25 x 10⁻³ 2.01 x 10⁻³ 4.68 x 10⁻³ 3.24 x 10⁻⁴ 4.68 x 10⁻⁴
TABLE 5.
EMISSION REDUCTION FACTORS
Emission Palm biodiesel (B100)
Carbon Dioxide (CO2) +6% Carbon Monoxide (CO) < 2 ppm
Sulfur Dioxide (SO2) < 1 ppm Nitrogen Oxide (NOx) -2 to -9% Particulate Matter (PM10) Trace Volatile Organic Compounds (VOCs) < 2 ppm
TABLE 6.
QUANTITY OF WASTE COOKING OIL IN SELECTED COUNTRIES
Country Quantity (million tonnes/year) United States 10.0
China 4.5
Indonesiaa 3.24
European 0.7 – 1.0 Japan 0.45 – 0.57
Malaysia 0.5
Canada 0.12
Taiwan 0.07
a
TABLE 7.
ESTIMATED PRODUCTION COST FOR BIODIESEL PRODUCTION FROM WCO USING ALKALINE PROCESS IN INDONESIA, CAPASITY 7.260TON/YEAR
Description Unit price Volume USD/ton Raw materials Electric power4) 0.0867 USD/kWh 4400 kWh/day 17.3 Depreciation 9% 6481818 USD/year 80.4
Repair 3% 26.8
Interest & tax 3% 26.8
Personnel 5) USD 4668/year/person 8 persons 5.1
Total production cost 475.4
REFERENCES
[1] M. Moliere, E. Panarotto, M. Aboujaib, and J. M. Bisseaud,
“Gas turbines in alternative fuel applications: biodiesel field test.” presented in ASME Turbo Expo, 2007.
[2] J. F. Schornick, R. T. Farr, and J. K.DiCampli, “Liquid biofuels in the aeroderivatives gas turbine.” GE Energy Aero Energy Division.Available:http://www.worldenergy.org/documents/con gresspapers/119.pdf[June, 2011].
[3] International Energy Agency (IEA). “Technological Roadmap Biofuel for Transport,” Available: http://www.iea.org2010, 2010 [April, 2011].
[4] European Biodiesel Board (EBB). “Biodiesel Production Statistics; 2010.” Available:http://www.ebb-eu.org/stats.php, 2010 [ September 2011].
[5] National Biodiesel Board (NBB). Available:http://www.biodie sel.org/pdf._files/fuelfactsheets/Production_Graph_Slide.pdf, 2010 [ September, 2011].
[6] A. Zhou and E. Thomson, “The development of Biofuels in Asia.”Journal Applied Energy. S11-S20, 2009.
[7] The Ministry of Energy and Mineral Resources, “Handbook of energy and economics statistics of Indonesia 2010,” Available: http://prokum.esdm.go.id/Publikasi/Handbook%20of%20Energy %20&%20Economic%20Statistics%20of%20Indonesia%20/Ha ndbook%202010.pdf,2010 [ August 2011].
[8] US EPA. “Draft: Global non anthropogenic non-CO2 greenhouse gas emissions: 1990-2030,” Available: http://www.epa.gov/
[10] The Ministry of Energy and Mineral Resources. “Key indicator of Indonesia energy and mineral resources.” Center for data and information on energy and mineral resources 2008. Available: http://www.esdm.go.id/publikasi/key-indicator-of-indonesia-emr.html, 2008 [ August 2011].
[11] Indonesian State Electricity Company (PLN). “Rancangan umum penyediaan tenaga listrik (RUPTL) 2010-2019.” Indonesian State Electricity Company, 2010.
[12] Indonesian State Electricity Company (PLN). “Annual Report PLN 2010.” Available:http://www.pln.co.id, 2010 [September 2011].
[13] Intergovernmental Panel on Climate change (IPCC). “2006 IPCC guidelines for national greenhouse gas inventories.” Available:http://www.ipcc-nggip.iges.or.jp/public/2006gl/index. html, 2006 [ September 2011].
[14] IEA Statistics. “CO2 emission from fuel combustion.” Available: http://www.iea.org/co2highlights/co2highlights.pdf,2011[Octo ber 2011].
[15] A. Widiyanto, S. Kato, and N. Maruyama, “Environmental impact analysis of Indonesian electric generation systems (development of a life cycle inventory of Indonesian electricity),”J. JSME International no. 46, pp. 650-659, 2003. [16] The Ministry of Energy and Mineral Resources. “Indonesian
renewable energy statistics; 2005-2010.” Available:http://www. esdm.go.id/publikasi/statistic/cat_view/58-publikasi/240-statis tik/355-energi-baru-terbarukan.html, 2010 [ September 2011].
[17] W. Sumaryono and U. Priyanto, “Progress on biofuel and biomass utilization in Indonesia.” Presented on 5th Biomass-Asia Workshop, Guangzhou Institute of Energy Conversion, Chinese Academy of Sciences, in Cooperation with the Biomass-Asia Research Consortium-AIST-Japan, Guangzhou-China, Dec 4-6, 2008. Agency for the Assessment and Application of Technology (BPPT); 2008.
[18] M. J. Haas, A. McAloon, W.Yee, and T. Foglia, “A process model to estimate biodiesel production costs.” J. Bioresource technology, no.97, pp.671-678, 2006.
[19] N. Hashimoto, Y. Ozawa, N. Mori, I. Yuri, and T. Hisamatu,
“Fundamental combustion characteristics of palm methyl ester (PME) as alternative fuel for gas turbines,”J. Fuel, pp.3373-3378, 2008.
[20] P. A.Glaude, R. Fournet, R. Bounaceur, and M. Moliere,
“Adiabatic flame temperature from biofuels and fossil fuels and derived effect on NOX emissions,” J. Fuel processing
technology, no.91, 229-235, 2010.
[21] J. F. Schornick, R.T. Farr, and J. K. DiCampli, “Liquid biofuels in the aeroderivative gas turbine.” General Electric Report, Houston, Texas, USA. Available:http://www.worldenergy. org/documents/congresspapers/119.pdf [ June 2011].
[22] A. Campbell, J. Goldmeer, T. Healy, M. Moliere, and R. Washam, Citeno, “Heavy duty gas turbines fuel flexibility”, in Proceeding of ASME Turbo Expo 2008: Power for land, sea and air, Berlin, Germany, 2008.
[23] S. Rahm, J. Goldmeer, M. Moliere, and A. Eranki, “Addressing gas turbine fuel flexibility.” Presented paper at the Power-gen middle east conference, Bahrain, GE Energy, 2009.
[24] M. Moliere, “Stationary gas turbines and primary energies: a review of fuel influence on energy and combustion performance,”J. Int. Thermal science no.39, pp.141-172, 2000. [25] J.V. Gerpen and G. Knothe, The basics of diesel engines and
diesel fuels. The Biodiesel Handbook. AOCS press; 2005. [26] P., Bickel and R. Friedrich, “Externalities of Energy Methodology
2005 Update.” Directorate General for Research Sustainable energy system. University of Stutgart. European Commision Community Research. Germany, Available:http://www.externe. ,2005 [September 2011].
[27] M.E. Wijaya and B. Limmeechokchai, “The hidden costs of fossil power generation in Indonesia: A reduction approach through low carbon society,”J. Sci. Technology,pp. 81-89, 2010. [28] I. F. Roth and L. L. Ambs,“Incorporating externalities into a full cost approach to electric power generation life-cycle costing,” J. Energy no.29, pp. 2125-2144, 2004.
[29] EPA. “NOX: How nitrogen oxides affect the way we live and breathe.” Environmental Protection Agency, United States. Available:http://www.epa.gov/air/urbanair/npx/noxfldr. pdf [ Au gust 2011].
=com_content&view=article&id=171&Itemid=270,2011, [January 2012].
[33] P.D.Wahyuniarti,“Tinjauan pasar minyak goreng. Oil commodity special group report.” The Ministry of Commerce. Indonesia,Available:http://ews.kemendag.go.id/ews2/Sangkurian g/Publikasi/dokumen/01%20Weekly%20Report%20Migor%20J an%202011.pdf, 2011, [September 2011].
[34] S. Rahayu, L. Nagib, Sumono, and D. Asiati, Perkembangan perkebunan kelapa sawit dan penyerapan tenaga kerja di kabupaten pasir provinsi Kalimantan Timur. Population research center, Indonesian Institute of Science (LIPI); 2007.
[35] L. K. Man., L. T. Keat, and M. A. Rahman, “Homogenous, heterogeneous and enzymatic catalysis for transesterification of high free fatty acid oil (waste cooking oil) to biodiesel: A review,” J. Biotechnology advances, no.28, pp. 500-518, 2010.
[36] T. Sakai, A. Kawashima, and T. Koshikawa. “Economic assessment of batch biodiesel production process using homogenous and heterogeneous alkali catalyst,”J. Bioresource technology no.100, pp. 3268-3276, 2009.
[37] United States Department of Agriculture. “Indonesia: palm oil production prospects continue to grow.” Foreign Agricultural Service. United States Department of Agriculture (USDA); 2007. Available: http://www.pecad.fas.usda.gov/highlights/2007/ 12/Indonesia_palmoil/, 2007 [ September 2011].