The Influence of Capital Structure, Liquidity, Asset Structure
,
and
Asset Turnover to the Financial Performance of the Consumer
Industry Sector In IDX
Neti Rukma Rahayu1),Siti Nurlaela2), Kartika Hendra Titisari3) 1), 2), 3)
Accounting Study Program, Faculty of Economics, Islamic University of Batik Surakarta
1)
Abstract: The capital market industry is undergoing rapid growth. The company in carrying out its operational activities, requires a large capital. To be able to obtain funds easily, of course, the company must be in a healthy financial condition. This healthy condition is reflected in the company's financial performance. The newness of this research is to conduct empirical test about the effect of capital structure, liquidity, asset structure and asset turnover to financial performance of consumer industry sector in Indonesia Stock Exchange year 2014-2016. The difference with previous research lies in the use of independent variables, the number of samples used and the study period. This research is a quantitative research. The method of analysis in this research is multiple linear regression analysis. Partial test result (t test) shows that the variable of capital structure (DER), liquidity (CR), and asset turnover (TATO) have significant effect to financial performance (ROA). While the asset structure variable (FATA) has no significant effect on financial performance (ROA).
Keyword: ROA, DER, CR, FATA, TATO
1. INTRODUCTION
The development of the capital market industry experienced a rapid development both from the growth of composite stock price index (JCI), market capitalization, the number of issuers or the number of investors of the capital market. Figure 1 presents the development of stock prices in 5 ASEAN countries in 2011 up to October 2017.
Source: OJK (2017)
Figure 1. Graph of Development of Stock Prices in 5 ASEAN Countries
The consumption industry sector is the industry's provider of community needs. Trading of stock price of consumer industry sector in 2017 with average volume 439,86 millions with value 589,95 millions rupiah with period turn over 22,14 times. Kapatalisasi market consumption industry sector in 2017 with the value of 1.426.822.476.816.590 rupiah with a percentage of 21.58% (Financial Services Authority, 2017). Consumer sector companies in carrying out operational activities, require a large capital. To be able to obtain funds easily the company must be in a healthy financial condition. This healthy condition is reflected in the company's financial performance.
This study aims to perform empirical tests on the influence of financial ratios on financial performance. Melawati & Nurlaela (2016), stated that the performance of the company describes the financial condition of a
company using financial analysis tools, which reflects the performance of work within a certain period. Company's financial performance is measured using profitability ratio. Profitability ratios are a set of ratios showing the combined effects of liquidity, asset management, and debt on operating results (Brigham & Houston, 2006).
Mwangi & Birundu (2015) studies show that there is no significant relationship between capital structure and ROA in SMEs in Thika, Kenya. Sari, Subroto & Nurlaela (2016) stated that the composition of the board of commissioners, board size, institutional ownership have a significant effect on the company's financial performance, while audit committee variable and firm size have no significant effect to the company's financial performance. Larasati, Titisari & Nurlaela (2017) stated that Good Corporate Governance proxied through the proportion of independent board of commissioners and managerial ownership affects the financial performance of manufacturing companies in IDX, while Good Corporate Governance is proxied through the number of Directors, Institutional Ownership and Debt to Equity Ratio does not affect the financial performance of manufacturing companies listed on the IDX, Corporate Social Responsibility does not affect the financial performance of manufacturing companies listed on the Stock Exchange.
Murtadlo, Suja'i, & Wahono (2014) stated that capital structure and asset turnover have a significant effect on financial performance, while asset structure has no effect to financial performance. Pramesti, Wijayanti, & Nurlaela (2016) stated that the variables DER, TATO, and Firm Size have significant effect on ROA, while the CR variable has no effect on ROA.
The newness of this research is to conduct empirical test about the effect of capital structure, liquidity, asset structure, and asset turnover to the financial performance of the consumer industry sector listed on the Indonesia Stock Exchange 2014-2016. The difference with previous research lies in the use of independent variables, the number of samples used and the study period.
The Influence of Capital Structure on Financial Performance
Riyanto (2001) suggests the capital structure is a balance or comparison between foreign capital (long term) with own capital. Companies with more funding sources derived from their own capital than from debt capital of course have a small interest expense in amount, because the amount of loans from a source of funding.
performance as measured by ROA. The hypothesis to examine the effect of capital structure (debt to equity ratio) on financial performance (return on asset) is:
H1: The capital structure has significant effect to the financial performance of the consumer industry sector in Indonesia Stock Exchange
The Influence of Liquidity on Financial Performance
According Munawir (2002) current ratio is the ratio between the amount of current assets with current liabilities. This ratio shows that the value of current wealth (which can soon be made money) there are so many short-term debt. Demirgunes (2016) states that liquidity affects profitability. Iqbal, et al (2016) stated that liquidity has a positive correlation to financial performance. While Pramesti, Wijayanti, & Nurlaela (2016) stated that the independent variable current ratio (CR) has no effect on profitability (ROA). The hypothesis to examine the effect of liquidity (current ratio) on financial performance (return on assets) is:
H2: Liquidity has significant effects to the financial performance of the consumer industry sector in Indonesia Stock Exchange
The Influence of Asset Structure on Financial Performance
Syamsudin (2007) structure of the asset is the determination of how much the allocation of funds for each component assets, either in current assets or in fixed assets. Companies whose assets are suitable for credit guarantees tend to use more debt to finance corporate performance.Murtadlo, Suja'i & Wahono (2014) stated that the asset structure has no effect on profitability. Rahmiyatun & Nainggolan (2016) stated
that the asset structure (current assets to total aseets ratio) has a positive effect on profitability. Mwaniki & Omagwa (2017) stated that the asset structure has a significant relationship to the financial performance of the company. Al Ani (2014) states that overall asset structure does not have a strong impact on profitability. The hypothesis to test the effect of asset structure to total asset on financial performance (retrun on asset) is as follows:
H3: Asset structure has significant
effects to the financial
performance of the consumer industry sector in Indonesia Stock Exchange
The Influence of Asset Turnover on Financial Performance
Asset turnover (total asset turn over) is a ratio that measures how all the assets owned by the company is operated in support of the company's sales (Sitanggang, 2013). Murtadlo, Suja'i, & Wahono (2014) stated that asset turnover has a significant effect on profitability. Pramesti, Wijayanti, & Nurlaela (2016) showed that the total variable of asset turn over (TATO) partially has a positive effect on profitability (ROA). Hypothesis to test the effect of asset turnover to financial performance is as follows:
H4: Asset turnover significantly effects the financial performance of the consumer industry sector in the Indonesia Stock Exchange
2. METHOD
Stock Exchange during the period of study year 2014-2016, (2) Consumer sector companies listed on Indonesia Stock Exchange issuing financial statements and conducting audit (3) Consumer sector companies listed on the Indonesia Stock Exchange having periods of financial statements ending December 31, during the study period of 2014-2016, (4) Consumer sector companies listed in Indonesia Stock Exchange which has a positive profit during the period of research year
2014-2016. Companies that have met the criteria to be sampled in this study are as many as 28 companies, so the data obtained as many as 84 data.
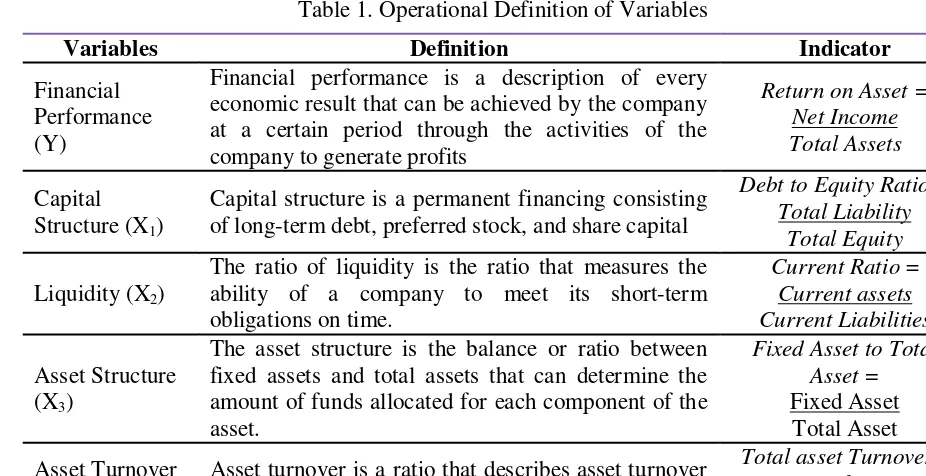
The independent variables in this research are capital structure (debt to equity ratio), current ratio, asset to total asset, and asset turnover. Dependent variable in this research is financial performance (return on asset). Operational definition The variables in this study are presented in Table 1.
Table 1. Operational Definition of Variables
Source: Data processed, 2017
Prior to conducting hypothesis testing is done Classic Assumption Test to ensure that the model used in this study has passed the prerequisite test for hypothesis testing. Hypothesis testing was performed using multiple linear regression analysis using IBM SPSS 21 application.
3. RESULTS
Descriptive statistics in this study were conducted to provide a description of the characteristics of observed
research variables (Ghozali, 2011). Descriptive statistics provide an overview of statistical data on the minimum, maximum, average (mean), and standard deviation.
Based on Table 2 it can be seen that the financial performance measured by return on assets (ROA) has the lowest value (minimum) 0.02 and the maximum value of 0.432, the mean value of 0.103, and the standard deviation of 0.107. The mean value is 0.130> 0.107 standard economic result that can be achieved by the company at a certain period through the activities of the company to generate profits
Return on Asset =
Net Income
Total Assets
Capital Structure (X1)
Capital structure is a permanent financing consisting of long-term debt, preferred stock, and share capital
Debt to Equity Ratio =
Current Liabilities
Asset Structure (X3)
The asset structure is the balance or ratio between fixed assets and total assets that can determine the amount of funds allocated for each component of the asset.
Fixed Asset to Total
Asset =
Fixed Asset Total Asset
Asset Turnover (X4)
Asset turnover is a ratio that describes asset turnover measured from sales volume.
Total asset Turnover=
Sales
capital structure measured by debt to equity ratio (DER) has the lowest value (minimum) 0.074 and the maximum value is 3.029, the mean value is 0.795, and the standard deviation value is 0.584. The mean value is 0.795> 0.584 standard deviation which means that the distribution of DER values is good. Liquidity measured by current ratio (CR) has the lowest (minimum) value of 0.514 and the maximum value of 10.254, the mean value of 2.790, and the standard deviation of 1.920. The mean value is 2,790> 1,920 standard deviation which means that the distribution of CR value is good. The asset structure measured by
fixed asset to total asset (FATA) has the lowest value (minimum) 0.080 and the maximum value is 0.784, the mean value is 0.335, and the standard deviation value is 0.147. The mean value is 0.335> 0.147 standard deviation which means that the distribution of FATA values is good. Asset turnover as measured by total asset turn over (TATO) has the lowest value (minimum) 0.204 and the largest value (maximum) of 2.886, the average value (mean) of 1.279, and the standard deviation of 0.555. The mean value is 1.279> 0.555 standard deviation which means that the distribution of TATO values is good.
Table 2. Descriptive Statistics Test Results
N Minimum Maximum Mean Std. Deviation
ROA 84 ,002 ,432 ,13030 ,107080
DER 84 ,074 3,029 ,79531 ,584748
CR 84 ,514 10,254 2,79018 1,920533
FATA 84 ,080 0,784 ,33598 ,147666
TATO 84 ,204 2,886 1,27986 ,555290
Valid N (listwise) 84
Source: Data processed, 2017
Classic Assumption Test
The classical assumption test aims to produce a good regression model. Classic assumption test in this research is normality test, multicollinearity test, autocorrelation test, and
heteroscedasticity test. To avoid errors in classical assumption testing then the number of samples used should be free of bias (Ghozali, 2011). The results of the classic assumption test of this study are presented in Table 3.
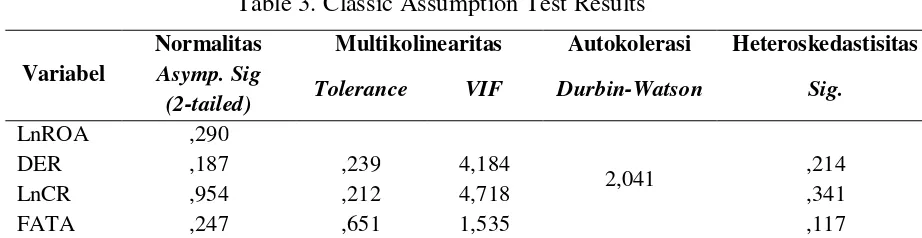
Table 3. Classic Assumption Test Results
Variabel
Normalitas Multikolinearitas Autokolerasi Heteroskedastisitas
Asymp. Sig
(2-tailed) Tolerance VIF Durbin-Watson Sig.
LnROA ,290
2,041
DER ,187 ,239 4,184 ,214
LnCR ,954 ,212 4,718 ,341
FATA ,247 ,651 1,535 ,117
LnTATO ,118 ,819 1,221 ,457
Based on Table 3, it is known that normality test results show that after transformation of data on variables with abnormal data, the results show that all the variables that have been tested data have been normally distributed with Asymp. Sig (2-tailed)> 0.05. Multicollinearity test results show the overall Tolerance value> 0.10 and VIF <10, this indicates that the regression model in this study is free from symptoms of multicolinearity. The results of the Automation Test show the value of Durbin-Watson 2.041, it can be determined the value (dl) of 1.5472 and (du) of 1.7462, the value of du <DW <4-du (1.7462 <2.0410 <2, 2538), this indicates that there is no positive and negative autocorrelation in the
regression model used in this study. Heteroskedasticity test results show that the value of Sig. respectively variabe> 0,05, this matter indicate that independent variable in this research did not happened symptom of heteroscedasticity. Overall, it can be concluded that the model in this study has passed the classical assumption test.
Hypothesis Test
Analysis method to test hypothesis in this research is multiple linear regression analysis. Model Feasibility Test Results, Partial Regression Coefficient Test, and Coefficient of Determination (R2) are presented in Table 4, Table 5, and Table 6.
Table 4. Model Feasibility Test Result
Model Sum of Squares df Mean Square F Sig.
1
Regression 20,963 4 5,241 7,702 , 000 b
Residual 53,757 79 ,680
Total 74,720 83
Source: Data processed, 2017
Based on Table 4 it is known that the value of Fcount 7.702 is greater than Ftable 2,487 and the significance level is 0.000 smaller than 0.050. This result
means that the regression model in this study has fulfilled the model feasibility test.
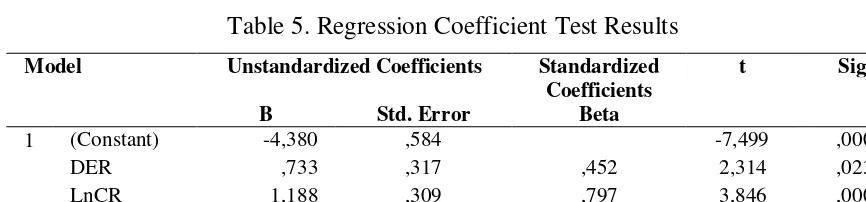
Table 5. Regression Coefficient Test Results
Model Unstandardized Coefficients Standardized
Coefficients
t Sig.
B Std.Error Beta
1 (Constant) -4,380 ,584 -7,499 ,000
DER ,733 ,317 ,452 2,314 ,023
LnCR 1,188 ,309 ,797 3,846 ,000
FATA ,778 ,760 ,121 1,023 ,309
LnTATO 1,059 ,224 ,498 4,722 ,000
Source: Data processed, 2017
Based on the result of multiple linear regression test, regression equation formed:
Interpretation result from multiple linear regression equation above is
constant value (α) equal to -4,380 indicates that all independent variable is 0, hence level of financial performance measured with return on asset (ROA) equal to -4,380. The value of the capital structure regression coefficient as measured by the debt to equity ratio (DER) is 0.733, a positive value indicates that if the capital structure variable (DER) increases by 1 percent with the assumption that the other variable remains, it will be followed by an increase in financial performance (ROA ) of 0.733 (73.3%). The value of the liquidity regression coefficient as measured by the current ratio (CR) is 1.188, a positive value indicates that if the liquidity variable (CR) rises by 1 percent with the assumption that the
other variable remains, it will be followed by an increase in financial performance (ROA) of 1.188 (118.8%). The value of regression coefficient of asset structure measured by fixed asset to total asset (FATA) is 0,778, positive value indicates that if variable of asset structure (FATA) increase by 1 percent with assumption that other variable remain, then followed by improvement of financial performance ROA) of 0.778 (78.8%). The value of the asset turnover coefficient as measured by total asset turn over (TATO) is 1.059, a positive value indicates that if the asset rotation variable (TATO) increases by 1 percent with the assumption that the other variable remains, it will be followed by an increase in financial performance (ROA ) of 1.059 (105.9%).
Table 6.Coefficient Determination (R2) Results
Model R R Square Adjusted R Square Std. Error of the Estimate
1 ,530a ,281 ,244 ,82490
Source: Data processed, 2017
Coefficient Determination Test Results (R2) in table 6 shows that the value of Adjusted R Square is 0.244. This means that 24.4% of the dependent variables in this study can be explained by independent variables ie capital structure (DER), liquidity (CR), asset structure (FATA), and asset turnover (TATO). While the rest of 75.6% is explained by other variables outside of this research model.
4. DISCUSION
The Influence of Capital Structure to Financial Performance
Capital structure (DER) has a value of t count> from ttable that is 2,314> 1,990 with significance value 0,023. The value of this significance is smaller than
the degree of confidence 0.023 <0.050. This means that the capital structure (DER) has a significant effect on financial performance (ROA). The first hypothesis (H1) is accepted.
This indicates that if the capital structure as measured by debt to equity ratio (DER) is higher, then the greater the trust from outsiders to obtain the source of funds. Therefore it will be very possible in an effort to improve the company's financial performance.
contrary to the results of research conducted by Mwangi & Birundu (2015) and Mujariyah (2016) which states that significance value of 0.000. The value of significance is 0.000 <0.050. This indicates that liquidity (CR) has a significant effect on financial performance (ROA). The second hypothesis (H2) is accepted.
Liquidity is the company's ability to fund its operations and meet its short-term liabilities. The results showed that the liquidity measured by the current ratio gives an effect on the size of the return on asset.
This study supports the results of the research of Iqbal, et al (2016) and Demigunes (2016) which states that liquidity as measured by current ratio (CR) affects financial performance, but contrary to the results of research conducted by Pramesti, Wijayanti, & Nurlaela (2016) which states that value of t <ttable is 1.023 <1.990 with a sig value. 0.309> 0.050. This indicates that the asset structure has no significant effect on financial performance (ROA). The third hypothesis (H3) is rejected.
This shows that changes in asset structure measured by fixed assets to total assets (FATA) will not be followed by changes in financial performance as measured by return on assets (ROA). This is because companies in financing
their business activities using current assets.
This study supports the research conducted by Murtadlo, Suja'i, & Wahono (2014) which states that the assets structure has no effect on financial performance, but the results of this study contradict the results of research conducted by Al Ani (2014), Rahmiyatun & Nainggolan (2016) and Mwaniki & Omagwa (2017) stating that the structure of assets affect the financial performance.
The Influence of Asset Turnover to Financial Performance
Asset turnover has tcount> ttable (4,722> 1,990) with sig value. 0,000 <0.050. This indicates that asset turnover (TATO) has a significant effect on financial performance (ROA). So the fourth hypothesis is accepted.
It indicates that if the asset turnover measured by total asset turnover (TATO) is higher, the higher the company's financial performance because the company in utilizing assets owned in the company's operational activities has been efficient, thus raising the level of profitability / improvement of the company's performance .
analysis can be concluded: (1) Capital turnover (TATO) simultaneously affect financial performance as measured by return on assets (ROA), (2) capital structure (DER) has a significant effect on financial performance (ROA), ( 3) Liquidity (CR) has a significant effect on financial performance (ROA), (4) Asset structure has no significant effect on financial performance (ROA), (5) Asset turnover (TATO) significant effect on financial performance (ROA).
This research has some limitations such as: (1) This research is only limited to the consumption industry sector in Indonesia Stock Exchange, further research is expected to examine all companies listed on Indonesia Stock Exchange. (2) This research uses 4 independent variables, namely capital structure, liquidity, asset structure, and asset rotation, subsequent research should use more variables, considering the independent variables used in this Performance: Evidence from Sultanate of Oman. Journal of US-China Public Administration, 11, 170-179.
Brigham, E., & Houston, J. (2006).
Dasar-Dasar Manajemen
Keuangan (10 ed.). (A. A. Yulianto, Penerj.) Jakarta: Salemba Empat.
Demirgunes, K. (2016). The Effect of Liquidity on Financial Performance: Evidence from Turkish Retail Industry. Journal of Economics and Finance, 8, 63-79.
Iqbal, M., & et al. (2016). Effect of Liquidity and Capital Structure on Financial Performance: Evidence from Banking Sector.
International Journal of
Innovative Research in
Multidisiplinary Field, 2(7), 1-9.
Larasati, S., Titisari, K. H., & Nurlaela, S. (2017). Pengaruh Good Corporate Governance dan Corporate Social Responsibility Terhadap Kinerja Keuangan Perusahaan Manufaktur yang Terdaftardi BEI. Seminar Nasional IENACO, 576-586.
Liaqat, I., & et al. (2017). Capital Structure as Driving Force of Financial Performance: Case of Energy and Fuel Sector of Pakistan. International Journal of Accounting and Financial Reporting, 7, 86-100.
Melawati, Nurlaela, S., & Wahyuningsih, E. M. (2016). Pengaruh Good Corporate Governance, Corporate Social Responsibility, dan Ukuran Perusahaan Terhadap Kinerja Perusahaan. Seminar Nasional IENACO, 840-847.
Mujariyah. (2016). Pengaruh Struktur Modal Terhadap Kinerja Keuangan (Studi Pada Bank Milik BUMN yang Terdaftar di Bursa Efek Indonesia Tahun 2008-2014). JOM FISIP, 3, 1-15.
Munawir. (2002). Analisis Laporan
Keuangan (Ketiga ed.).
Murtadlo, A., Suja'i, A. I., & Wahono, B. (2014). Pengaruh Struktur Modal, Struktur Kekayaan, dan Perputaran Aktiva Terhadap Kinerja Keuangan (Studi Kasus pada Perusahaan Real Estate yang Listing di BEI. JEMA, 12, 1-10.
Mwangi, M., & Birundu, E. M. (2015). The Effect off Capital Structure on The Financial Performance of Small and Medium Enterprises in Thika Sub-County, Kenya.
International Journal of Humanities and Social Science, 5, 151-155.
Mwaniki, G., & Omagwa, J. (2017). asset Structure and Financial Performance: Evidence A Case of The Nairobi Securities Exchange, Kenya. Research
Journal of Finance and
Accounting, 8, 192-200.
Nainggolan, I. P., & Pratiwi, M. W. (2017). Analisis Faktor-Faktor yang Mempengaruhi Kinerja Keuangan Perusahan. Media Ekonomi dan Manajemen, 32, 80-96.
Pramesti, D., Wijayanti, A., & Nurlaela, S. (2016). Pengaruh Rasio Likuiditas, Leverage, Aktivitas, dan Firm Size Terhadap
Profitablitas Perusahaan Sub Sektor Otomotif dan Komponen di Bursa Efek Indonesia. Seminar Nasional IENACO, 810-817.
Rahmiyatun, F., & Nainggolan, K. (2016). Pengaruh Struktur Aktiva, Perputaran Modal, dan
Pendanaan Terhadap
Profitabilitas Perusahaan Farmasi. Ecodemica, IV, 156-166.
Riyanto, B. (2001). Dasar-Dasar
Pembelanjaan Perusahaan
(Keempat ed.). Yogyakarta: BPFE-UGM.
Sari, D. I., Subroto, H., & Nurlaela, S. (2016). Pengaruh Good Corporate Governance Terhadap Kinerja Keuangan Perusahaan Real Estate & Property. Seminar Nasional dan Call For Paper
Fakultas Ekonomi Uniba
Surakarta, 323-332.
Sitanggang, J. (2013). Manajemen Keuangan Perusahaan Lanjutan
(Pertama ed.). Jakarta: Mitra Wacana Media.