Discovery of complex anomalous patterns of sexual violence in
El Salvador
Maria De-Arteaga1,2,3*, Artur Dubrawski1,2,3,4
Auton Lab1, Machine Learning Department2, Heinz College3, Robotics Institute4 Carnegie Mellon University
Abstract
When sexual violence is a product of organized crime or so-cial imaginary, the links between sexual violence episodes can be understood as a latent structure. With this assump-tion in place, we can use data science to uncover complex patterns. In this paper we focus on the use of data mining techniques to unveil complex anomalous spatiotemporal pat-terns of sexual violence. We illustrate their use by analyzing all reported rapes in El Salvador over a period of nine years. Through our analysis, we are able to provide evidence of phenomena that, to the best of our knowledge, have not been previously reported in literature. We devote special attention to a pattern we discover in the East, where underage vic-tims report their boyfriends as perpetrators at anomalously high rates. Finally, we explain how such analyzes could be conducted in real-time, enabling early detection of emerg-ing patterns to allow law enforcement agencies and policy makers to react accordingly.
Keywords—data mining; anomaly detection; pattern dis-covery; data visualization; sexual violence; El Salvador.
1
Introduction
The design of efficient policies requires a profound under-standing of the phenomena it deals with. Data constitutes an invaluable source to gain such understanding, but if mis-used data can become obsolete or even misleading. In the case of sexual violence, data is often used at a micro level to conduct investigations by law enforcement agents, and it is also used at a macro level to produce general descriptive statistics. In this paper, we attempt to bridge the gap be-tween these levels of analysis, using data science to uncover
Discussion paper, Data for Policy 2016 - Frontiers of Data Science for Government: Ideas, Practices and Projections. Cambridge, United King-dom, September 2016.
latent structures that emerge when sexual violence episodes are not independent from each other. Dependencies occur in the presence of driving forces such as organized crime or social imaginary. These phenomena establish links between criminal episodes that can be uncovered through data min-ing. In this paper we focus on two levels of analysis. First, a bivariate analysis through pivot table heat maps allows us to answer questions that correspond to conditional distribu-tions, such as who are the main perpetrators conditioned on age or location. Second, we focus on emerging spatiotem-poral anomalous patterns, which can guide policy makers to points in time when frequencies of specific types of crime are rising and react accordingly. For example, a detective in a municipality might receive five rape reports that took place in the victim’s house, and even though it is an increase from the average of two such cases per week, it can be eas-ily attributed to a fluke. However, if the detective knew such increase also occurred in four neighboring municipalities, he/she would notice an emerging pattern. We propose a way of finding such systematically emerging anomalous patterns through the use of an efficient data structure that allows us to automatically perform massive multivariate queries and report results that present a significant deviation from the expected behaviour.
Our approach consists of using relatively simple data – records of reported rapes for which only six attributes are available– discovering complex anomalous patterns hidden in it, and using data visualization to present identified pat-terns in a way that is easy for practitioners to understand. The key assumption in our analysis is that at least a portion of sexual violence episodes are linked to organized crime, social imaginary, or other latent structure, as opposed to be-ing completely isolated events with no common causes.
El Salvador recently made it to the headlines around the globe as the murder capital of the world [Muggah, 2016] and
the most violent peacetime country [Planas, 2016]. Maras–
gangs– and gang related violence are currently the pri-mary challenge to peace in the region, threatening human rights and governments’ stability [Jütersonke et al., 2009,
Arana, 2005]. During this time, lethal violence against
women and girls has positioned El Salvador at the first place of the infamous global ranking of female homicide rates [Secretariat, 2015]. Gang rape initiation of females who join
maras, and the use of sexual violence bymarasas a weapon against enemies have been documented by both academics and journalists [Virginia López Calvo, 2013, Hume, 2007], while researchers have also pointed at the cultural legit-imization of violence as a driving force of sexual violence in the country [Hume, 2004].
Previous research and documentation of such phenomena in El Salvador allows us to posit an underlying latent struc-ture among reported rapes. We aim to gain better under-standing of such structure and identify emerging anomalous patterns that can be of interest to policy makers, presenting the results through data visualizations that are compelling and easy to understand by practitioners. We propose a way of implementing such anomaly discovery in real-time. Per-haps our most relevant finding, which to the best of our knowledge has not been previously discussed in literature, corresponds to evidence of a pattern in the East of the coun-try, where victims between 12 and 14 years old (inclusive) report being raped by their boyfriends at significantly high rates, with specific points in time when this phenomenon has further escalated. In the remainder of this paper, Section 2 briefly reviews related work, Section 3 introduces the data, Section 4 explains our methodology, Section 5 follows with the results, and Section 6 presents the conclusion.
2
Related work
Sexual violence in El Salvador has been studied by mul-tiple researchers [Wood, 2009, Hume, 2004, Hume, 2007, Speizer et al., 2008]. [Wood, 2006] focused on the civil con-flict that ended in 1992, points at El Salvador as a country where sexual violence was distinctly low compared to other cases, with the vast majority of incidents occurring in the early stages of the war and perpetrated by the state forces. This is perhaps one of the only times in literature where El Salvador is referenced for its relatively low prevalence of sexual violence. [Hume, 2007] documents the system-atic use of sexual violence by gangs both as part of their
modus operandiand as an initiation ritual, where women
are subjected to gang rape, known asel trencito, before
join-ing a gang. Hume has also studied the cultural legitimiza-tion of violence as an element of male gender identity in
the general population [Hume, 2004], indicating it has led to the perception of sexual violence as a part of gender rela-tions. The prevalence of child sexual abuse before age 15 has been studied in [Speizer et al., 2008], where they conclude the most common perpetrators nationwide are neighbors or acquaintances and male family members.
To the best of our knowledge, anomaly detection techniques have not been used in the past as a
tool to study sexual violence. However, such
tech-niques have been proposed for detection and preven-tion of crime waves and crime epidemics in general
[Gorr and Harries, 2003][Neill and Gorr, 2007].
Addition-ally, the use of machine learning to forecast recidivism of do-mestic violence incidents in particular households was pro-posed in [Berk et al., 2005]. Such research, even though the-matically related, differs from ours in that it deals with in-dividual predictions rather than detection of systematic pat-terns.
The T-Cube data structure, used in this paper to enable fast massive screening, was proposed in [Sabhnani et al., 2007] as a tool for fast retrieval and analysis of time series data. It has since been used to analyze large scale multidimen-sional spatiotemporal datasets, and it has proven to be useful in multiple surveillance and outbreak detection tasks, like monitoring food and agriculture safety [Dubrawski, 2010] and detecting disease outbreaks [Waidyanatha et al., 2010]. A user interface known as T-Cube Web Interface, which uses the T-Cube data structure and allows practitioners to visual-ize results and perform drill-down analysis in real-time, was presented in [Ray et al., 2007].
3
Data
The data used in this paper contains a record of all 16,965
officially reported rapes between January 2006 and
Decem-ber 2014 in El Salvador12. For each case the exact date, age
and gender of the victim, municipality and state where the rape took place, location (i.e. victim’s house, empty lot) and relationship between the victim and the aggressor (i.e. fa-ther, acquaintance) are reported. In 15,739 cases the victim was female and in 1,225 the victim was male. The mean age of victims is 18.15, with a standard deviation of 9.76, and 7,595 victims are under fifteen years old. Figure 1 shows a histogram of age distribution, and Figure 2 shows the rate of total reported rapes per 10,000 inhabitants for each state.
1Official data provided by El Salvador’sInstituto de Medicina Legal. 2Data has been made publicly available and can be downloaded from
Figure 1: Histogram of victim’s age distribution.
Figure 2: Rate of total reported cases per 10,000 inhabitants.
4
Methodology
Bivariate analyses through pivot table heat maps are used to visualize conditional distributions. Each row of the table represents the relative frequency of the column value condi-tioned on the row value, such that the sum across each row is 1. These tables give an overview where general trends and anomalies become visible.
Spatiotemporal anomaly detection is achieved through the use of the T-Cube data structure, which enables fast screen-ing to detect those queries for which the observed counts deviate from the expected behaviour. An individual query is defined as the number of counts of a given event in a speci-fied time window, where the following parameters are given:
1. Between one to three fixed attribute values.
2. Number of neighbouring locations to aggregate over, if one of the fixed attributes corresponds to a location. 3. An initial date for the time window.
Massive screening is defined as a search over all individ-ual queries, where the parameters for the massive screening are the size of the time window and the list of attributes to query over. An example of a massive screening is a search
over the attribute subset (state,age,per petrator) for
sta-tistically significant time windows of seven days. Within this massive screening, an example of an individual query
would be(state={Morazan,SanMiguel,LaU nion},age=
[12,14],per petrator=boy f riend), for the week starting in
04−07−2014.
In massive screening, queries that significantly deviate from their expected counts are flagged as anomalies. Sta-tistical significance tests are done using either Fisher’s exact test [Upton, 1992], if the sample is small, or Chi-square test [Everitt, 1992], if the sample is big. Both rely on the anal-ysis of a contingency table, where we take into account the total count of events for the query’s time window and for a reference window that illustrates past behaviour.
5
Results
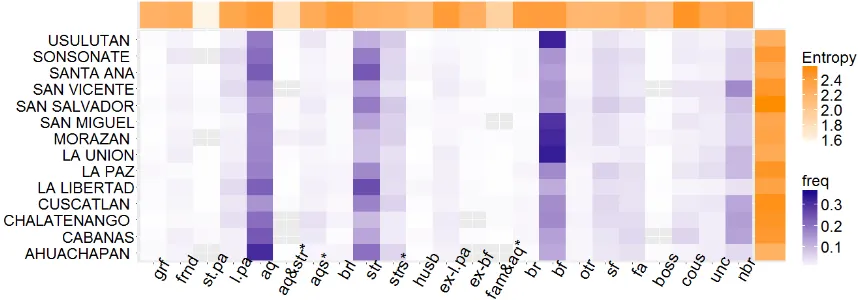
Using pivot table heat maps, we visualize the conditional distribution over relationship between victim and aggressor conditioned on victims’ age range, as well as conditioned over state. Figures 3 and 4, respectively, show the results.
Looking at Figure 3 we can analyse which aggressors are prevalent for each age group. Perhaps one of the most no-table trends is that the most frequent aggressor of victims be-tween 12 and 14 years old is the victim’s boyfriend, which is not the case for other age ranges. Another interesting finding illustrated in this heat map is the fact that neighbours are re-sponsible for a bigger proportion of rapes when victims are below 15 years old and above 55 years old. It is also relevant to note that, in line with findings in [Speizer et al., 2008], strangers are responsible for a smaller portion of aggression against underage victims than adult victims.
Similarly, we study the most frequent aggressors per state, where we find that in Usulutan, San Miguel, Morazan and La Union the prevalence of reports where the boyfriend is the aggressor differs from that of the rest of the country. These are four neighbouring states in the East.
Figure 3: Pivot table heat map of the distribution over perpetrator conditioned on victims’ age range. Abbreviations: grf = grandfather; frnd = friend; st.pa = study partner; l.pa = life partner; aq = acquaintance; aq&str = acquaintance & strangers; aqs = acquaintances; brl = brother-in-law; str = stranger; strs = strangers; husb = husband; ex-l.pa =ex-life partner; ex-bf = ex-boyfriend; fam&aq = family members & acquaintance; br = brother; bf = boyfriend; sf = stepfather; fa = father; boss =
boss; cous = cousin ; unc = uncle; nbr = neighbour. (∗) indicates gang-rape.
Figure 4: Pivot table heat map of the distribution over perpetrators conditioned on state. For abbreviations see Figure 3.
of 1.2×e−5, points at January 2008 in Morazan, La Union
and San Miguel. Between January 3rd and January 30th that year, there were 23 reported rapes of this type, compared to an expected count of 6.93 per 28 days. Figure 5 shows a screenshot of this retrieved query. The period between May 3rd and May 30th of 2008 in Usulutan and San Miguel also appears as significantly anomalous, with an observed count of 21 such rapes compared to 6.57 expected. Table 1 shows the five highest ranking anomalies in this massive screen-ing, for which 48 queries were flagged as anomalous with a p-value under 0.05.
This method can also be used when we do not know a priori which subset of data will require attention. For ex-ample, when performing a massive screening over all possi-ble values of location, state and aggressor, allowing for the anomalous cases to be determined by two or three of these attributes, we find that the highest ranked anomaly
corsponds to the first 28 days of 2011, when there were 32 re-ported rapes that took place in a victim’s house in the state of San Salvador, even though the expected count was 0.08. In the second place of this ranking we find that 63 rapes took place in a victim’s house in the states of San Salvador and Cuscatlan between February 11th and March 11th of that same year, when the expected count was 6.1. Together, they provide evidence of an anomalous increase of this type of crime report in the area during the first months of 2011.
States End date P-Value Count Expected Count
{LA UNION, MORAZAN, SAN MIGUEL} 01/30/2008 1.22E-05 23 6.93
{LA UNION, MORAZAN} 02/18/2008 2.82E-05 17 4.38
{SAN MIGUEL, USULUTAN} 05/30/2008 3.46E-05 21 6.57
{MORAZAN ,SAN MIGUEL} 08/01/2011 3.74E-05 9 1.12
{SAN MIGUEL} 06/04/2008 7.04E-05 14 3.43
Table 1: Highest ranking anomalies for the massive screening with fixed attributes age = [12,14], per petrator =
{boy f riend} and varying attribute(States). Up to 5 states with centroids no more than 50 kilometers away are aggre-gated. The time window for each query is of 28 days, and the reference period is of 365 days.
Figure 5: Screenshot of TCWI. Timeline shows observed counts and the corresponding p-value of each query.
6
Conclusion
We have proposed a way of analysing sexual violence through the assumption of an underlying latent structure. Such an assumption is sensible in cases where previous re-search has established latent causes of sexual violence. El Salvador is one of such cases but definitely not the only one. With that assumption in place, we have proposed the use of T-Cube data structure, in combination with statistical sig-nificance tests, to enable fast querying of the data and reli-able discovery of anomalous spatiotemporal patterns. Using
techniques to identify significant anomalies in this domain, indicating that it could potentially be used by policy makers for early detection of emerging patterns, which could enable development of effective policies and responses.
Acknowledgements
Carlos Eduardo Huertas and Suchit Chavez from Connectas, for their efforts to make the data publicly available and for sharing their knowledge about crime in El Salvador. This work has been partially funded by NSF grant 1320347 and by NIJ award 2013-IJ-CX-K007.
References
[Arana, 2005] Arana, A. (2005). How the street gangs took
central america. Foreign Affairs, 84(3):98–110.
[Berk et al., 2005] Berk, R. A., He, Y., and Sorenson, S. B.
(2005). Developing a practical forecasting screener
for domestic violence incidents. Evaluation Review,
29(4):358–383.
[Dubrawski, 2010] Dubrawski, A. (2010). The role of data aggregation in public health and food safety surveillance.
Biosurveillance: Methods and Case Studies, page 161.
[Everitt, 1992] Everitt, B. S. (1992).The analysis of
contin-gency tables. CRC Press.
[Gorr and Harries, 2003] Gorr, W. and Harries, R. (2003).
Introduction to crime forecasting. International Journal
of Forecasting, 19(4):551–555.
[Hume, 2004] Hume, M. (2004). “it’s as if you don’t know, because you don’t do anything about it”: gender and
vi-olence in el salvador. Environment and Urbanization,
16(2):63–72.
[Hume, 2007] Hume, M. (2007). Mano dura: El salvador
responds to gangs. Development in Practice, 17(6):739–
751.
[Jütersonke et al., 2009] Jütersonke, O., Muggah, R., and Rodgers, D. (2009). Gangs, urban violence, and
secu-rity interventions in central america. Security Dialogue,
40(4-5):373–397.
[Muggah, 2016] Muggah, R. (2016). It’s official: San
sal-vador is the murder capital of the world. LA Times.
[Neill and Gorr, 2007] Neill, D. B. and Gorr, W. L. (2007). Detecting and preventing emerging epidemics of crime.
Advances in Disease Surveillance.
[Planas, 2016] Planas, R. (2016). How el salvador became
the world’s most violent peacetime country. Huffington
Post.
[Ray et al., 2007] Ray, S., Michalska, A., Sabhnani, M., Dubrawski, A., Baysek, M., Chen, L., and Ostlund, J. (2007). T-cube web interface: a tool for immediate visu-alization, interactive manipulation and analysis of large
sets of multivariate time series. InAMIA Annual
Sympo-sium proceedings, pages 1106–1106.
[Sabhnani et al., 2007] Sabhnani, M., Moore, A., and
Dubrawski, A. (2007). Rapid processing of ad-hoc
queries against large sets of time series.Advances in
Dis-ease Surveillance, 2:66.
[Secretariat, 2015] Secretariat, G. D. (2015). Global
Bur-den of Armed Violence 2015: Every Body Counts. Cam-bridge University Press.
[Speizer et al., 2008] Speizer, I. S., Goodwin, M., Whittle, L., Clyde, M., and Rogers, J. (2008). Dimensions of child sexual abuse before age 15 in three central american
countries: Honduras, el salvador, and guatemala. Child
abuse & neglect, 32(4):455–462.
[Upton, 1992] Upton, G. J. (1992). Fisher’s exact test.
Jour-nal of the Royal Statistical Society. Series A (Statistics in Society), pages 395–402.
[Virginia López Calvo, 2013] Virginia López Calvo, G. S. P. (2013). El salvador: Truce for the gangs, no truce for women. Latin America Bureau.
[Waidyanatha et al., 2010] Waidyanatha, N., Sampath, C., Dubrawski, A., Sabhnani, M., Chen, L., Ganesan, M., and Vincy, P. (2010). T-cube web interface as a tool for detecting disease outbreaks in real-time: A pilot in india
and sri lanka. InIEEE RIVF 2010, pages 1–4. IEEE.
[Wood, 2006] Wood, E. J. (2006). Variation in sexual
vio-lence during war. Politics & Society, 34(3):307–342.
[Wood, 2009] Wood, E. J. (2009). Armed groups and sexual
violence: when is wartime rape rare? Politics & Society,

![Table 1: Highest ranking anomalies for the massive screening with fixed attributes age = [12,14], perpetrator ={boy friend} and varying attribute (States)](https://thumb-ap.123doks.com/thumbv2/123dok/2118303.1609595/5.595.129.469.197.559/highest-ranking-anomalies-massive-screening-attributes-perpetrator-attribute.webp)
