Published every April, August and December
JURNAL RISET AKUNTANSI & KEUANGAN
ISSN:2541-061X (Online). ISSN:2338-1507(Print). http://ejournal.upi.edu/index.php/JRAK
THE IMPLEMENTATION OF ACTIVITY-BASED COSTING METHOD IN DETERMINING SELLING PRICES
Muhtarudin1, Tuti Sulastri2, Eti Suprihatin3
Program Studi Komputerisasi Akuntansi, PKN LPKIA, Bandung, Indonesia
Abstrak. Penelitian ini bertujuan untuk mengetahui perbedaan perhitungan antara Harga Pokok Produksi Sepatu menggunakan metode tradisional dengan metode Activity-Based Costing. Penelitian dilakukan pada 5 industri Sepatu di Sentra Industri Sepatu Cibaduyut Kota Bandung dengan metode pengumpulan data menggunakan teknik observasi, wawancara, dan dokumentasi. Jumlah populasi sebanyak 76 industri dan metode penentuan sampel menggunakan teknik purposive sampling. Teknik analisis yang digunakan dalam penelitian ini adalah analisis beda dua rata-rata. Hasil dari penelitian ini menunjukkan bahwa terdapat perbedaan yang signifikan antara Harga Pokok Produkasi sepatu metode tradisional dengan Activity-Based Costing. Setelah menerapkan metode penentuan biaya dengan metode tersebut, Harga Pokok Produkasi adanya perbedaan yang cukup signifikan sehingga penentuan harga jual yang salah. Karena menetapkan harga jual dengan melakukan mark-up untuk menutupi biaya produksi. Penentuan harga jual dengan cara ini menyebabkan harga jual yang terlalu rendah, sehingga tidak dapat mengoptimalkan laba
Kata Kunci. Activity-Based Costing; Harga Pokok Produksi; Harga Jual.
Abstract. This study aims to find out the difference between the calculation of shoe production cost using the traditional method as compared to that using the Activity-Based Costing method. The research was conducted on five shoes industries in the Shoes Industry Center in Cibaduyut Bandung, using such data collecting method as observation, interview and documentation studies. The population comprises of 76 industries, and the method used for determining the sample is purposive sampling technique. The analytical technique used in this study is the analysis of two different averages. The results of this study indicate that there is a significant difference between the shoe production cost calculated using the traditional method and that calculated using the Activity-Based Costing method. After applying the latter cost determining method, there turned out to be a significant difference in the shoe production cost resulted from the inaccurate price calculation in the former method, as here a selling price is fixed by marking-up efforts aiming to cover the production cost. Determining a selling price in this way causes the selling price to be too low; thus it cannot optimize the profit.
Keywords: Activity-Based Costing; Production Cost; Selling Price
Corresponding author. 1Jl. Soekarno Bandung. Jl. Soekarno Hatta No. 456 Bandung 40266, Telp. 022 75642823,
Fax. 022 7564282 Email : [email protected]. 2Tuti Sulastri. Email : [email protected] 3Etin Supriatin. Email
History of article. Received: Mei 2017, Revision: Juli 2017, Published: Agustus 2017 Online ISSN: 2541-061X. Print ISSN: 2338-1507. DOI : 10.17509/jrak.v5i2.8521
INTRODUCTION
The dvelopment of the economic sector done by the Indonesian Government today aims to improve all Indonesian people’s standard of living and welfare, especially to catch up with
those of other countries’. To realize this very
noble goal, of course the development of economic sector needs to be directed to
improve people’s business ability, especially
that of weak economic entrepreneurs. As we know Micro Small and Medium Enterprises (MSMEs) have a strategic role in supporting the national economic development. MSMEs have proven able to contribute significantly in spurring the economic growth and providing employment opportunities to reduce unemployment and distribute development outcomes.
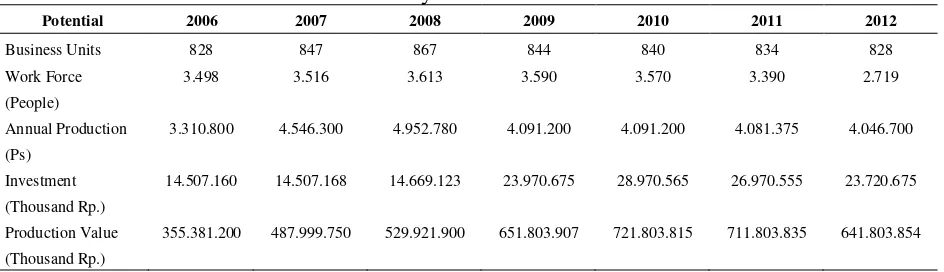
One success key for MSMEs is the availability of a clear market for MSME products (Lisnawati, 2012), such as the footwear industry or shoe and sandal industry. Most modern societies use footwear as a necessity in everyday life, whether shoes or sandals whose main purpose is to protect the health of the feet. The development of intercultural relationships also makes the footwear products to serve as an ever-evolving fashion with different kinds of models suitable for each time of the era. Cibaduyut Shoes Industries Center is one of the local economic potential in Bandung that has qualites to be of national and international standard. As time goes by, the existence of Cibaduyut Shoe Industries is currently in a stagnant state, while the number of tourists or visitors visiting the Cibaduyut shopping or trade area stay stagnant as shown in Table 1.
Table 1. The Economic Potential of Cibaduyut Shoe Industries Center
Potential 2006 2007 2008 2009 2010 2011 2012
Business Units 828 847 867 844 840 834 828
Work Force
(People)
3.498 3.516 3.613 3.590 3.570 3.390 2.719
Annual Production
(Ps)
3.310.800 4.546.300 4.952.780 4.091.200 4.091.200 4.081.375 4.046.700
Investment
(Thousand Rp.)
14.507.160 14.507.168 14.669.123 23.970.675 28.970.565 26.970.555 23.720.675
Production Value
(Thousand Rp.)
355.381.200 487.999.750 529.921.900 651.803.907 721.803.815 711.803.835 641.803.854
Source: Footwear/Shoe SMIs Development Office, 2012
Meanwhile, the fundamental weakness possessed by shoe and sandal industry entrepreneurs and other SMEs in Cibaduyut shoe industrial area is their low ability to calculate production costs. This will certainly lead to low ability of setting correct selling prices. Mistakes in calculating costs of manufactured goods lead to mistakes in determining selling prices and this in turn leads to the possibility that the salling prices will be too high or too low. Both possibilities may result in unfavorable circumstances for the companies. Over-pricing actually brings about bad image to the companies, which may make it difficult for their products to compete with similar products in the market. On the contrary, if the products are underpriced this will cause lower profits gained by the companies. According to Dicky and Martusa (2011) the
Companies whose products are underpriced may actually make sales which result in losses, even if the company considers the sale of the product to be profitable. So the sales bring revenue which is below the cost of resources used. While companies whose products are over-priced may lose competitiveness against similar products manufactured by other companies. Considering the above description it becomes clear that the right selling price is very important to prevent customers from turning away to other sellers. This can be overcome by carefully determining the production costs and the the right selling prices of the goods. That is why shoe and sandal industry entrepreneurs need to be equipped with the ability to calculate their production costs correctly to eventually set the right selling prices.
STATEMENTS OF THE PROBLEMS Production cost will be calculated in this research using the Actity-Based Costing Method with several research variables, such as activities, resources, cost objects, cost polls, cost elements, and cost drivers. The formulation of the problem in this study is based on the description stated in the background, thus the research problems are formulated as follows: (1) How is the production cost determined in the Cibaduyut Shoe Industries Center, which has not applied the Activity-Based Costing Method?, (2) How is the percentage of non-unit based costs significant with the overhead cost?, (3) How does each product absorb various unit and non-unit activities?.
LITERARY REVIEW Cost
Carter and Usri (2006: 29) defines cost as the exchange rate, expenditure, sacrifice to gain benefit. In financial accounting, expenditures or sacrifices at the time of acquisition are represented by current or future depreciation in the form of cash or other assets. According to Widilestariningtyas, et al (2012: 2) cost has a different meaning from expense; the two cannot be exchanged. Mulyadi (2010: 22)
reveals that cost is an object processed by cost accounting.
In a broad sense, cost is the sacrifice of economic resources, measured in units of money, which have occurred or are likely to occur for a particular purpose. Cost is cash or cash equivalent value sacrificed to obtain expected goods or services to provide current or future benefits for the organization (Hansen and Mowen, 2009: 47). Costs are divided into either fixed costs or variables related to changes in the volume of manufactured products (Hansen and Mowen 2009). Volume also relates to units produced, such as direct labor hours or machine working hours, and is the only reason for the emergence of costs that are considered important. The things that drive costs based on this unit are used for allocating unit-driven activities to charge the cost object.
Factory Overhead Costs
Basically, factory overhead costs can be defined as indirect resources, indirect labors, and all other factory costs which cannot be conveniently identified or charged directly to specific orders, products or other cost objects, according to Carter and Usri (2006: 29). Warindrani (2006: 27) defines two stages of overhead charging with ABC method, that is: (1) Overhead costs which are charged over activities. In this stage, five steps are conducted, that is: (a) Identifying activities. (b) Defining costs in relation to each activity. (c) Grouping similar activities together.
Activities are identified and put into four groups, namely: 1. Unit level activities. 2. Batch level activities. 3. Product sustaining activities. 4. Facility sustaining activities. (d) Combining costs of grouped activities. (e) Calculating tariff per activity group (homogeen cost pool rate). (2) Charging activities costs onto the product. After the tariff of each activity group is known, calculation can be done to find out the overhead cost charge onto the product, as follows:
Production Cost
Garrison (2009) defines that Production Cost is the manufacturing cost related to goods before they can sell the products.
Costing Calculation with Activity System
Blocher, et al (2011: 206) describes that the ABC System is a way to determine how many resources are specified for a cost object, such as a service, as well as the book-closing done every month. Some companies mention this activity as a business or infrastructure support activity. Customers, and based on the activities undertaken for production. This system can overcome the distortion of determining production cost of goods manufactured calculated by the cost accounting system that has been previously applied.
Activities Classification
Blocher, at al (2011:210) classifies activities in the Activity-Based Costing Sytem as follows: (1) Unit-level activity is performed on each unit of a company's product or service. Examples of unit level activities include direct ingredients, direct labor hours, and component input as well as inspection of each unit. Unit-level activity is an activity by volume. The activities required vary in proportion to the number of cost objects. Cost drivers for resource consumption and cost drivers for activity consumption tend to be similar to unit-level activities. (2) Batch-unit-level activity is performed on every batch or group of product or service units. Examples of batch-level activities are machine preparation, purchase order arrangement, production scheduling, batch inspection, raw material handling, and production process acceleration. (3) Product level activity supports the production process of a specific product or service. Examples of product level activities include product design, parts purchases required by the product, and engagement in engineering changes to modify the product. (4) The facility-level activity supports general operations. This activity is not caused by product or customer service needs and can not be traced to a single unit, batch, or
product. Examples of facility-level activities include the provision of security to maintain factory machines with general functions, plant management, payment of building taxes and factory insurance.
Stages of Implementing Activity-Based Costing System
The implementation of ABC according to Hansen and Mowen (2009:323) is as follows: (a) Initial Framework Determining. Production Cost based on activities has 4 (four) steps as follows: (1) Grouping various activities. Various activities are divided into groups that have some easily recognizable physical features and parts of the production process that can be classified or classified into general activities, unit level, batch, product, and facility.oleh pemicu biaya tunggal. Jadi suatu kelompok biaya yang homogen memiliki hubungan sebab akibat yang sama. Aktivitas- aktivitas tidak langsung harus memiliki korelasi secara masuk akal dan mempunyai rasio konsumsi pemakaian yang sama untuk seluruh produk. (2) Finding Relations between costs and activities. This step is done by finding out various costs that occur and then relating between the costs followed by the activities that trigger costs. (3) Classifying the same group costs. Homogeneous group cost is similar kinds of costs put into a group in which the costs can be caused by a single cost trigger. Thus a homogeneous cost group has the same causal relationship. The activities do not necessarily have direct correlation reasonably and have the same consumption usage ratio for all products. (4) Determining FOH group tariffs for a group of activities in which each group has a strong causal relationship. Group rates can be calculated by this formula:
Pool Rate = Total overhead cost by activity group Activity group calculation base Source: Hansen and Mowen, (2009)
(b) Second Framework. In this step, the cost of each group of overhead costs can be known for different types of products. This is done using the previously calculated pool rate consumed by each product. So the overhead selected from each class of cost of each product is calculated by using the formula:
Source: Hansen and Mowen, (2009)
Cost Driver
Blocher (2011: 205) argues that cost drivers are something that leads to changes in the cost of various behaviors, because cost drivers are the cause or relation to changes in the amount of costs, in which the amount of costs that are changed and can be measured or calculated is a very good basis for determining cost to the cost object.
Advantages and Disadvantages of Activity-Based Costing System
Rayburn (1999:154) states that the advantages are: (1) Improvement on the distortion found in the old system based on the provision of stages that only use the movers made by volume. (2) Companies with high indirect costs, diverse products, and various batch sizes of production operations are likely to benefit. This system generates a lot of information about the activities and resources that management needs to carry out these activities. (3) ABC information can help companies know and evaluate which activities are not important and
can be lost.
The disadvantages of Activity System according to Blocher, at all (2011:217) are: (a) Cost Allocation. Not all costs have the driving force of proper or non-duplicate consumption of resources or activities. A certain amount of costs may be allocated to products or departments according to a strong production unit because no real action can be found that may cause the cost. (b) Ignoring costs. The cost of a product or service that the ABC system identifies tends to not cover all costs associated with that product or service. The cost of a product or service typically excludes costs for activities such as marketing, advertising, research, development, and product engineering. Although some of these costs can be traced to a product or service. Product costs do not include these costs because the generally accepted accounting principles for financial reporting require those costs to be treated as periodic costs. (c) Expensive and time consuming. The ABC system is not cheap and takes time to develop and implement. For
companies and organizations that have used traditional cost calculation system based on volume, implementing a new ABC system tends to be very expensive. Moreover, like most innovative accounting and management systems, it usually takes a year or more to develop and implement ABC successfully.
Comparison between Traditional Product Cost and ABC Method
The ABC method considers that overhead costs can be traced adequately to individual products. The cost incurred by the cost driver based on the unit is the cost that in the traditional method is referred to as variable cost.
The ABC method improves the accuracy of the cost of product cost calculation by recognizing that much of the overhead costs still vary in proportion to change other than by volume of production. By understanding what causes these costs to increase and decrease, these costs can be traced to each product. This causal relationship allows managers to improve the accuracy of product cost calculations that can significantly improve decision making (Hansen and Mowen, 2009).
Selling Price Determination Method
Company policy in determining the selling price becomes one of the important factors in order to obtain profit in accordance with what is expected. The approach typically used to determine the selling price is to add a predicted profit (markup) to the cost of goods. Product markup is the difference between the selling price (Krismiaji & Aryani, 2012: 17). The way the calculation as follows:
Selling Price = Cost + (markup Percentage x cost)
Source: Garrison (2009:531
RESEARCH METHODOLOGY
research subjects, such as treatment or opinion of the individual, organization and so on. The Wiratha case study (2006: 144) is an in-depth study of a particular case whose outcome is a complete and organized picture of the subject.
Venue and Time of Research
This research has been done in the location of Cibaduyut shoe industry center on Jl. Cibaduyut Bandung, along the corridor of Jl. Komp. TVRI until Jl. Soekarno Hatta, belonging to the administrative area of Cibaduyut Wetan Regency, Cibaduyut Kidul Urban-Village, Cibaduyut Urban-Village, and Bojong Loa Kidul Urban-Village. The study
has been planned to take one year’s time.
Sampel Determination
The samples taken are shoe and sandal industries in the Cibaduyut Shoe industries Center in Bandung. The research was conducted by survey method with convenience sample selection. The reason for using this approach is its simplicity and flexibility.
The number of samples is determined with a consideration that the exact number of population is unknown, so the number of samples is decided to be as many as five companies which have not used the
Activity-Based Costing (ABC) method in calculating their Production Cost and Selling Price. It is expected that this number may represent the population.
FINDINGS
These are the five shoe companies that become
the objects of this research: (1) “Danniel” Shoe
Workshop. (2) "Pepen" Shoe Workshop. (3)
“Ko Akin” Shoe Workshop. (4) "Mamat" Shoe
Workshop. (5) "Fanlung" Shoe Workshop. The five companies are individual companies engaged in Home Footwear industries
producing various types and models of Men’s Loafers Shoes and Men’s Casual Shoes. The
products are finished products manufactured to meet consumers demand. The raw materials are leather with various shades and colors. In addition to the main raw materials, the production process is also supported by equipment and tools to support production activities such as pressing machines, sewing machines, coating materials, shoe accessories, adhesives, yarns, needles, and others.
To further analyze, below are the data collected for calculating production costs in the Cibaduyut Shoe Industries Center in July 2017
to produce Men’s Loafers and Casual Shoes.
The data are as follows:
Table 2. Total of Production and Machine Working Hours in July 2017
Types of Products Total of Production (Unit) Machine Working Hours (Hour)
Men’s Loafers Shoes 3.059 917
Men’s Casual Shoes 2.987 895
TOTAL 6.046 1.812
Table 3. Raw Material Cost
Types of Products Total Cost (Rp)
Men’s Loafers Shoes 75.226.800
Men’s Casual Shoes 73.455.600
TOTAL 148.682.400
Table 4. Direct Labors Cost
Types of Products Total Cost (Rp)
Men’s Loafers Shoes 33.026.400
Men’s Casual Shoes 32.248.800
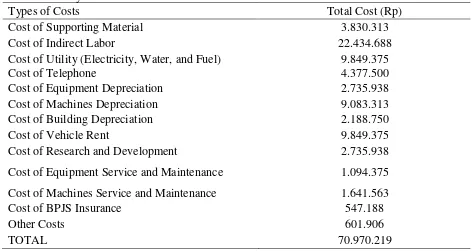
Table 5. Factory Overhead Cost
Types of Costs Total Cost (Rp)
Cost of Supporting Material 3.830.313
Cost of Indirect Labor 22.434.688
Cost of Utility (Electricity, Water, and Fuel) 9.849.375
Cost of Telephone 4.377.500
Cost of Equipment Depreciation 2.735.938
Cost of Machines Depreciation 9.083.313
Cost of Building Depreciation 2.188.750
Cost of Vehicle Rent 9.849.375
Cost of Research and Development 2.735.938
Cost of Equipment Service and Maintenance 1.094.375
Cost of Machines Service and Maintenance 1.641.563
Cost of BPJS Insurance 547.188
Other Costs 601.906
TOTAL 70.970.219
The calculation of Production Cost (PC) based on Traditional (Conventional) System:
Factory Overhead Cost Tariff = Total of Factory Overhead Cost Machine Working Hour
Factory Overhead Cost Tariff = 70.970.219 1.812 hours
= Rp 39.167/hour
Table 6. Men’s Loafers Shoes Cost
Types of Costs Total Cost Total Production Cost per Unit
(Rp) (Unit) (Rp)
Cost of materials 75.226.800,00 3.059 24.591,96
Cost of Direct Labors 33.026.400,00 3.059 10.796,47
Cost for Factory Overhead: 35.915.944,04 3.059 11.741,07
917 hours @ Rp 39.167
Production Cost (PC) per Unit (Rp) 47.129,50
Table 7. Men’s Casual Shoes Cost
Types of Costs Total Cost
(Rp)
Total Production (Unit)
Cost per Unit (Rp)
Cost of materials 73.455.600,00 2.987 24.591,76
Cost of Direct Labors 32.248.800,00 2.987 10.796,38
Cost of Factory Overhead 35.054.275 2.987 11.735,61
The Calculation of Production Cost (PC) based on Activity-Based Costing (ABC) System First Stage (a) Grouping of various activities and associating various costs with various
activities. (b) Deciding homogeneous cost group. (c) Deciding group tariff. Second Stage
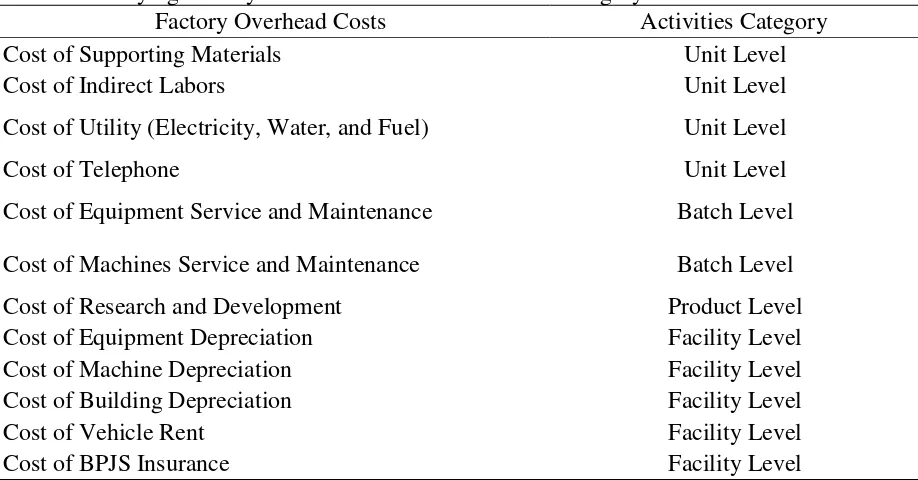
Table 8. Identifying Factory Overhead Cost into Activities Category
Factory Overhead Costs Activities Category
Cost of Supporting Materials Unit Level
Cost of Indirect Labors Unit Level
Cost of Utility (Electricity, Water, and Fuel) Unit Level
Cost of Telephone Unit Level
Cost of Equipment Service and Maintenance Batch Level
Cost of Machines Service and Maintenance Batch Level
Cost of Research and Development Product Level
Cost of Equipment Depreciation Facility Level
Cost of Machine Depreciation Facility Level
Cost of Building Depreciation Facility Level
Cost of Vehicle Rent Facility Level
Cost of BPJS Insurance Facility Level
Table 9. Production Cost Activities
Cost Pool Types of Factory Overhead Costs Cost Driver
I Cost of Supporting Materials Total of Production
Cost of Indirect Labor Total of Production
Cost of Vehicle Depreciation Total of Production
Cost of Research and Development Total of Production
Cost of Equipment Service and Maintenance Total of Production
Cost of Vehicle Rent Total of Production
II Cost of Utility (Electricity, Water, and Fuel) Machine Working Hours
Cost of Telephone Machine Working Hours
Cost of Equipment Depreciation Machine Working Hours
Cost of Machine Depreciation Machine Working Hours
III Cost of Building Depreciation Square area
Table 10. Calculating Allocation for Activity-Based Costing (ABC) System
Points Men’s Loafers Shoes Men’s Casual Shoes Total
Total of Production (Unit) 3.059 2.987 6.046
Machine Working Hours (Hours) 917 895 1.812
Square area (m2) 125 125 250
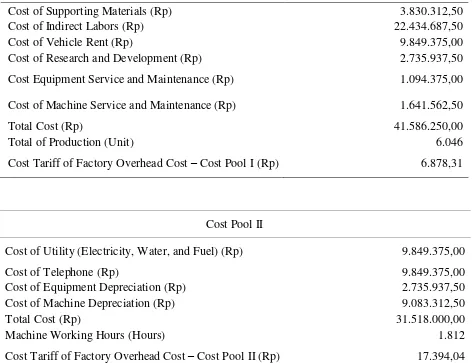
Table 11. Group Tariff for Factory Overhead Cost with Activity-Based Costing (ABC) System Cost Pool I
Cost of Supporting Materials (Rp) 3.830.312,50
Cost of Indirect Labors (Rp) 22.434.687,50
Cost of Vehicle Rent (Rp) 9.849.375,00
Cost of Research and Development (Rp) 2.735.937,50
Cost Equipment Service and Maintenance (Rp) 1.094.375,00
Cost of Machine Service and Maintenance (Rp) 1.641.562,50
Total Cost (Rp) 41.586.250,00
Total of Production (Unit) 6.046
Cost Tariff of Factory Overhead Cost – Cost Pool I (Rp) 6.878,31
Cost Pool II
Cost of Utility (Electricity, Water, and Fuel) (Rp) 9.849.375,00
Cost of Telephone (Rp) 9.849.375,00
Cost of Equipment Depreciation (Rp) 2.735.937,50
Cost of Machine Depreciation (Rp) 9.083.312,50
Total Cost (Rp) 31.518.000,00
Machine Working Hours (Hours) 1.812
Cost Tariff of Factory Overhead Cost – Cost Pool II (Rp) 17.394,04
Cost Pool III
Cost of Building Depreciation (Rp) 2.188.750,00
Cost of BPJS Insurance (Rp) 547.187,50
Total Cost (Rp) 2.735.937,50
Square area (m2) 250
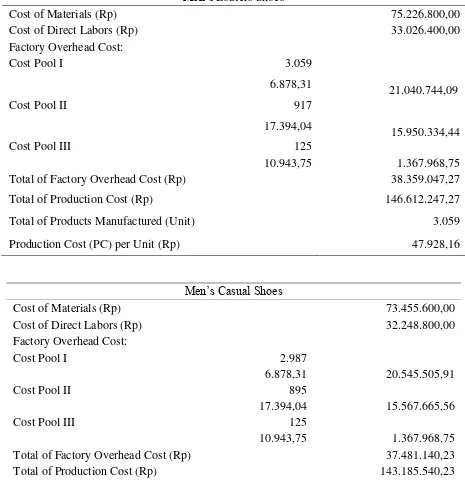
Table 12. Calculation of Production Cost (PC) Per Unit with Activity-Based Costing (ABC) System
Men’s Loafers Shoes
Cost of Materials (Rp) 75.226.800,00
Cost of Direct Labors (Rp) 33.026.400,00
Factory Overhead Cost:
Cost Pool I 3.059
6.878,31
21.040.744,09
Cost Pool II 917
17.394,04
15.950.334,44
Cost Pool III 125
10.943,75 1.367.968,75
Total of Factory Overhead Cost (Rp) 38.359.047,27
Total of Production Cost (Rp) 146.612.247,27
Total of Products Manufactured (Unit) 3.059
Production Cost (PC) per Unit (Rp) 47.928,16
Men’s Casual Shoes
Cost of Materials (Rp) 73.455.600,00
Cost of Direct Labors (Rp) 32.248.800,00
Factory Overhead Cost:
Cost Pool I 2.987
6.878,31 20.545.505,91
Cost Pool II 895
17.394,04 15.567.665,56
Cost Pool III 125
10.943,75 1.367.968,75
Total of Factory Overhead Cost (Rp) 37.481.140,23
Total of Production Cost (Rp) 143.185.540,23
Total of Products Manufactured (Unit) 2.987
Production Cost (PC) per Unit (Rp) 47.936,24
Table 13. Calculation of Factory Overhead Cost with Activity-Based Costing (ABC) System per Product per Unit
Points Men’s Loafers Shoes Men’s Casual Shoes
Total Factory Overhead Cost (Rp) 38.359.047,27 37.481.140,23
Total of Production (Unit) 3.059 2.987
From the above calculation Factory Overhead
Cost per unit for Men’s Loafers Shoes can be known to be Rp 12.539.73 and Men’s Casual
Shoes to be Rp 12.548.09
Comparison of Analysis of Production Cost (PC) Calculation between Traditional (Conventional) System and Activity-Based Costing (ABC) System Per Product Per Unit.
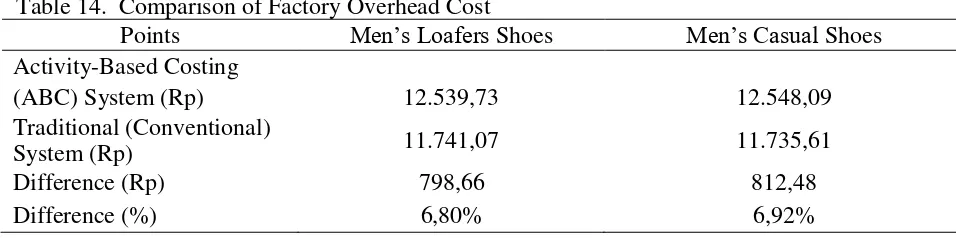
Table 14. Comparison of Factory Overhead Cost
Points Men’s Loafers Shoes Men’s Casual Shoes
Activity-Based Costing
(ABC) System (Rp) 12.539,73 12.548,09
Traditional (Conventional)
System (Rp) 11.741,07 11.735,61
Difference (Rp) 798,66 812,48
Difference (%) 6,80% 6,92%
Table 15. Comparison of Production Cost (PC) per Product per Unit
Points Men’s Loafers Shoes Men’s Casual Shoes
Activity-Based Costing (ABC) System (Rp) 47.928,16 47.936,24
Traditional (Conventional) System (Rp) 47.129,50 47.123,76
Difference (Rp) 798,66 812,48
Difference (%) 1,69% 1,72%
More advantageous Using
There are differences in the allocation of Factory Overhead Costs compared to the Production Cost (PC) because Activity-Based Costing (ABC) uses activities as a trigger to determine how much indirect overhead activities for each shoe product consumes. Traditional (Conventional) Systems allocate overhead only on one basis or allocation base (in this discussion only one allocation is used, i.e. Machine Working Hours), thus it fails to absorb the correct overhead consumption according to individual shoe production. Activity-Based Costing (ABC) system produces more accurate production cost calculation than Traditional (Conventional) system. This level of accuracy is very important for companies in making decisions related to company management, for example in determining selling price in order to face the ever increasing competitive market.
CONCLUSIONS
Based on the discussion above it can be concluded as follows: (1) In the application of traditional (conventional) method for determining Production Cost (PC) in the
Cibaduyut Industrial Center, the allocation is based on the number of machine hours and direct labor hours as a foundation for allocating Factory Overhead Costs. Using volume-based (machine working hours) cost drivers to charge the Factory Overhead Cost results in a distorted Production Cost (PC). Thus the Production Cost (PC) generated by traditional (conventional) systems is inaccurate. The results of comparison in the above discussion show that the traditional (conventional) system
overcosts Men’s Loafers Shoes and Men’s
considered by the company management to get more competitiveness. This in turn can spur activities to achieve a more efficient and higher output pattern. (3) The allocation of Factory
Overhead Cost per unit for Men’s Loafers
Shoes calculated using Activity-Based Costing
(ABC) System is of Rp 12,539.73 and Men’s
Casual Shoes is Rp 12.548.09, while based on
the calculation using traditional method Men’s Loafers Shoes is Rp 11.741.07 and Men’s
Casual Shoes is Rp 11.735,61, and this makes the calculated production cost to be too low, so that the cost of goods will be low, the selling price will be cheaper, and the company cannot achieve maximum profit.
SUGGESTIONS
After being theoretically described, followed by an in-depth analysis and discussion, it is clear that many advantages can be obtained if Activity-Based Costing (ABC) system is used. Therefore the authors put forwards the following suggestions: (1) Shoe industries in the Cibaduyut Shoe Industry Center should use the Production Cost (PC) calculation system based on the Activity-Based Costing (ABC) system, since the traditional (conventional) cost systems lead to inaccurate cost
calculation. (2) If the companies’ management
wants to implement the Activity-Based Costing (ABC) method, the design of Activity-Based Costing (ABC) system should not be too complicated, too difficult to understand, and too expensive to maintain.
BIBLIOGRAPHY
Blocher, Edward J., David E.Stout, dan G. C. (2011). Manajemen Biaya dengan Penekanan Strategis. Buku 1No Title (5th ed.). Jakarta: Salemba Empat.
Carter, W. dan U. M. F. (2006). Akuntansi Biaya (13th ed.). Jakarta: Salemba Empat.
Dewi, F.C. and Wirasedana, I. (2015). ANALISIS BEDA DUA RATA-RATA METODE TIME-DRIVEN ACTIVITY-BASED COSTING PADA INDUSTRI
GARMEN. E-Jurnal Akuntansi Universitas Udayana, 796–810.
Dicky, Y., Martusa., R. (2011). Penerapan Activity-Based Costing (ABC) System dalam Penghitungan Profitabilitas Produk. Jurnal Akuntansi, 3, 69–89.
Garrison, A. M. (2001). Akuntansi Manajerial (11th ed.). Jakarta: Penerbit Salemba Empat.
Hansen, D. R. dan M. M. M. (2009).
Akuntansi Manajerial (8th ed.). Jakarta: Penerbit Salemba Empat.
Krismiaji & Aryani. (2011). Akuntansi Manajemen (2nd ed.). Jogyakarta: Unit Penerbit dan Percetakan Sekolah Tinggi Ilmu Manajemen YKPN.
Lisnawati, L. (2011). PENGARUH ORIENTASI PASAR TERHADAP DISTINCTIVE CAPABILITY DAN IMPLIKASINYA PADA
KEUNGGULAN BERSAING UMKM KOTA BANDUNG SEBAGAI
INDUSTRI KREATIF (SURVEI PADA EMPAT SENTRA UMKM
UNGGULAN KOTA BANDUNG. STRATEGIC, 10, 70–86.
Mulyadi. (2011). Akuntansi Biaya (Unit Pener). Jogyakarta.
Warindrani, A. K. (2006). Akuntansi
Manjemen (1st ed.). Jogyakarta: Graha Ilmu.
Widilestariningtyas, Ony., Anggadini, S. D, Firdaus, D. W. (2012). Akuntansi Biaya (1st ed.). Jogyakarta: Graha Ilmu.
Wiratha, I. M. (2006). Metodologi Penelitian Sosial