The Influence of Basin Landuse Coverage to
Flood Hazard at Kemoning River, Kabupaten
Sampang
Liyana Agustini
1, Nadjadji Anwar
2, Eko Budi Santoso
3Abstrak Sampang adalah salah satu kabupaten di Jawa Timur, yang setiap tahun sering mengalami banjir dan memburuk akhir-akhir ini. Salah satu penyebab banjir sampang adalah tidak terkontrolnya penggunaan lahan di Daerah Aliran Sungai (DAS) Kemoning. Tujuan dari penelitian ini adalah untuk menghitung pengaruh penggunaan lahan DAS terhadap limpasan sungai Kemoning. Penelitian ini menggunakan rumus Q = 0,002778 x Luas x Koefisien x Curah hujan. Penggunaan curah hujan periode 25 tahunan distribusi Log Pearsson III karena telah memenuhi syarat. Hasilnya yaitu Q = 32.86, menggambarkan bahwa semakin tinggi koefisien dapat menyebabkan tingginya debit banjir. Pemerintah Kabupaten Sampang harus menambah area dengan koefisien yang kecil (area hutan) untuk mengurangi debit banjir.
Kata KunciPenggunaan lahan DAS, Debit Banjir, Sungai Kemoning, Banjir Sampang
Abstract Sampang is one of East Java’s district, which often flooded annually and worsened lately. One of the causes Sampang flood is uncontrolled landuse basin in the watershed (DAS) of Kemoning Rivers. The objective of the research is to calculate the influence of landuse basin coverage to runoff Kemoning River and flood discharge. This research use formula Q = 0,002778 x Large x Coeffisien x Rainfall. 25th return period of rainfall from Logpearson III distribution is used because
the distribution is eligible. The results, Q = 32.86, indicate that a higher coefficient can cause an amount of flood discharge. Sampang local government should increase the areas with a small coefficient (The forest area) to reduce amount of flood discharge.
Keywords Landuse Basin, Flood Discharge, Kemoning River, Sampang Flood.
I.INTRODUCTION1
Flooding is defined as a state, where the water can not accommodated by the river, causing runoff or puddles on the land should be dry [1].
The most dominant causes of flooding is the runoff increase significantly. Runoff increase more because of landuse changing. A forest can store a large of runoff but in some region (rural and urban area) there are land conversion from forest to settlements. Settlements have small runoff resistance. This is because no catchment area on settlements. As the results of land conversion are an increasing runoff and discharge. Increasing runoff and discharge because the vegetation as a barrier runoff has been lost. Forest area, capable of keeping a large number of water, can decrease of flood [2].
Sampang is one of East Java’s district, which often flooded annually and worsened lately. The floodplains of Sampang regencies are an area downstream of the Kemoning basin. There are 7 floodplains in Kabupaten Sampang i.e Banyuanyar District, Dalpenang District, Gunung Sekar District, Karangdalem District, Rongtengah District, Polagan District, and Tanggumong District [3].
Sampang flood causes by a large number of rainfall, morphology of Kemoning River, cross section
Liyana Agustini is a Master Student Departement of Civil Engineering, Sepuluh November Institute of Technology, Surabaya, 60111, Indonesia, [email protected].
Nadjadji Anwar is a Lecturer Departement of Civil Engineering, Sepuluh November Institute of Technology, Surabaya, 60111, Indonesia, [email protected].
Kemoning River and drainage system can not accommodate the flood discharge [4].
Moreover, the changing of landuse especially since 2004 to 2013 has resulted to increase the runoff coefficient and flood discharge. Increasing runoff coefficient, especially in the rainy season, can make flood at downstream Kemoning River and contribute to environmental damage [5].
Management landuse is one alternative in integrated flood management to reduce the amount of runoff. Based on Bappeda (Agency for Regional Development), There are not studies about the influence of landuse to runoff especially at Kemoning Basin. The previous studies or researchs concern about drainage systems, community participation, critical disaster areas, and the capacity of reservoirs [4].
The objective this research to analyzed the effect of landuse changing of upstream Kemoning River to the amount of flood discharge.
II.METHOD
This research use formula Q = 0,002778 x Large x Coeffisien x Rainfall [6]. 25th return period is choosen for the rainfall.
The first steps are collecting maximum precipitation data and analysis average rainfall area. Precipitation
data is collected by secondary data from Department of Public Works of Water Resources at Kabupaten Sampang [7].
Calculating average rainfall area use polygon Thiessen method. This method to analyzed the coefficient of each station to represent the area of rain station.
The Second step is calculating return period using the frequency and probability of precipitation analysis. This research uses Log Pearson III Distribution and Gumbel Distribution. We should calculated standard deviation from each distribution before we calculate T-year return period rainfall.
We must use Chi Square test to choose the eligible distribution. There is qualified to determine eligible distribution. Gumbell distribution is eligible if the value coefficient of Skweness (Cs) ≤ 1,1396 and the value coefficient of curtosis (Ck) ≤ 5,4002. Log Persson III distribution is eligible if the value coefficient of Skweness (Cs) and the value coefficient of curtosis (Ck) ≠ 0 [7].
The last is analysis the influences of land use towards the amount of flood discharge using the formula. The result of the calculation period T of the distribution selected can be used for the formula to determine the effect of land use on the discharge and flooding.
III.RESULTS AND DISCUSSION
3.1 Analyze average rainfall area.
Kemoning basin is one of basin at Sampang that has covering area 408.25 km2 with 9 sub basin and 5 rainfall stations. Rainfall stations are used to calculate maximum precipitation. A mount of maximum precipitation at Kemoning basin can be calculated by the coefficient of the rain station area which it use polygon Thiessen method. Calculating the section area of the flow of flood control, each of the area is influenced by rainfall observations, are using hydrological map.
There are two ways to create polygon Thiessen. They are using manual drawing or using ArchGis Programme. In the hydrological map, created Thiessen polygons, draw a relationship line between the stations, and then draw a line between the axis of the lines connecting these stations..
Figure 1 Polygon Thiessen Map
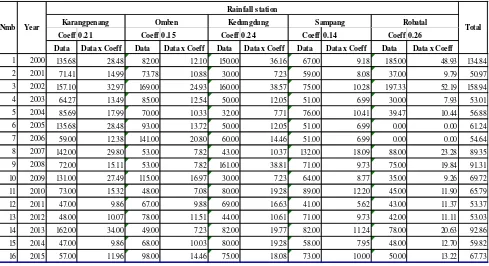
TABLE 1 THE COEFFISIEN OF STATION RAINFALL AREA The result of coeffisien rainfall area is multiplied with the maximum rainfall data to generate avarage rainfall area which is used for Gumbel and Log Pearsson III distribution (shown table 2).
TABLE 2 THE AVARAGE RAINFALL AREA
3.2 Analysis of The Frequency And Probability Of Precipitation. There are many distribution to calculate T-year return period [8]. This research just using two distribution to calculate the frequency and probability of precipitation. The distribution are :
1. Gumbel Distribution
TABLE 3 CALCULATION GUMBELL METHOD
a. Standard Deviation of Gumbel distribution.
1
𝜎 = 31,36
Note: 𝜎 = standard deviation; X = variance on year, Xr = value avarage rainfall (table 2), n = a number of data.
b. The frequency factor
2
K = The frequency factor; Yt = Reduced variate as a function of The T-period Yt = -Ln [-Ln (T-1)/T]; Sn = Reduced standard deviation. Yn = 0.5157 dan nilai Sn = 1.0316 C oe ffisie n
Coeff 0.21 Coeff 0.15 Coeff 0.24 Coeff 0.14 Coeff 0.26
Data Data x Coeff Data Data x Coeff Data Data x Coeff Data Data x Coeff Data Data x Coeff
1 2000 135.68 28.48 82.00 12.10 150.00 36.16 67.00 9.18 185.00 48.93 134.84
2 2001 71.41 14.99 73.78 10.88 30.00 7.23 59.00 8.08 37.00 9.79 50.97
3 2002 157.10 32.97 169.00 24.93 160.00 38.57 75.00 10.28 197.33 52.19 158.94
4 2003 64.27 13.49 85.00 12.54 50.00 12.05 51.00 6.99 30.00 7.93 53.01
5 2004 85.69 17.99 70.00 10.33 32.00 7.71 76.00 10.41 39.47 10.44 56.88
6 2005 135.68 28.48 93.00 13.72 50.00 12.05 51.00 6.99 0.00 0.00 61.24
7 2006 59.00 12.38 141.00 20.80 60.00 14.46 51.00 6.99 0.00 0.00 54.64
8 2007 142.00 29.80 53.00 7.82 43.00 10.37 132.00 18.09 88.00 23.28 89.35
9 2008 72.00 15.11 53.00 7.82 161.00 38.81 71.00 9.73 75.00 19.84 91.31
10 2009 131.00 27.49 115.00 16.97 30.00 7.23 64.00 8.77 35.00 9.26 69.72
11 2010 73.00 15.32 48.00 7.08 80.00 19.28 89.00 12.20 45.00 11.90 65.79
12 2011 47.00 9.86 67.00 9.88 69.00 16.63 41.00 5.62 43.00 11.37 53.37
13 2012 48.00 10.07 78.00 11.51 44.00 10.61 71.00 9.73 42.00 11.11 53.03
14 2013 162.00 34.00 49.00 7.23 82.00 19.77 82.00 11.24 78.00 20.63 92.86
15 2014 47.00 9.86 68.00 10.03 80.00 19.28 58.00 7.95 48.00 12.70 59.82
16 2015 57.00 11.96 98.00 14.46 75.00 18.08 73.00 10.00 50.00 13.22 67.73
Nmb Year
Rainfall station
Total
Karangpenang Omben Kedungdung Sampang Robatal
No. Tahun X X - Xr (X - Xr)2 (X-Xr)3 (X-Xr)4 1 2000 134.84 59.00 3481.01 205379.64 12117411.44 2 2001 50.97 -24.87 618.49 -15381.62 382533.40 3 2002 158.94 83.10 6905.73 573871.69 47689166.31 4 2003 53.01 -22.84 521.61 -11912.95 272077.35 5 2004 56.88 -18.97 359.68 -6821.29 129366.60 6 2005 61.24 -14.61 213.33 -3115.90 45510.52 7 2006 54.64 -21.21 449.73 -9537.38 202257.77 8 2007 89.35 13.51 182.46 2464.63 33291.75 9 2008 91.31 15.46 239.10 3697.13 57168.04 10 2009 69.72 -6.12 37.50 -229.65 1406.30 11 2010 65.79 -10.06 101.18 -1017.71 10236.87 12 2011 53.37 -22.47 504.92 -11345.80 254945.30 13 2012 53.03 -22.82 520.65 -11879.89 271071.24 14 2013 92.86 17.02 289.68 4930.37 83914.91 15 2014 59.82 -16.02 256.62 -4110.89 65853.93 16 2015 67.73 -8.12 65.86 -534.46 4337.29
TABLE 4 T-YEAR RETURN PERIOD GUMBELL DISTRIBUTION
c. T-year return period rainfall
𝑋𝑡 = 𝑋𝑟 + (𝐾. 𝜎) 3
Note, Xt = T period Rainfall; Xr = average rainfall. The result of the calculation T-year return period Gumbell method are shown in table 4.
2. Log Pearsson III Distribution
TABLE 5 CALCULATION LOG PEARSSON III
a. The average of data
c. Coefficient of Skewness
6 Cs = 0,3156
Cs = 0.135559 and the value of factor Gt for the Log Pearson III distribution Return Period
can be calculated in the interpolation in the table 6.
TABLE 6 INTERPOLATION OF Gt VALUE
d. T- year return periode ranfall
7
2000 134.84 2.1298323 -0.39159082 0.15334337 0.003605745
2001 50.97 1.7073541 0.03088739 0.000954031 8.68336E-10
2002 158.94 2.2012466 -0.46300511 0.214373728 0.009851779
2003 53.01 1.7243198 0.01392172 0.000193814 7.28043E-12
2004 56.88 1.7549522 -0.0167107 0.000279247 2.17755E-11
2005 61.24 1.7870228 -0.04878136 0.002379621 1.34748E-08
2006 54.64 1.7374891 0.00075233 5.66E-07 1.81322E-19
2007 89.35 1.9511039 -0.21286247 0.045310431 9.30239E-05
2008 91.31 1.9605039 -0.22226237 0.049400563 0.000120558
2009 69.72 1.8433597 -0.1051182 0.011049835 1.34917E-06
2010 65.79 1.8181298 -0.07988836 0.006382151 2.59957E-07
2011 53.37 1.7273273 0.01091419 0.00011912 1.69024E-12
2012 53.03 1.724493 0.01374852 0.000189022 6.75361E-12
2013 92.86 1.9678481 -0.22960664 0.052719207 0.000146523
2014 59.82 1.7768811 -0.03863961 0.001493019 3.3281E-09
1145.78 27.811864 -1.73824148 0.538187725 0.013819256 ( 𝑋 𝑋 ( 𝑋 𝑋
2 5 10 25 50 100 200
Cs 0.1 -0.017 0.836 1.292 1.785 2.107 2.400 2.670
Cs 0.2 -0.033 0.830 1.301 1.818 2.159 2.472 2.763
-0.016 -0.006 0.009 0.033 0.052 0.072 0.093
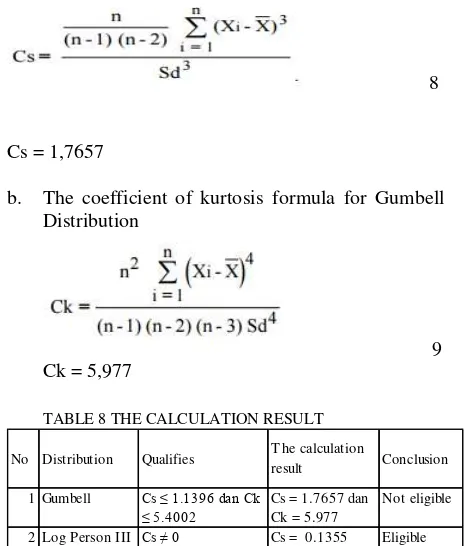
3.3 Chi-Square test
The chi square test are used to determine the rainfall. The result of the calculation shown on Table 8. The coefficient of skweness formula for Gumbell Distribution
TABLE 8 THE CALCULATION RESULT
Table 8 shows that the qualified distribution is Log Pearsson III Distribution because value of Coefficient of Kurtosis is 0.1355. the conclusion, this research use 25th rainfall period of Log Pearsson III distribution to calculate flood discharge using the formula.
3.4 Analysis the influences of land use for the amount of flood discharge using the formula.
Basin landuse area consist of landuse such as salt ponds, forests (protected forest, production forest and limited production forest), green open space and grass, farms (kebun), settlements, farms (pertanian), and fields. A large landuse on basin Kemoning are fields, farms and settlements. Details of landuse existing can be seen at table 9.
No Distribution Qualifies T he calculation
result Conclusion
TABLE 9 LANDUSE AND STREAM COEFFICIENT
Area C
Km2
Stream Coefficie
nt
1 Salt Ponds 2.15 0.2 0.43
2 Protected Forest 1.07 0.03 0.0321
3 Production Forest 8.27 0.05 0.4135 4 Limited Production Forest 0.37 0.05 0.0185
5 Green open space 1 0.1 0.1
6 Farms 14.52 0.2 2.904
7 Settlements 69.12 0.7 48.384
8 Farms 113.15 0.15 16.9725
9 Green open space (grass) 0.12 0.1 0.012
10 Fields 198.48 0.2 39.696
T otal Area 408.25 108.9626
L x C
Nmb Landuse
Table 9 show that a landuse has a highest coefficient than the other is settlement. The stream coefficient of settlement is 0.7. The smallest coefficient is protected forest (0.003). A stream coefficient indicate some landuse contribute for flood discharge. Table 6 also show that small coefficients have a small area and the high coefficients have a large area.
Flood discharged is calculated by using this formula :
Q = 0,002778 x Rainfall x (Large x Coeffisien)
Q = 0,002778 x 108,34 x 108,962
Q = 32,79 mm3/s
A higher coefficient can cause a amount of flood discharge. Sampang local government not only should increase the areas that have a small coefficient such us protected forest and production forest but also should reduce the areas that have a high coefficient to reduce amount of flood discharge.
REFERENCES
[1] Associated Programme on Flood Management, Social Aspects and Stakeholder Involvement in Integrated Flood Management, Geneva: World Meteorological Organization. 2006.
[2] Robert, J.K and Roestam Sjarief, Intergrated Water Resources Management,Yogyakarta : Andi Published. 2008.
[3] Regional Disaster Management Agency, The Report of Sampang Flood. Sampang, 2014.
[4].Regional Development Planning Agency., The Study of Grand Design of Basin Kemoning Rive,. Sampang, 2014.
[5],Agus, Eko Kurniawan, Public Participation in Integrated Flood Management of Watershed Kemoning River at Sampang Regency . Thesis, Master of Enviromental Science. Dipenogoro
University.Semarang. 2014.
[6]. Bambang,Triadmodjo, The Applied of Hidrologi, Yogyakarta, Beta Offset, 2015.
[7]. Department of Public Works of Water Resources at Kabupaten Sampang, Precipitation Data from 2010 to 2015, Sampang,2015
[8]. Soewarno, Applications Statistical Methods for Data Analysis Hydrology, Yogyakarta:Graha Ilmu.
[9].Regional DevelopmentPlanning Agency, Spatial Planning for Sampang District.Sampang, 2009.