ScienceDirect
Transportation Research Procedia 00 (2017) 000–000
www.elsevier.com/locate/procedia
2214-241X © 2017 The Authors. Published by Elsevier B.V.
Peer-review under responsibility of WORLD CONFERENCE ON TRANSPORT RESEARCH SOCIETY.
World Conference on Transport Research - WCTR 2016 Shanghai. 10-15 July 2016
The effect of accident history and socio-economics groups to
Indonesian driver behaviour
Leksmono Suryo Putranto
aAlbert Alfonsus
a*
aCivil Engineering Department. Tarumanagara University. Jl. Let.Jen.S.Parman No.1. Jakarta 11440. Indonesia
Abstract
This study was initial attempt to develop Indonesian Driver Behaviour Questionnaire followed by accident history and socio-economic groups effect to driver behaviour assessment. 30 item statements in DBQ were classified into four factors (aggressive behaviours. ordinary violations. errors. lapses). 150 respondents were interviewed. to rate their frequency of conducting 30 statement items. There were also questions on gender. age. job and accident history in the last one year. The mean diffence t-test showed that respondents with >1 accident history in the last one year tend to conduct aggressive behaviours and ordinary violations more frequently compare to other respondennts group.
© 2017 The Authors. Published by Elsevier B.V.
Peer-review under responsibility of WORLD CONFERENCE ON TRANSPORT RESEARCH SOCIETY.
Keywords:accident history. socio-economic. Indonesian. driver. behaviour
1.Introduction
Road safety is a global issue. Therefore General Assembly of United Nation declared Decade of Action (DoA) for Road Safety 2011-2020 in order to control and decrease global fatality of traffic accident victims. In Indonesia. safety has been stated as one of the objectives of traffic operation Traffic and Road Transport Law No. 22/2009. Furthermore to achieve that objective. it is mandatory to prepare National General Plan of Road Transport Safety [1]. In the general plan there was a target to decrease fatalitiy index per 10.000 vehicles from 3.93 in the base line year (2010) to 0.79 in 2035. There were five pilars in the general plan. i.e. Safety Management. Safer Road. Safer Vehicle. Safer Road User and Post Crash Victim Care. One of the program in the first pilar was road safety
* Corresponding author. Tel.: +62-81514192449; fax: +62-21-5638353.
research.
According to vehicle registration data from the Indonesian National Police, the registered private motorized vehicles such as cars and motorcycles were continuosly increasing especially in the last two decades. As car ownership and use increasing. the exposure of road user to be involved in an accident will be logiccally increased. Driver behaviour questionnaire (DBQ) has been available for many years in Western countries. Such instrument has not been developed in Indonesia. This study was an initial attempt to develop the Indonesian DBQ followed by the assessment of effect of accident history and socio-economic groups to driver behaviour. The instrument was an adaptation of Manchester DBQ developed by Lawton et al [2].
2.Previous Studies
Behaviour questionnaires were sensitive to culture difference. For example. Fergusson and Horwood [3] modified DBQ developed by Reason et al [4] to Reflect New Zealand condition. Xie and Parker [5] considered Chinese culture di developing Chinese DBQ. Similarly Lajunen et al [6] considered local culture when using Manchester DBQ in safety research in the Netherland and Finland.
The DBQ initially classified driver behaviour into three types: lapses, errors and violations Reason et al [4]. Lapses involve behaviours reflecting problems with memory and attention. and are relatively harmless (e.g. forgetting where the car was parked). Lapses are more often reported by female and elderly drivers [4]. Unlike lapses. errors are potentially dangerous driving mistakes embracing failures of observation and misjudgements (e.g. underestimating the speed of the oncoming vehicle). According to previous studies. errors are not associated with any particular demographic group [4]. Violations. can be defined as deliberate deviations from safe driving practises. Violations include such behaviours as speeding. tailgating and violate red traffic lights. Violations are more often reported by young drivers and male drivers. The violations-scale was later divided into two scales: aggressive violations and ordinary violations [4]. Aggressive violations include an interpersonal aggressive component (e.g. sounding the horn to indicate annoyance) whereas ordinary violations are traffic code violations or risky driving behaviours without any aggressive content.
The data collection strategy (public vs. private) seems to influence the trustworthiness of the self-reports to some degree. It can be supposed. for example. that responding anonymously to a postal survey leads to less socially desirable responses than a roadside survey conducted by the police [7]. Another possible cause of socially desirable responses is uniform patern of indicator (questionnaire items).Therefore questionnaire items should be a proportional combination of favourable and unfavourable items.
In a study predicting severe crash and injury outcome. Kim et al. [8] found that driver behavior and alcohol or drug use mediate the link between driver characteristics (i.e. age and gender), crash type and injury severity.
3.Methodology
As stated before. The Indonesian DBQ was an adaptation of Manchester DBQ. After a content validity process during a focus group discussion. one indicator regarding the automatic transmission was dropped. All remaining 30 item statements were statistically valid and reliable on 0.05 significant level. To avoid social desirability. there were 20 favourable items and 10 unfavourable items. The items were classified into four factors. i.e. aggressive behaviours. ordinary violations. errors and lapses. 150 respondents (90 males and 60 females) from Tarumanagara University (students. employees and lecturers) were interviewed. The respondents were asked to rate their frequency of conducting 30 statement items. Besides behavioural questions. there were also questions on gender. age. job and accident history in the last one year. These groupings were used to conduct mean difference t-test.
4. The Indonesian DBQ and Summary of the Data
Table 1. Mean score of respondent responses on aggressive behaviour indicators
Indicators Mean
Sound your horn to indicate your annoyance to another road user 2.43
Become angered by another driver and give chase with the intention of giving him/her a piece of your mind 1.63
Become angered by a certain type of a driver and indicate your hostility by whatever means you can 1.75
Driving impatiently and frequently overtake other vehicle 2.38
Table 2. Mean score of respondent responses on ordinary violation indicators
Indicators Mean
Pull out of a junction so far that the driver with right of way has to stop and let you out 1.64
Stay in a motorway lane that you know will be closed ahead until the last minute before forcing your way into the other lane 1.72
Overtake a slow driver on the inside 2.23
Race away from traffic lights with the intention of beating the driver next to you 1.61
Drive so close to the car in front that it would be difficult to stop in an emergency 1.60
Cross a junction knowing that the traffic lights have already turned against you 1.68
Disregard the speed limit on a motorway 2.16
Stopping in the shoulder in non-emergency situation 1.73
Using mobile phone while driving 2.74
Driving on bus lane to avoid congestion 1.89
Table 3. Mean score of respondent responses on error indicators
Indicators Mean
Queuing to turn left onto a main road. you pay such close attention to the main stream of traffic that you nearly hit the car in front of you 1.75
Fail to notice that pedestrians are crossing when turning into a side street from a main road 1.86
Fail to check your rear-view mirror before pulling out, changing lanes. etc 2.17
Attempt to overtake someone that you had not noticed to be signaling a right turn saya 2.33
Underestimate the speed of an oncoming vehicle when overtaking 1.97
Driving before ready to drive 1.59
Driving on uncomfortable sitting position 1.92
Skipping car routine maintenance 1.79
Late recovery from glare 2.75
Table 4. Mean score of respondent responses on lapse indicators
Indicators Mean
Hit something when reversing that you had not previously seen 1.50 Intending to drive to destination A. you “wake up” to find yourself on the road to destination B 1.98 Get into the wrong lane approaching a roundabout or a junction 1.79
Switch one thing. such as the headlights. when you meant to switch on something else. such as the wipers 1.91
Realize that you have no clear recollection of the road along which you have just been traveling 2.09
Need to restart the engine frequently during driving due to limited driving experience 1.61
Suddenly braking
from the respondents were varied from 1 to 5 except in two indicators in ordinary violations “stay in a motorway lane that you know will be closed ahead until the last minute before forcing your way into the other lane” and “race away from traffic lights with the intention of beating the driver next to you” which were varied from 1 to 4.
It seems that mean scores of indicators within lapses were relatively the lowest. Most of them were under 2.00. except one indicator. i.e. “Realize that you have no clear recollection of the road along which you have just been traveling” with mean score of 2.09. Even the smallest mean score (1.50) was for indicator within lapses. i.e. “Hit something when reversing that you had not previously seen”.
Indicators with highest mean scores were “Late recovery from glare” (2.75) within errors and “Using mobile phone while driving” (2.74) within ordinary violation. Interestingly both indicators were not originally from Manchester DBQ. They were part of nine additional indicators in the developement of Indonesian DBQ proposed during focus group discussion evaluating Manchester DBQ (to delete irrelevant indicators and to add Indonesian specific driver behaviour indicators. Indicator related to recovery from glare was very relevant to Indonesian driver behaviour. It is not necessarily due to low skill of driver. but more related to unsafe design/ operation of certain highways. The use of mobile phone whilst driving was serious behavioural problem within Indonesian drivers. Although in Indonesian Traffic Law Article 283 it was clearly stated that “Anyone who drive motorized vehicle in the road improperly and in the same time conducting other activities or affected by certain condition causing disruption on driving concentration as mentioned in Article 106 of this law can be improsoned for maaximum three months or can be fined for maximum Rp. 750.000.- (about USD 55 in August 2015 currency exchange rate) this type of traffic violation was quite common in daily practice due to inconsistent law enforcement.
5.Effect of Socio-Economic Characteristics and, Accident History to Driver Behaviour
Several mean difference t-tests were conducted to understand the effect of some socio-economic characteristics (gender, age group, student/ non-student, etc) and accident history to driver behaviour grouped in aggresive behaviours, ordinary violations, errors and lapses. A 0.05 significant level was used. The summaries were reported in Table 5 to Table 10.
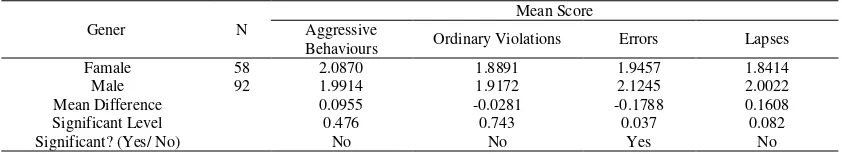
It can be seen in Table 5 that the only significantly different mean score between male and female respondents were in in errors. Male respondents tend to conduct errors behaviour more frequently compare to female respondents. Usually errors were more related to driving skill. So common asumption that female drivers were less skillfull than male drivers might not be correct.
Table 5. Mean difference between female and male in four groups of indicators
Gener N
Mean Score Aggressive
Behaviours Ordinary Violations Errors Lapses Famale
Male Mean Difference Significant Level Significant? (Yes/ No)
58 2.0870 1.8891 1.9457 1.8414
92 1.9914 1.9172 2.1245 2.0022
0.0955 -0.0281 -0.1788 0.1608
0.476 No
0.743 No
0.037 Yes
0.082 No
It can be seen in Table 6 that compare to non-students, students were more frequently conduct aggresive behaviours, ordinary violations, erros and lapses. Aggressive behaviorus and ordinary violations might be caused by their young age which potentially trigger more often risky behaviours. Younger age might also the trigger of errors as their driving experience were less than older respondents. It was surprising that compare to non-students, students were more frequentyly conduct lapses. According to Reason et al [4] lapses were more frequently conducted by elderly drivers .
Table 6. Mean difference between student and non-students in four groups of indicators
Status N
Mean Score Aggressive
Behaviours Ordinary Violations Errors Lapses Students
Table 7. Mean difference between different origin in four groups of indicators
The Origin N
Mean Score Aggressive
Behaviours Ordinary Violations Errors Lapses Greater Jakarta
According to Table 8, compare to the respondents who live in Greater Jakarta, respondents who live in Jakarta were more frequently conduct ordinary violations and errors. The drivers from Jakarta might possibly expossed to more frequent daily traffic congestion compare to drivers from Greater Jakarta.
Table 8. Mean difference between students and non-students Jakarta and Greater Jakarta in four groups of indicators
Residence N
Mean Score Aggressive
Behaviours Ordinary Violations Errors Lapses Jakarta
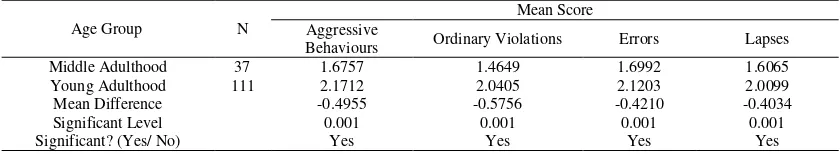
It can be seen in Table 9 that compare to middle adulthood respondents, young adulthood respondents were more frequently conduct aggresive behaviours, ordinary violations, erros and lapses. The explanations were similar with the interpretation of results from Table 6, although the age groups were different. The respondents who were categorized as students in this research were usually under between 18 and 24 years old, whereas resepondents in young adult age group were under 40 years old. The respondents who were categorized as non-students were usualy between 25 and 56 years old, whereas respondents in middle aulthood were between 40-60. However the interpretation of both tables were the same, including the suprising finding in lapses.
Table 9. Mean difference between middle adulthood respondents and young adulthood resepondents in four groups of indicators
Age Group N
Mean Score Aggressive
Behaviours Ordinary Violations Errors Lapses Middle Adulthood
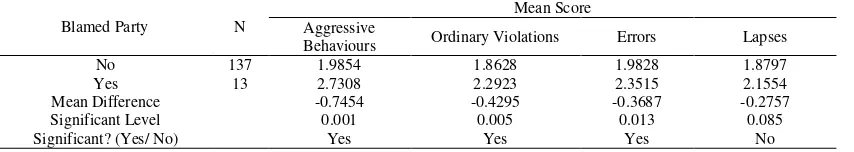
conducting risky behaviours tend to involve in at least an accident. Moreover from Table 11, it was found that respondents who were in blamed party in the accident in the last one year were more likely to conduct aggressive behaviours, ordinary violations and errors.
Table 10. Mean difference between accident and no-accident in four groups of indicators
Accident within A Year N
Mean Score Aggressive
Behaviours Ordinary Violations Errors Lapses ≥ 1 times
Table 11. Mean difference between blamed party and non-blamed in in four groups of indicators
Blamed Party N
Mean Score Aggressive
Behaviours Ordinary Violations Errors Lapses No study in either some or all groups of indicators (aggressive behaviorus, ordinary violations, errors and lapses). For further studies it is recommended to take sample from wider driver population.
References
[1] _____. 2011. National General Plan of Road Transport Safety.
[2] Lawton, R, Parker, D., Stradling, S, Manstead, A. The role of affect in predicting social behaviours : The case of road traffic violations.
Journal of Applied Social Psychology 1997; 27: 1258-1276.
[3] Fergusson, DM, Horwood, LJ. 2000. Drink Driving and Traffic Accidents in Young People. Accident Analysis and Prevention 2000; 32: 805-814.
[4] Reason, J, Manstead, A, Stradling, S, Parker, D, Baxter, J. The Social and Cognitive Determinants of Aberrant Driving Behaviour, Contractors Report 253. Crowthorne:Transport Research Laboratory; 1991.
[5] Xie, CQ, Parker, D, 2002. A Social Psychological Approach to Driving Violations in Two Chinese Cities. Transportation Research Part F; 5: 293-308.
[6] Lajunen, T, Parker, D, Summala, H. The Manchester Driver Behaviour Questionnaire: A Cross-Cultural Study. Accident Analysis and Prevention 2004; 36: 231-238.
[7] Lajunen, T, Summala, H. Can we trust self-reports of driving? Effects of impression management on driver behaviour questionnaire responses. Transportation Research Part F 2003; 6: 97-107.