TABLE 1
Standard normal curve areas
z .00 .01 .02 .03 .04 .05 .06 .07 .08 .09
⫺3.4 .0003 .0003 .0003 .0003 .0003 .0003 .0003 .0003 .0003 .0002
⫺3.3 .0005 .0005 .0005 .0004 .0004 .0004 .0004 .0004 .0004 .0003
⫺3.2 .0007 .0007 .0006 .0006 .0006 .0006 .0006 .0005 .0005 .0005
⫺3.1 .0010 .0009 .0009 .0009 .0008 .0008 .0008 .0008 .0007 .0007
⫺3.0 .0013 .0013 .0013 .0012 .0012 .0011 .0011 .0011 .0010 .0010
⫺2.9 .0019 .0018 .0018 .0017 .0016 .0016 .0015 .0015 .0014 .0014
⫺2.8 .0026 .0025 .0024 .0023 .0023 .0022 .0021 .0021 .0020 .0019
⫺2.7 .0035 .0034 .0033 .0032 .0031 .0030 .0029 .0028 .0027 .0026
⫺2.6 .0047 .0045 .0044 .0043 .0041 .0040 .0039 .0038 .0037 .0036
⫺2.5 .0062 .0060 .0059 .0057 .0055 .0054 .0052 .0051 .0049 .0048
⫺2.4 .0082 .0080 .0078 .0075 .0073 .0071 .0069 .0068 .0066 .0064
⫺2.3 .0107 .0104 .0102 .0099 .0096 .0094 .0091 .0089 .0087 .0084
⫺2.2 .0139 .0136 .0132 .0129 .0125 .0122 .0119 .0116 .0113 .0110
⫺2.1 .0179 .0174 .0170 .0166 .0162 .0158 .0154 .0150 .0146 .0143
⫺2.0 .0228 .0222 .0217 .0212 .0207 .0202 .0197 .0192 .0188 .0183
⫺1.9 .0287 .0281 .0274 .0268 .0262 .0256 .0250 .0244 .0239 .0233
⫺1.8 .0359 .0351 .0344 .0336 .0329 .0322 .0314 .0307 .0301 .0294
⫺1.7 .0446 .0436 .0427 .0418 .0409 .0401 .0392 .0384 .0375 .0367
⫺1.6 .0548 .0537 .0526 .0516 .0505 .0495 .0485 .0475 .0465 .0455
⫺1.5 .0668 .0655 .0643 .0630 .0618 .0606 .0594 .0582 .0571 .0559
⫺1.4 .0808 .0793 .0778 .0764 .0749 .0735 .0721 .0708 .0694 .0681
⫺1.3 .0968 .0951 .0934 .0918 .0901 .0885 .0869 .0853 .0838 .0823
⫺1.2 .1151 .1131 .1112 .1093 .1075 .1056 .1038 .1020 .1003 .0985
⫺1.1 .1357 .1335 .1314 .1292 .1271 .1251 .1230 .1210 .1190 .1170
⫺1.0 .1587 .1562 .1539 .1515 .1492 .1469 .1446 .1423 .1401 .1379
⫺.9 .1841 .1814 .1788 .1762 .1736 .1711 .1685 .1660 .1635 .1611
⫺.8 .2119 .2090 .2061 .2033 .2005 .1977 .1949 .1922 .1894 .1867
⫺.7 .2420 .2389 .2358 .2327 .2296 .2266 .2236 .2206 .2177 .2148
⫺.6 .2743 .2709 .2676 .2643 .2611 .2578 .2546 .2514 .2483 .2451
⫺.5 .3085 .3050 .3015 .2981 .2946 .2912 .2877 .2843 .2810 .2776
⫺.4 .3446 .3409 .3372 .3336 .3300 .3264 .3228 .3192 .3156 .3121
⫺.3 .3821 .3783 .3745 .3707 .3669 .3632 .3594 .3557 .3520 .3483
⫺.2 .4207 .4168 .4129 .4090 .4052 .4013 .3974 .3936 .3897 .3859
⫺.1 .4602 .4562 .4522 .4483 .4443 .4404 .4364 .4325 .4286 .4247
⫺.0 .5000 .4960 .4920 .4880 .4840 .4801 .4761 .4721 .4681 .4641
z Area
⫺3.50 .00023263 ⫺4.00 .00003167 ⫺4.50 .00000340 ⫺5.00 .00000029 .00000000
Source: Computed by M. Longnecker using the R function pnorm (z). ⫺⬁
Shaded area = Pr(Z z)
z .00 .01 .02 .03 .04 .05 .06 .07 .08 .09
.0 .5000 .5040 .5080 .5120 .5160 .5199 .5239 .5279 .5319 .5359
.1 .5398 .5438 .5478 .5517 .5557 .5596 .5636 .5675 .5714 .5753
.2 .5793 .5832 .5871 .5910 .5948 .5987 .6026 .6064 .6103 .6141
.3 .6179 .6217 .6255 .6293 .6331 .6368 .6406 .6443 .6480 .6517
.4 .6554 .6591 .6628 .6664 .6700 .6736 .6772 .6808 .6844 .6879
.5 .6915 .6950 .6985 .7019 .7054 .7088 .7123 .7157 .7190 .7224
.6 .7257 .7291 .7324 .7357 .7389 .7422 .7454 .7486 .7517 .7549
.7 .7580 .7611 .7642 .7673 .7704 .7734 .7764 .7794 .7823 .7852
.8 .7881 .7910 .7939 .7967 .7995 .8023 .8051 .8078 .8106 .8133
.9 .8159 .8186 .8212 .8238 .8264 .8289 .8315 .8340 .8365 .8389
1.0 .8413 .8438 .8461 .8485 .8508 .8531 .8554 .8577 .8599 .8621
1.1 .8643 .8665 .8686 .8708 .8729 .8749 .8770 .8790 .8810 .8830
1.2 .8849 .8869 .8888 .8907 .8925 .8944 .8962 .8980 .8997 .9015
1.3 .9032 .9049 .9066 .9082 .9099 .9115 .9131 .9147 .9162 .9177
1.4 .9192 .9207 .9222 .9236 .9251 .9265 .9279 .9292 .9306 .9319
1.5 .9332 .9345 .9357 .9370 .9382 .9394 .9406 .9418 .9429 .9441
1.6 .9452 .9463 .9474 .9484 .9495 .9505 .9515 .9525 .9535 .9545
1.7 .9554 .9564 .9573 .9582 .9591 .9599 .9608 .9616 .9625 .9633
1.8 .9641 .9649 .9656 .9664 .9671 .9678 .9686 .9693 .9699 .9706
1.9 .9713 .9719 .9726 .9732 .9738 .9744 .9750 .9756 .9761 .9767
2.0 .9772 .9778 .9783 .9788 .9793 .9798 .9803 .9808 .9812 .9817
2.1 .9821 .9826 .9830 .9834 .9838 .9842 .9846 .9850 .9854 .9857
2.2 .9861 .9864 .9868 .9871 .9875 .9878 .9881 .9884 .9887 .9890
2.3 .9893 .9896 .9898 .9901 .9904 .9906 .9909 .9911 .9913 .9916
2.4 .9918 .9920 .9922 .9925 .9927 .9929 .9931 .9932 .9934 .9936
2.5 .9938 .9940 .9941 .9943 .9945 .9946 .9948 .9949 .9951 .9952
2.6 .9953 .9955 .9956 .9957 .9959 .9960 .9961 .9962 .9963 .9964
2.7 .9965 .9966 .9967 .9968 .9969 .9970 .9971 .9972 .9973 .9974
2.8 .9974 .9975 .9976 .9977 .9977 .9978 .9979 .9979 .9980 .9981
2.9 .9981 .9982 .9982 .9983 .9984 .9984 .9985 .9985 .9986 .9986
3.0 .9987 .9987 .9987 .9988 .9988 .9989 .9989 .9989 .9990 .9990
3.1 .9990 .9991 .9991 .9991 .9992 .9992 .9992 .9992 .9993 .9993
3.2 .9993 .9993 .9994 .9994 .9994 .9994 .9994 .9995 .9995 .9995
3.3 .9995 .9995 .9995 .9996 .9996 .9996 .9996 .9996 .9996 .9997
3.4 .9997 .9997 .9997 .9997 .9997 .9997 .9997 .9997 .9997 .9998
z Area
3.50 .99976737 4.00 .99996833 4.50 .99999660 5.00 .99999971
An Introduction to Statistical
Methods and Data Analysis
Sixth Edition
R. Lyman Ott
Michael Longnecker
Texas A&M University
R. Lyman Ott, Michael Longnecker
Senior Acquiring Sponsoring Editor: Molly Taylor
Assistant Editor: Dan Seibert Editorial Assistant: Shaylin Walsh Media Manager: Catie Ronquillo Marketing Manager: Greta Kleinert Marketing Assistant: Angela Kim Marketing Communications Manager:
Mary Anne Payumo
Project Manager, Editorial Production: Jennifer Risden
Creative Director: Rob Hugel Art Director: Vernon Boes Print Buyer: Judy Inouye
Permissions Editor: Roberta Broyer Production Service: Macmillan Publishing
Solutions
Text Designer: Helen Walden Copy Editor: Tami Taliferro
Illustrator: Macmillan Publishing Solutions Cover Designer: Hiroko Chastain/
Cuttriss & Hambleton
Cover Images: Professor with medical model of head educating students: Scott Goldsmith/Getty Images; dollar diagram: John Foxx/Getty Images; multi-ethnic business people having meeting: Jon Feingersh/Getty Images; technician working in a laboratory: © istockphoto.com/Rich Legg; physical background with graphics and formulas: © istockphoto.com/Ivan Dinev; students engrossed in their books in the college library: © istockphoto.com/Chris Schmidt; group of colleagues working together on a project: © istockphoto.com/Chris Schmidt; mathematical assignment on a chalkboard: © istockphoto.com/Bart Coenders
Compositor: Macmillan Publishing Solutions
ALL RIGHTS RESERVED. No part of this work covered by the copyright herein may be reproduced, transmitted, stored, or used in any form or by any means graphic, electronic, or mechanical, including but not limited to photocopying, recording, scanning, digitizing, taping, Web distribution, information networks, or information storage and retrieval systems, except as permitted under Section 107or 108of the 1976 United States Copyright Act, without the prior written permission of the publisher.
Library of Congress Control Number: 2008931280
ISBN-13: 978-0-495-01758-5
ISBN-10: 0-495-01758-2
Brooks/Cole 10 Davis Drive
Belmont, CA 94002-3098 USA
Cengage Learning is a leading provider of customized learning solutions with office locations around the globe, including Singapore, the United Kingdom, Australia, Mexico, Brazil, and Japan. Locate your local office at www.cengage.com/international.
Cengage Learning products are represented in Canada by Nelson Education, Ltd.
To learn more about Brooks/Cole, visit www.cengage.com/brookscole
Purchase any of our products at your local college store or at our preferred online store www.ichapters.com.
For product information and technology assistance, contact us at Cengage Learning Customer & Sales Support, 1-800-354-9706.
For permission to use material from this text or product, submit all requests online at www.cengage.com/permissions.
Further permissions questions can be e-mailed to [email protected].
Printed in Canada
v
Contents
Preface
xi
P A R T 1
Introduction
1
CHAPTER 1
Statistics and the Scientific Method
2
1.1 Introduction 2
1.2 Why Study Statistics? 6
1.3 Some Current Applications of Statistics 8
1.4 A Note to the Student 12
1.5 Summary 13
1.6 Exercises 13
P A R T 2
Collecting Data
15
CHAPTER 2
Using Surveys and Experimental Studies
to Gather Data
16
2.1 Introduction and Abstract of Research Study 16
2.2 Observational Studies 18
2.3 Sampling Designs for Surveys 24
2.4 Experimental Studies 30
2.5 Designs for Experimental Studies 35
2.6 Research Study: Exit Polls versus Election Results 46
2.7 Summary 47
P A R T 3
Summarizing Data
55
CHAPTER 3
Data Description
56
3.1 Introduction and Abstract of Research Study 56
3.2 Calculators, Computers, and Software Systems 61
3.3 Describing Data on a Single Variable: Graphical Methods 62
3.4 Describing Data on a Single Variable: Measures of Central Tendency 78
3.5 Describing Data on a Single Variable: Measures of Variability 85
3.6 The Boxplot 97
3.7 Summarizing Data from More Than One Variable: Graphs and Correlation 102
3.8 Research Study: Controlling for Student Background in the Assessment of Teaching 112
3.9 Summary and Key Formulas 116
3.10 Exercises 117
CHAPTER 4
Probability and Probability Distributions
140
4.1 Introduction and Abstract of Research Study 140
4.2 Finding the Probability of an Event 144
4.3 Basic Event Relations and Probability Laws 146
4.4 Conditional Probability and Independence 149
4.5 Bayes’ Formula 152
4.6 Variables: Discrete and Continuous 155
4.7 Probability Distributions for Discrete Random Variables 157
4.8 Two Discrete Random Variables: The Binomial and the Poisson 158
4.9 Probability Distributions for Continuous Random Variables 168
4.10 A Continuous Probability Distribution: The Normal Distribution 171
4.11 Random Sampling 178
4.12 Sampling Distributions 181
4.13 Normal Approximation to the Binomial 191
4.14 Evaluating Whether or Not a Population Distribution Is Normal 194
4.15 Research Study: Inferences about Performance-Enhancing Drugs among Athletes 199
4.16 Minitab Instructions 201
4.17 Summary and Key Formulas 203
4.18 Exercises 203
P A R T 4
Analyzing Data, Interpreting the Analyses,
and Communicating Results
221
CHAPTER 5
Inferences about Population Central Values
222
5.1 Introduction and Abstract of Research Study 222
5.2 Estimation of m 225
5.3 Choosing the Sample Size for Estimating m 230
5.4 A Statistical Test for m 232
5.6 The Level of Significance of a Statistical Test 246
5.7 Inferences about mfor a Normal Population, sUnknown 250
5.8 Inferences about mWhen Population Is Nonnormal and nIs Small: Bootstrap Methods 259
5.9 Inferences about the Median 265
5.10 Research Study: Percent Calories from Fat 270
5.11 Summary and Key Formulas 273
5.12 Exercises 275
CHAPTER 6
Inferences Comparing Two Population Central Values
290
6.1 Introduction and Abstract of Research Study 290
6.2 Inferences about m1⫺m2: Independent Samples 293
6.3 A Nonparametric Alternative: The Wilcoxon Rank Sum Test 305
6.4 Inferences about m1⫺m2: Paired Data 314
6.5 A Nonparametric Alternative: The Wilcoxon Signed-Rank Test 319
6.6 Choosing Sample Sizes for Inferences about m1⫺m2 323
6.7 Research Study: Effects of Oil Spill on Plant Growth 325
6.8 Summary and Key Formulas 330
6.9 Exercises 333
CHAPTER 7
Inferences about Population Variances
360
7.1 Introduction and Abstract of Research Study 360
7.2 Estimation and Tests for a Population Variance 362
7.3 Estimation and Tests for Comparing Two Population Variances 369
7.4 Tests for Comparing t⬎2 Population Variances 376
7.5 Research Study: Evaluation of Method for Detecting E. coli 381
7.6 Summary and Key Formulas 386
7.7 Exercises 387
CHAPTER 8
Inferences about More Than Two Population Central Values
402
8.1 Introduction and Abstract of Research Study 402
8.2 A Statistical Test about More Than Two Population Means: An Analysis of Variance 405
8.3 The Model for Observations in a Completely Randomized Design 414
8.4 Checking on the AOV Conditions 416
8.5 An Alternative Analysis: Transformations of the Data 421
8.6 A Nonparametric Alternative: The Kruskal–Wallis Test 428
8.7 Research Study: Effect of Timing on the Treatment of Port-Wine Stains with Lasers 431
8.8 Summary and Key Formulas 436
8.9 Exercises 438
CHAPTER 9
Multiple Comparisons
451
9.1 Introduction and Abstract of Research Study 451
9.2 Linear Contrasts 454
9.3 Which Error Rate Is Controlled? 460
9.4 Fisher’s Least Significant Difference 463
9.5 Tukey’s WProcedure 468
9.6 Student–Newman–Keuls Procedure 471
9.7 Dunnett’s Procedure: Comparison of Treatments to a Control 474
9.8 Scheffé’s SMethod 476
9.9 A Nonparametric Multiple-Comparison Procedure 478
9.10 Research Study: Are Interviewers’ Decisions Affected by Different Handicap Types? 482
9.11 Summary and Key Formulas 488
9.12 Exercises 490
CHAPTER 10
Categorical Data
499
10.1 Introduction and Abstract of Research Study 499
10.2 Inferences about a Population Proportion p 500
10.3 Inferences about the Difference between Two Population Proportions, p1⫺p2 507
10.4 Inferences about Several Proportions: Chi-Square Goodness-of-Fit Test 513
10.5 Contingency Tables: Tests for Independence and Homogeneity 521
10.6 Measuring Strength of Relation 528
10.7 Odds and Odds Ratios 530
10.8 Combining Sets of 2 ⫻2 Contingency Tables 535
10.9 Research Study: Does Gender Bias Exist in the Selection of Students for Vocational Education? 538
10.10 Summary and Key Formulas 545
10.11 Exercises 546
CHAPTER 11
Linear Regression and Correlation 572
11.1 Introduction and Abstract of Research Study 572
11.2 Estimating Model Parameters 581
11.3 Inferences about Regression Parameters 590
11.4 Predicting New yValues Using Regression 594
11.5 Examining Lack of Fit in Linear Regression 598
11.6 The Inverse Regression Problem (Calibration) 605
11.7 Correlation 608
11.8 Research Study: Two Methods for Detecting E. coli 616
11.9 Summary and Key Formulas 621
11.10 Exercises 623
CHAPTER 12
Multiple Regression and the General Linear Model
664
12.1 Introduction and Abstract of Research Study 664
12.2 The General Linear Model 674
12.3 Estimating Multiple Regression Coefficients 675
12.4 Inferences in Multiple Regression 683
12.5 Testing a Subset of Regression Coefficients 691
12.7 Comparing the Slopes of Several Regression Lines 697
12.8 Logistic Regression 701
12.9 Some Multiple Regression Theory (Optional) 708
12.10 Research Study: Evaluation of the Performance of an Electric Drill 715
12.11 Summary and Key Formulas 722
12.12 Exercises 724
CHAPTER 13
Further Regression Topics
763
13.1 Introduction and Abstract of Research Study 763
13.2 Selecting the Variables (Step 1) 764
13.3 Formulating the Model (Step 2) 781
13.4 Checking Model Assumptions (Step 3) 797
13.5 Research Study: Construction Costs for Nuclear Power Plants 817
13.6 Summary and Key Formulas 824
13.7 Exercises 825
CHAPTER 14
Analysis of Variance for Completely Randomized Designs
878
14.1 Introduction and Abstract of Research Study 878
14.2 Completely Randomized Design with a Single Factor 880
14.3 Factorial Treatment Structure 885
14.4 Factorial Treatment Structures with an Unequal Number of Replications 910
14.5 Estimation of Treatment Differences and Comparisons of Treatment Means 917
14.6 Determining the Number of Replications 921
14.7 Research Study: Development of a Low-Fat Processed Meat 926
14.8 Summary and Key Formulas 931
14.9 Exercises 932
CHAPTER 15
Analysis of Variance for Blocked Designs
950
15.1 Introduction and Abstract of Research Study 950
15.2 Randomized Complete Block Design 951
15.3 Latin Square Design 963
15.4 Factorial Treatment Structure in a Randomized Complete Block Design 974
15.5 A Nonparametric Alternative—Friedman’s Test 978
15.6 Research Study: Control of Leatherjackets 982
15.7 Summary and Key Formulas 987
15.8 Exercises 989
CHAPTER 16
The Analysis of Covariance
1009
16.1 Introduction and Abstract of Research Study 1009
16.2 A Completely Randomized Design with One Covariate 1012
16.3 The Extrapolation Problem 1023
16.4 Multiple Covariates and More Complicated Designs 1026
16.5 Research Study: Evaluation of Cool-Season Grasses for Putting Greens 1028
16.6 Summary 1034
16.7 Exercises 1034
CHAPTER 17
Analysis of Variance for Some Fixed-, Random-,
and Mixed-Effects Models
1041
17.1 Introduction and Abstract of Research Study 1041
17.2 A One-Factor Experiment with Random Treatment Effects 1044
17.3 Extensions of Random-Effects Models 1048
17.4 Mixed-Effects Models 1056
17.5 Rules for Obtaining Expected Mean Squares 1060
17.6 Nested Factors 1070
17.7 Research Study: Factors Affecting Pressure Drops Across Expansion Joints 1075
17.8 Summary 1080
17.9 Exercises 1081
CHAPTER 18
Split-Plot, Repeated Measures, and Crossover Designs
1091
18.1 Introduction and Abstract of Research Study 1091
18.2 Split-Plot Designed Experiments 1095
18.3 Single-Factor Experiments with Repeated Measures 1101
18.4 Two-Factor Experiments with Repeated Measures on One of the Factors 1105
18.5 Crossover Designs 1112
18.6 Research Study: Effects of Oil Spill on Plant Growth 1120
18.7 Summary 1122
18.8 Exercises 1122
CHAPTER 19
Analysis of Variance for Some Unbalanced Designs
1135
19.1 Introduction and Abstract of Research Study 1135
19.2 A Randomized Block Design with One or More Missing Observations 1137
19.3 A Latin Square Design with Missing Data 1143
19.4 Balanced Incomplete Block (BIB) Designs 1148
19.5 Research Study: Evaluation of the Consistency of Property Assessments 1155
19.6 Summary and Key Formulas 1159
19.7 Exercises 1160
Appendix: Statistical Tables
1169
Answers to Selected Exercises
1210
References
1250
xi
Preface
Intended Audience
An Introduction to Statistical Methods and Data Analysis,Sixth Edition, provides a broad overview of statistical methods for advanced undergraduate and graduate students from a variety of disciplines. This book is intended to prepare students to solve problems encountered in research projects, to make decisions based on data in general settings both within and beyond the university setting, and finally to be-come critical readers of statistical analyses in research papers and in news reports. The book presumes that the students have a minimal mathematical background (high school algebra) and no prior course work in statistics. The first eleven chap-ters of the textbook present the material typically covered in an introductory statis-tics course. However, this book provides research studies and examples that connect the statistical concepts to data analysis problems, which are often encountered in undergraduate capstone courses. The remaining chapters of the book cover regres-sion modeling and design of experiments. We develop and illustrate the statistical techniques and thought processes needed to design a research study or experiment and then analyze the data collected using an intuitive and proven four-step approach. This should be especially helpful to graduate students conducting their MS thesis and PhD dissertation research.
Major Features of Textbook
Learning from Data
In this text, we approach the study of statistics by considering a four-step process by which we can learn from data:
1. Designing the Problem
2. Collecting the Data
3. Summarizing the Data
Case Studies
In order to demonstrate the relevance and critical nature of statistics in solving real-world problems, we introduce the major topic of each chapter using a case study. The case studies were selected from many sources to illustrate the broad applica-bility of statistical methodology. The four-step learning from data process is illus-trated through the case studies. This approach will hopefully assist in overcoming the natural initial perception held by many people that statistics is just another “math course.’’ The introduction of major topics through the use of case studies provides a focus of the central nature of applied statistics in a wide variety of re-search and business-related studies. These case studies will hopefully provide the reader with an enthusiasm for the broad applicability of statistics and the statisti-cal thought process that the authors have found and used through their many years of teaching, consulting, and R & D management. The following research studies illustrate the types of studies we have used throughout the text.
● Exit Poll versus Election Results: A study of why the exit polls from 9
of 11 states in the 2004 presidential election predicted John Kerry as the winner when in fact President Bush won 6 of the 11 states.
● Evaluation of the Consistency of Property Assessors: A study to
deter-mine if county property assessors differ systematically in their determina-tion of property values.
● Effect of Timing of the Treatment of Port-Wine Stains with Lasers: A
prospective study that investigated whether treatment at a younger age would yield better results than treatment at an older age.
● Controlling for Student Background in the Assessment of Teachers: An
examination of data used to support possible improvements to the No Child Left Behind program while maintaining the important concepts of performance standards and accountability.
Each of the research studies includes a discussion of the whys and hows of the study. We illustrate the use of the four-step learning from data process with each case study. A discussion of sample size determination, graphical displays of the data, and a summary of the necessary ingredients for a complete report of the sta-tistical findings of the study are provided with many of the case studies.
Examples and Exercises
Topics Covered
This book can be used for either a one-semester or two-semester course. Chapters 1 through 11 would constitute a one-semester course. The topics covered would include:
Chapter 1—Statistics and the scientific method
Chapter 2—Using surveys and experimental studies to gather data Chapters 3 & 4—Summarizing data and probability distributions Chapters 5–7—Analyzing data: inferences about central values and variances
Chapters 8 & 9—One way analysis of variance and multiple comparisons Chapter 10—Analyzing data involving proportions
Chapter 11—Linear regression and correlation
The second semester of a two-semester course would then include model building and inferences in multiple regression analysis, logistic regression, design of exper-iments, and analysis of variance:
Chapters 11, 12, & 13—Regression methods and model building: multiple regression and the general linear model, logistic regression, and building regression models with diagnostics
Chapters 14–18—Design of experiments and analysis of variance: design concepts, analysis of variance for standard designs, analysis of covariance, random and mixed effects models, split-plot designs, repeated measures designs, crossover designs, and unbalanced designs.
Emphasis on Interpretation, not Computation
In the book are examples and exercises that allow the student to study how to calculate the value of statistical estimators and test statistics using the definitional form of the procedure. After the student becomes comfortable with the aspects of the data the statistical procedure is reflecting, we then emphasize the use of com-puter software in making computations in the analysis of larger data sets. We pro-vide output from three major statistical packages: SAS, Minitab, and SPSS. We find that this approach provides the student with the experience of computing the value of the procedure using the definition; hence the student learns the basics behind each procedure. In most situations beyond the statistics course, the stu-dent should be using computer software in making the computations for both expedience and quality of calculation. In many exercises and examples the use of the computer allows for more time to emphasize the interpretation of the results of the computations without having to expend enormous time and effort in the actual computations.
In numerous examples and exercises the importance of the following aspects of hypothesis testing are demonstrated:
1. The statement of the research hypothesis through the summarization of the researcher’s goals into a statement about population parameters.
2. The selection of the most appropriate test statistic, including sample size computations for many procedures.
3. The necessity of considering both Type I and Type II error rates (aand b) when discussing the results of a statistical test of hypotheses.
4. The importance of considering both the statistical significance of a test result and the practical significance of the results. Thus, we illustrate the importance of estimating effect sizes and the construction of confi-dence intervals for population parameters.
5. The statement of the results of the statistical in nonstatistical jargon that goes beyond the statements ‘‘reject H0’’ or ‘‘fail to reject H0.’’
New to the Sixth Edition
● A research study is included in each chapter to assist students to
appreci-ate the role applied statistics plays in the solution of practical problems. Emphasis is placed on illustrating the steps in the learning from data process.
● An expanded discussion on the proper methods to design studies and
experiments is included in Chapter 2.
● Emphasis is placed on interpreting results and drawing conclusions from
studies used in exercises and examples.
● The formal test of normality and normal probability plots are included in
Chapter 4.
● An expanded discussion of logistic regression is included in Chapter 12. ● Techniques for the calculation of sample sizes and the probability of
Type II errors for the ttest and Ftest, including designs involving the one-way AOV and factorial treatment structure, are provided in Chapters 5, 6, and 14.
● Expanded and updated exercises are provided; examples and exercises
are drawn from various disciplines, including many practical real-life problems.
● Discussion of discrete distributions and data analysis of proportions has
been expanded to include the Poisson distribution, Fisher exact test, and methodology for combining 2 ⫻2 contingency tables.
● Exercises are now placed at the end of each chapter for ease of usage.
Additional Features Retained from Previous Editions
● Many practical applications of statistical methods and data analysis from
agriculture, business, economics, education, engineering, medicine, law, political science, psychology, environmental studies, and sociology have been included.
● Review exercises are provided in each chapter.
● Computer output from Minitab, SAS, and SPSS is provided in numerous
examples and exercises. The use of computers greatly facilitates the use of more sophisticated graphical illustrations of statistical results.
● Attention is paid to the underlying assumptions. Graphical procedures
● The first chapter provides a discussion of “What is statistics?” We
pro-vide a discussion of why students should study statistics along with a dis-cussion of several major studies which illustrate the use of statistics in the solution of real-life problems.
Ancillaries
● Student Solutions Manual (ISBN-10: 0-495-10915-0;
ISBN-13: 978-0-495-10915-0), containing select worked solutions for problems in the textbook.
● A Companion Website at www.cengage.com /statistics/ott,containing
downloadable data sets for Excel, Minitab, SAS, SPSS, and others, plus additional resources for students and faculty.
● Solution Builder, available to instructors who adopt the book at
www.cengage.com /solutionbuilder.This online resource contains complete worked solutions for the text available in customizable format outputted to PDF or to a password-protected class website.
Acknowledgments
There are many people who have made valuable constructive suggestions for the development of the original manuscript and during the preparation of the subse-quent editions. Carolyn Crockett, our editor at Brooks/Cole, has been a tremendous motivator throughout the writing of this edition of the book. We are very apprecia-tive of the insightful and construcapprecia-tive comments from the following reviewers:
Mark Ecker, University of Northern Iowa
Yoon G. Kim, Humboldt State University
Monnie McGee, Southern Methodist University
Ofer Harel, University of Connecticut
Mosuk Chow, Pennsylvania State University
Juanjuan Fan, San Diego State University
Robert K. Smidt, California Polytechnic State University
Mark Rizzardi, Humboldt State University
Soloman W. Harrar, University of Montana
Bruce Trumbo, California State University—East Bay
P A R T
1
Introduction
2
CHAPTER
1
Statistics and the Scientific
Method
1.1 Introduction
1.2 Why Study Statistics? 1.3 Some Current
Applications of Statistics
1.4 A Note to the Student
1.5 Summary
1.6 Exercises
1.1
Introduction
Statistics is the science of designing studies or experiments, collecting data and modeling/analyzing data for the purpose of decision making and scientific discov-ery when the available information is both limited and variable. That is, statistics is the science of Learning from Data.
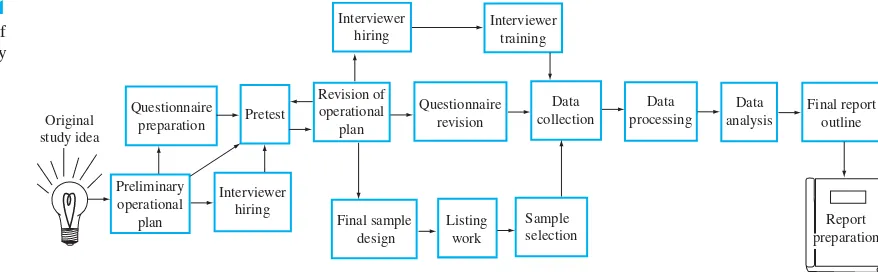
Almost everyone—including corporate presidents, marketing representa-tives, social scientists, engineers, medical researchers, and consumers—deals with data. These data could be in the form of quarterly sales figures, percent increase in juvenile crime, contamination levels in water samples, survival rates for patients un-dergoing medical therapy, census figures, or information that helps determine which brand of car to purchase. In this text, we approach the study of statistics by consid-ering the four-step process in Learning from Data: (1) defining the problem, (2) col-lecting the data, (3) summarizing the data, and (4) analyzing data, interpreting the analyses, and communicating results. Through the use of these four steps in Learn-ing from Data, our study of statistics closely parallels the Scientific Method, which is a set of principles and procedures used by successful scientists in their pursuit of knowledge. The method involves the formulation of research goals, the design of observational studies and/or experiments, the collection of data, the modeling/ analyzing of the data in the context of research goals, and the testing of hypotheses. The conclusions of these steps is often the formulation of new research goals for another study. These steps are illustrated in the schematic given in Figure 1.1.
This book is divided into sections corresponding to the four-step process in Learning from Data. The relationship among these steps and the chapters of the book is shown in Table 1.1. As you can see from this table, much time is spent dis-cussing how to analyze data using the basic methods presented in Chapters 5 –18. However, you must remember that for each data set requiring analysis, someone has defined the problem to be examined (Step 1), developed a plan for collecting data to address the problem (Step 2), and summarized the data and prepared the data for analysis (Step 3). Then following the analysis of the data, the results of the analysis must be interpreted and communicated either verbally or in written form to the intended audience (Step 4).
1.1 Introduction
3
was incomplete and contained improper information. Throughout the text, we will try to keep you focused on the bigger picture of Learning from Data through the four-step process. Most chapters will end with a summary section that emphasizes how the material of the chapter fits into the study of statistics—Learning from Data. To illustrate some of the above concepts, we will consider four situations in which the four steps in Learning from Data could assist in solving a real-world problem.
1. Problem: Monitoring the ongoing quality of a lightbulb manufacturing facility.A lightbulb manufacturer produces approximately half a million bulbs per day. The quality assurance department must monitor the TABLE 1.1
Organization of the text The Four-Step Process Chapters
1 Introduction 1 Statistics and the Scientific Method
2 Collecting Data 2 Using Surveys and Experimental Studies to Gather Data 3 Summarizing Data 3 Data Description
4 Probability and Probability Distributions 4 Analyzing Data, Interpreting 5 Inferences about Population Central Values
the Analyses, and 6 Inferences Comparing Two Population Central Values Communicating Results 7 Inferences about Population Variances
8 Inferences about More Than Two Population Central Values 9 Multiple Comparisons
10 Categorical Data
11 Linear Regression and Correlation
12 Multiple Regression and the General Linear Model 13 Further Regression Topics
14 Analysis of Variance for Completely Randomized Designs 15 Analysis of Variance for Blocked Designs
16 The Analysis of Covariance
17 Analysis of Variance for Some Fixed-, Random-, and Mixed-Effects Models
18 Split-Plot, Repeated Measures, and Crossover Designs 19 Analysis of Variance for Some Unbalanced Designs FIGURE 1.1
Scientific Method Schematic
Decisions: written conclusions,
oral presentations Formulate new
research goals: new models, new hypotheses
Inferences: graphs, estimation, hypotheses testing, model assessment Collect data:
data management Formulate research goal:
research hypotheses, models
Plan study: sample size, variables,
defect rate of the bulbs. It could accomplish this task by testing each bulb, but the cost would be substantial and would greatly increase the price per bulb. An alternative approach is to select 1,000 bulbs from the daily production of 500,000 bulbs and test each of the 1,000. The fraction of defective bulbs in the 1,000 tested could be used to estimate the fraction defective in the entire day’s production, provided that the 1,000 bulbs were selected in the proper fashion. We will demonstrate in later chapters that the fraction defective in the tested bulbs will probably be quite close to the fraction defective for the entire day’s production of 500,000 bulbs.
2. Problem: Is there a relationship between quitting smoking and gaining weight?To investigate the claim that people who quit smoking often experience a subsequent weight gain, researchers selected a random sample of 400 participants who had successfully participated in pro-grams to quit smoking. The individuals were weighed at the beginning of the program and again 1 year later. The average change in weight of the participants was an increase of 5 pounds. The investigators con-cluded that there was evidence that the claim was valid. We will develop techniques in later chapters to assess when changes are truly significant changes and not changes due to random chance.
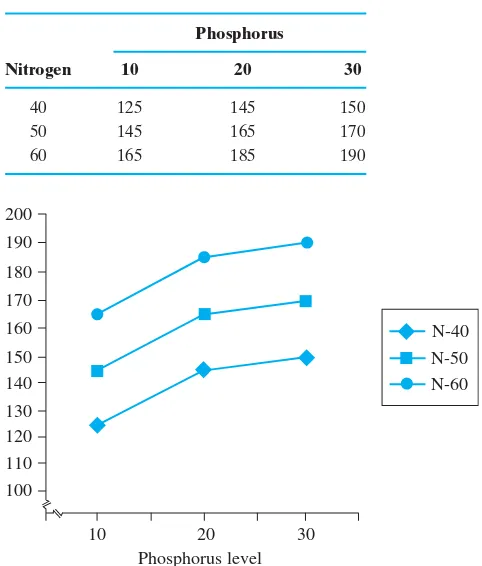
3. Problem: What effect does nitrogen fertilizer have on wheat production?
For a study of the effects of nitrogen fertilizer on wheat production, a total of 15 fields were available to the researcher. She randomly assigned three fields to each of the five nitrogen rates under investigation. The same variety of wheat was planted in all 15 fields. The fields were culti-vated in the same manner until harvest, and the number of pounds of wheat per acre was then recorded for each of the 15 fields. The experi-menter wanted to determine the optimal level of nitrogen to apply to
anywheat field, but, of course, she was limited to running experiments on a limited number of fields. After determining the amount of nitrogen that yielded the largest production of wheat in the study fields, the experimenter then concluded that similar results would hold for wheat fields possessing characteristics somewhat the same as the study fields. Is the experimenter justified in reaching this conclusion?
4. Problem: Determining public opinion toward a question, issue, product, or candidate. Similar applications of statistics are brought to mind by the frequent use of the New York Times/CBS News, Washington Post /ABC News,CNN, Harris, and Gallup polls. How can these poll-sters determine the opinions of more than 195 million Americans who are of voting age? They certainly do not contact every potential voter in the United States. Rather, they sample the opinions of a small number of potential voters, perhaps as few as 1,500, to estimate the reaction of every person of voting age in the country. The amazing result of this process is that if the selection of the voters is done in an unbiased way and voters are asked unambiguous, nonleading questions, the fraction of those persons contacted who hold a particular opinion will closely match the fraction in the total population holding that opinion at a particular time. We will supply convincing supportive evidence of this assertion in subsequent chapters.
or experiment was proposed to collect meaningful data to answer the problem. The quality assurance department had to decide both how many bulbs needed to be tested and how to select the sample of 1,000 bulbs from the total production of bulbs to obtain valid results. The polling groups must decide how many voters to sample and how to select these individuals in order to obtain information that is representative of the population of all voters. Similarly, it was necessary to care-fully plan how many participants in the weight-gain study were needed and how they were to be selected from the list of all such participants. Furthermore, what variables should the researchers have measured on each participant? Was it neces-sary to know each participant’s age, sex, physical fitness, and other health-related variables, or was weight the only important variable? The results of the study may not be relevant to the general population if many of the participants in the study had a particular health condition. In the wheat experiment, it was important to measure both the soil characteristics of the fields and the environmental condi-tions, such as temperature and rainfall, to obtain results that could be generalized to fields not included in the study. The design of a study or experiment is crucial to obtaining results that can be generalized beyond the study.
Finally, having collected, summarized, and analyzed the data, it is important to report the results in unambiguous terms to interested people. For the lightbulb example, management and technical staff would need to know the quality of their production batches. Based on this information, they could determine whether adjustments in the process are necessary. Therefore, the results of the statistical analyses cannot be presented in ambiguous terms; decisions must be made from a well-defined knowledge base. The results of the weight-gain study would be of vital interest to physicians who have patients participating in the smoking-cessation program. If a significant increase in weight was recorded for those individuals who had quit smoking, physicians may have to recommend diets so that the former smokers would not go from one health problem (smoking) to another (elevated blood pressure due to being overweight). It is crucial that a careful description of the participants—that is, age, sex, and other health-related information—be in-cluded in the report. In the wheat study, the experiment would provide farmers with information that would allow them to economically select the optimum amount of nitrogen required for their fields. Therefore, the report must contain information concerning the amount of moisture and types of soils present on the study fields. Otherwise, the conclusions about optimal wheat production may not pertain to farmers growing wheat under considerably different conditions.
To infer validly that the results of a study are applicable to a larger group than just the participants in the study, we must carefully define the population
(see Definition 1.1) to which inferences are sought and design a study in which the
sample(see Definition 1.2) has been appropriately selected from the designated population. We will discuss these issues in Chapter 2.
population
sample
1.1 Introduction
5
DEFINITION 1.1 Apopulationis the set of all measurements of interest to the sample collec-tor. (See Figure 1.2.)
1.2
Why Study Statistics?
We can think of many reasons for taking an introductory course in statistics. One reason is that you need to know how to evaluate published numerical facts. Every person is exposed to manufacturers’ claims for products; to the results of sociolog-ical, consumer, and political polls; and to the published results of scientific re-search. Many of these results are inferences based on sampling. Some inferences are valid; others are invalid. Some are based on samples of adequate size; others are not. Yet all these published results bear the ring of truth. Some people (partic-ularly statisticians) say that statistics can be made to support almost anything. Others say it is easy to lie with statistics. Both statements are true. It is easy, purposely or unwittingly, to distort the truth by using statistics when presenting the results of sampling to the uninformed. It is thus crucial that you become an informed and critical reader of data-based reports and articles.
A second reason for studying statistics is that your profession or employment may require you to interpret the results of sampling (surveys or experimentation) or to employ statistical methods of analysis to make inferences in your work. For example, practicing physicians receive large amounts of advertising describing the benefits of new drugs. These advertisements frequently display the numerical results of experiments that compare a new drug with an older one. Do such data really imply that the new drug is more effective, or is the observed difference in results due simply to random variation in the experimental measurements?
Recent trends in the conduct of court trials indicate an increasing use of probability and statistical inference in evaluating the quality of evidence. The use of statistics in the social, biological, and physical sciences is essential because all these sciences make use of observations of natural phenomena, through sample surveys or experimentation, to develop and test new theories. Statistical methods are employed in business when sample data are used to forecast sales and profit. In addition, they are used in engineering and manufacturing to monitor product qual-ity. The sampling of accounts is a useful tool to assist accountants in conducting au-dits. Thus, statistics plays an important role in almost all areas of science, business, and industry; persons employed in these areas need to know the basic concepts, strengths, and limitations of statistics.
The article “What Educated Citizens Should Know About Statistics and Probability,” by J. Utts, in The American Statistician,May 2003, contains a number FIGURE 1.2
Population and sample Set of all measurements: the population
Set of measurements selected from the
of statistical ideas that need to be understood by users of statistical methodology in order to avoid confusion in the use of their research findings. Misunderstandings of statistical results can lead to major errors by government policymakers, medical workers, and consumers of this information. The article selected a number of top-ics for discussion. We will summarize some of the findings in the article. A com-plete discussion of all these topics will be given throughout the book.
1. One of the most frequent misinterpretations of statistical findings is when a statistically significant relationship is established between two variables and it is then concluded that a change in the explanatory variablecausesa change in the response variable. As will be discussed in the book, this conclusion can be reached only under very restrictive constraints on the experimental setting. Utts examined a recent
Newsweekarticle discussing the relationship between the strength of religious beliefs and physical healing. Utts’ article discussed the problems in reaching the conclusion that the stronger a patient’s reli-gious beliefs, the more likely patients would be cured of their ailment. Utts shows that there are numerous other factors involved in a patient’s health, and the conclusion that religious beliefs cause a cure can not be validly reached.
2. A common confusion in many studies is the difference between (statisti-cally) significantfindings in a study and(practically) significantfindings. This problem often occurs when large data sets are involved in a study or experiment. This type of problem will be discussed in detail through-out the book. We will use a number of examples that will illustrate how this type of confusion can be avoided by the researcher when reporting the findings of their experimental results. Utts’ article illustrated this problem with a discussion of a study that found a statistically significant difference in the average heights of military recruits born in the spring and in the fall. There were 507,125 recruits in the study and the differ-ence in average height was about 1兾4 inch. So, even though there may be a difference in the actual average height of recruits in the spring and the fall, the difference is so small (1兾4 inch) that it is of no practical importance.
3. The size of the sample also may be a determining factor in studies in which statistical significance is notfound. A study may not have selected a sample size large enough to discover a difference between the several populations under study. In many government-sponsored studies, the researchers do not receive funding unless they are able to demonstrate that the sample sizes selected for their study are of an appropriate size to detect specified differences in populations if in fact they exist. Methods to determine appropriate sample sizes will be pro-vided in the chapters on hypotheses testing and experimental design.
4. Surveys are ubiquitous, especially during the years in which national elections are held. In fact, market surveys are nearly as widespread as political polls. There are many sources of bias that can creep into the most reliable of surveys. The manner in which people are selected for inclusion in the survey, the way in which questions are phrased, and even the manner in which questions are posed to the subject may affect the conclusions obtained from the survey. We will discuss these issues in Chapter 2.
5. Many students find the topic of probability to be very confusing. One of these confusions involves conditional probability where the probability of an event occurring is computed under the condition that a second event has occurred with certainty. For example, a new diagnostic test for the pathogenEschervichis coliin meat is proposed to the U.S. Department of Agriculture (USDA). The USDA evaluates the test and determines that the test has both a lowfalse positiverate and a lowfalse negativerate. That is, it is very unlikely that the test will declare the meat containsE. coli
when in fact it does not containE. coli.Also, it is very unlikely that the test will declare the meat does not containE. coliwhen in fact it does contain
E. coli.Although the diagnostic test has a very low false positive rate and a very low false negative rate, the probability thatE. coliis in fact present in the meat when the test yields a positive test result isverylow for those situations in which a particular strain ofE. colioccurs very infrequently. In Chapter 4, we will demonstrate how this probability can be computed in order to provide a true assessment of the performance of a diagnostic test.
6. Another concept that is often misunderstood is the role of the degree of variability in interpreting what is a “normal” occurrence of some natu-rally occurring event. Utts’ article provided the following example. A company was having an odor problem with its wastewater treatment plant. They attributed the problem to “abnormal” rainfall during the period in which the odor problem was occurring. A company official stated the facility experienced 170% to 180% of its “normal” rainfall during this period, which resulted in the water in the holding ponds taking longer to exit for irrigation. Thus, there was more time for the pond to develop an odor. The company official did not point out that yearly rainfall in this region is extremely variable. In fact, the historical range for rainfall is between 6.1 and 37.4 inches with a median rainfall of 16.7 inches. The rainfall for the year of the odor problem was 29.7 inches, which was well within the “normal” range for rainfall. There was a con-fusion between the terms “average” and “normal” rainfall. The concept of natural variability is crucial to correct interpretation of statistical results. In this example, the company official should have evaluated the percentile for an annual rainfall of 29.7 inches in order to demonstrate the abnormality of such a rainfall. We will discuss the ideas of data sum-maries and percentiles in Chapter 3.
The types of problems expressed above and in Utts’ article represent common and important misunderstandings that can occur when researchers use statistics in interpreting the results of their studies. We will attempt throughout the book to dis-cuss possible misinterpretations of statistical results and how to avoid them in your data analyses. More importantly, we want the reader of this book to become a dis-criminating reader of statistical findings, the results of surveys, and project reports.
1.3
Some Current Applications of Statistics
Defining the Problem: Reducing the Threat of Acid Rain
to Our Environment
oxide into the atmosphere when burned. Here are some of the many effects of acid rain:
● Acid rain, when present in spring snow melts, invades breeding areas
for many fish, which prevents successful reproduction. Forms of life that depend on ponds and lakes contaminated by acid rain begin to disappear.
● In forests, acid rain is blamed for weakening some varieties of trees,
making them more susceptible to insect damage and disease.
● In areas surrounded by affected bodies of water, vital nutrients are
leached from the soil.
● Man-made structures are also affected by acid rain. Experts from the
United States estimate that acid rain has caused nearly $15 billion of damage to buildings and other structures thus far.
Solutions to the problems associated with acid rain will not be easy. The National Science Foundation (NSF) has recommended that we strive for a 50% reduction in sulfur-oxide emissions. Perhaps that is easier said than done. High-sulfur coal is a major source of these emissions, but in states dependent on coal for energy, a shift to lower sulfur coal is not always possible. Instead, better scrubbers must be developed to remove these contaminating oxides from the burning process before they are released into the atmosphere. Fuels for internal combustion engines are also major sources of the nitric and sulfur oxides of acid rain. Clearly, better emission control is needed for automobiles and trucks.
Reducing the oxide emissions from coal-burning furnaces and motor vehicles will require greater use of existing scrubbers and emission control devices as well as the development of new technology to allow us to use available energy sources. Developing alternative, cleaner energy sources is also important if we are to meet the NSF’s goal. Statistics and statisticians will play a key role in monitoring atmos-phere conditions, testing the effectiveness of proposed emission control devices, and developing new control technology and alternative energy sources.
Defining the Problem: Determining the Effectiveness
of a New Drug Product
The development and testing of the Salk vaccine for protection against po-liomyelitis (polio) provide an excellent example of how statistics can be used in solving practical problems. Most parents and children growing up before 1954 can recall the panic brought on by the outbreak of polio cases during the summer months. Although relatively few children fell victim to the disease each year, the pattern of outbreak of polio was unpredictable and caused great concern because of the possibility of paralysis or death. The fact that very few of today’s youth have even heard of polio demonstrates the great success of the vaccine and the testing program that preceded its release on the market.
clinical trial. This problem was particularly important in the testing of the Salk vac-cine because data from previous years suggested that the incidence rate for polio might be less than 50 cases for every 100,000 children. Hence, a large number of par-ticipants had to be included in the clinical trial in order to detect a difference in the incidence rates for those treated with the vaccine and those receiving the placebo.
With the assistance of statisticians, it was decided that a total of 400,000 chil-dren should be included in the Salk clinical trial begun in 1954, with half of them ran-domly assigned the vaccine and the remaining children assigned the placebo. No other clinical trial had ever been attempted on such a large group of participants. Through a public school inoculation program, the 400,000 participants were treated and then observed over the summer to determine the number of children contracting polio. Although fewer than 200 cases of polio were reported for the 400,000 partici-pants in the clinical trial, more than three times as many cases appeared in the group receiving the placebo. These results, together with some statistical calculations, were sufficient to indicate the effectiveness of the Salk polio vaccine. However, these con-clusions would not have been possible if the statisticians and scientists had not planned for and conducted such a large clinical trial.
The development of the Salk vaccine is not an isolated example of the use of statistics in the testing and developing of drug products. In recent years, the Food and Drug Administration (FDA) has placed stringent requirements on pharma-ceutical firms to establish the effectiveness of proposed new drug products. Thus, statistics has played an important role in the development and testing of birth con-trol pills, rubella vaccines, chemotherapeutic agents in the treatment of cancer, and many other preparations.
Defining the Problem: Use and Interpretation of Scientific
Data in Our Courts
Libel suits related to consumer products have touched each one of us; you may have been involved as a plaintiff or defendant in a suit or you may know of some-one who was involved in such litigation. Certainly we all help to fund the costs of this litigation indirectly through increased insurance premiums and increased costs of goods. The testimony in libel suits concerning a particular product (automobile, drug product, and so on) frequently leans heavily on the interpretation of data from one or more scientific studies involving the product. This is how and why statistics and statisticians have been pulled into the courtroom.
whether significant salary differences exist after adjusting for the relevant work performance factors.
Defining the Problem: Estimating Bowhead Whale Population Size
Raftery and Zeh (1998) discuss the estimation of the population size and rate of increase in bowhead whales, Balaena mysticetus. The importance of such a study derives from the fact that bowheads were the first species of great whale for which commercial whaling was stopped; thus, their status indicates the recovery prospects of other great whales. Also, the International Whaling Commission uses these estimates to determine the aboriginal subsistence whaling quota for Alaskan Eskimos. To obtain the necessary data, researchers conducted a visual and acoustic census off Point Barrow, Alaska. The researchers then applied statistical models and estimation techniques to the data obtained in the census to determine whether the bowhead population had increased or decreased since commercial whaling was stopped. The statistical estimates showed that the bowhead popu-lation was increasing at a healthy rate, indicating that stocks of great whales that have been decimated by commercial hunting can recover after hunting is discontinued.Defining the Problem: Ozone Exposure and Population Density
Ambient ozone pollution in urban areas is one of the nation’s most pervasive envi-ronmental problems. Whereas the decreasing stratospheric ozone layer may lead to increased instances of skin cancer, high ambient ozone intensity has been shown to cause damage to the human respiratory system as well as to agricultural crops and trees. The Houston, Texas, area has ozone concentrations rated second only to Los Angeles that exceed the National Ambient Air Quality Standard. Carroll et al. (1997) describe how to analyze the hourly ozone measurements collected in Houston from 1980 to 1993 by 9 to 12 monitoring stations. Besides the ozone level, each station also recorded three meteorological variables: temperature, wind speed, and wind direction.
The statistical aspect of the project had three major goals:
1. Provide information (and/or tools to obtain such information) about the amount and pattern of missing data, as well as about the quality of the ozone and the meteorological measurements.
2. Build a model of ozone intensity to predict the ozone concentration at any given location within Houston at any given time between 1980 and 1993.
3. Apply this model to estimate exposure indices that account for either a long-term exposure or a short-term high-concentration exposure; also, relate census information to different exposure indices to achieve population exposure indices.
not ideal if one is concerned with assessing population exposure. This project in-volved all four components of Learning from Data: planning where the monitoring stations should be placed within the city, how often data should be collected, and what variables should be recorded; conducting spatial–temporal graphing of the data; creating spatial–temporal models of the ozone data, meteorological data, and demographic data; and finally, writing a report that could assist local and fed-eral officials in formulating policy with respect to decreasing ozone levels.
Defining the Problem: Assessing Public Opinion
Public opinion, consumer preference, and election polls are commonly used to assess the opinions or preferences of a segment of the public for issues, products, or candidates of interest. We, the American public, are exposed to the results of these polls daily in newspapers, in magazines, on the radio, and on television. For example, the results of polls related to the following subjects were printed in local newspapers over a 2-day period:
● Consumer confidence related to future expectations about the economy ● Preferences for candidates in upcoming elections and caucuses
● Attitudes toward cheating on federal income tax returns
● Preference polls related to specific products (for example, foreign vs.
American cars, Coke vs. Pepsi, McDonald’s vs. Wendy’s)
● Reactions of North Carolina residents toward arguments about the
morality of tobacco
● Opinions of voters toward proposed tax increases and proposed changes
in the Defense Department budget
A number of questions can be raised about polls. Suppose we consider a poll on the public’s opinion toward a proposed income tax increase in the state of Michigan. What was the population of interest to the pollster? Was the pollster interested in all residents of Michigan or just those citizens who currently pay in-come taxes? Was the sample in fact selected from this population? If the population of interest was all persons currently paying income taxes, did the pollster make sure that all the individuals sampled were current taxpayers? What questions were asked and how were the questions phrased? Was each person asked the same ques-tion? Were the questions phrased in such a manner as to bias the responses? Can we believe the results of these polls? Do these results “represent’’ how the general publiccurrentlyfeels about the issues raised in the polls?
Opinion and preference polls are an important, visible application of statis-tics for the consumer. We will discuss this topic in more detail in Chapter 10. We hope that after studying this material you will have a better understanding of how to interpret the results of these polls.
1.4
A Note to the Student
We think with words and concepts. A study of the discipline of statistics requires us to memorize new terms and concepts (as does the study of a foreign language). Commit these definitions, theorems, and concepts to memory.
1.5
Summary
The discipline of statistics and those who apply the tools of that discipline deal with Learning from Data. Medical researchers, social scientists, accountants, agron-omists, consumers, government leaders, and professional statisticians are all in-volved with data collection, data summarization, data analysis, and the effective communication of the results of data analysis.
1.6
Exercises
1.1 Introduction
Bio. 1.1 Selecting the proper diet for shrimp or other sea animals is an important aspect of sea farm-ing. A researcher wishes to estimate the mean weight of shrimp maintained on a specific diet for a period of 6 months. One hundred shrimp are randomly selected from an artificial pond and each is weighed.
a. Identify the population of measurements that is of interest to the researcher. b. Identify the sample.
c. What characteristics of the population are of interest to the researcher?
d. If the sample measurements are used to make inferences about certain characteristics of the population, why is a measure of the reliability of the inferences important? Env. 1.2 Radioactive waste disposal as well as the production of radioactive material in some mining
operations are creating a serious pollution problem in some areas of the United States. State health officials have decided to investigate the radioactivity levels in one suspect area. Two hun-dred points in the area are randomly selected and the level of radioactivity is measured at each point. Answer questions (a), (b), (c), and (d) in Exercise 1.1 for this sampling situation. Soc. 1.3 A social researcher in a particular city wishes to obtain information on the number of
chil-dren in households that receive welfare support. A random sample of 400 households is selected from the city welfare rolls. A check on welfare recipient data provides the number of children in each household. Answer questions (a), (b), (c), and (d) in Exercise 1.1 for this sample survey. Gov. 1.4 Because of a recent increase in the number of neck injuries incurred by high school football
players, the Department of Commerce designed a study to evaluate the strength of football helmets worn by high school players in the United States. A total of 540 helmets were collected from the five companies that currently produce helmets. The agency then sent the helmets to an independent testing agency to evaluate the impact cushioning of the helmet and the amount of shock transmitted to the neck when the face mask was twisted.
a. What is the population of interest? b. What is the sample?
c. What variables should be measured?
d. What are some of the major limitations of this study in regard to the safety of helmets worn by high school players? For example, is the neck strength of the player related to the amount of shock transmitted to the neck and whether the player will be injured? Pol. Sci. 1.5 During the 2004 senatorial campaign in a large southwestern state, the issue of illegal
im-migration was a major issue. One of the candidates argued that illegal immigrants made use of ed-ucational and social services without having to pay property taxes. The other candidate pointed out that the cost of new homes in their state was 20 –30% less than the national average due to the low wages received by the large number of illegal immigrants working on new home construction. A random sample of 5,000 registered voters were asked the question, “Are illegal immigrants generally a benefit or a liability to the state’s economy?” The results were 3,500 people responded “liability,” 1,500 people responded “benefit,” and 500 people responded “uncertain.”
a. What is the population of interest?
b. What is the population from which the sample was selected?
c. Does the sample adequately represent the population?
d. If a second random sample of 5,000 registered voters was selected, would the results be nearly the same as the results obtained from the initial sample of 5,000 voters? Explain your answer.
Edu. 1.6 An American History professor at a major university is interested in knowing the history lit-eracy of college freshmen. In particular, he wanted to find what proportion of college freshman at the university knew which country controlled the original 13 states prior to the American Rev-olution. The professor sent a questionnaire to all freshmen students enrolled in HIST 101 and re-ceived responses from 318 students out of the 7,500 students who were sent the questionnaire. One of the questions was, “What country controlled the original 13 states prior to the American Revolution?”
a. What is the population of interest to the professor? b. What is the sampled population?
c. Is there a major difference in the two populations. Explain your answer.
P A R T
2
Collecting Data
16
CHAPTER
2
Using Surveys and
Experimental Studies
to Gather Data
2.1 Introduction and Abstract of Research Study
2.2 Observational Studies 2.3 Sampling Designs for
Surveys
2.4 Experimental Studies 2.5 Designs for
Experimental Studies 2.6 Research Study:
Exit Polls versus Election Results
2.7 Summary
2.8 Exercises
2.1
Introduction and Abstract of Research Study
As mentioned in Chapter 1, the first step in Learning from Data is to define the problem. The design of the data collection process is the crucial step in intelligent data gathering. The process takes a conscious, concerted effort focused on the following steps:
● Specifying the objective of the study, survey, or experiment ● Identifying the variable(s) of interest
● Choosing an appropriate design for the survey or experimental study ● Collecting the data
To specify the objective of the study, you must understand the problem being ad-dressed. For example, the transportation department in a large city wants to assess the public’s perception of the city’s bus system in order to increase the use of buses within the city. Thus, the department needs to determine what aspects of the bus system determine whether or not a person will ride the bus. The objective of the study is to identify factors that the transportation department can alter to increase the number of people using the bus system.
2.1 Introduction and Abstract of Research Study
17
of interest are specified, you must select the most appropriate method to collect the data. Data collection processes include surveys, experiments, and the exami-nation of existing data from business records, censuses, government records, and previous studies. The theory of sample surveys and the theory of experimental designs provide excellent methodology for data collection. Usually surveys are passive. The goal of the survey is to gather data on existing conditions, attitudes, or behaviors. Thus, the transportation department would need to construct a ques-tionnaire and then sample current riders of the buses and persons who use other forms of transportation within the city.
Experimental studies, on the other hand, tend to be more active: The person conducting the study varies the experimental conditions to study the effect of the conditions on the outcome of the experiment. For example, the transportation department could decrease the bus fares on a few selected routes and assess whether the use of its buses increased. However, in this example, other factors not under the bus system’s control may also have changed during this time period. Thus, an increase in bus use may have taken place because of a strike of subway workers or an increase in gasoline prices. The decrease in fares was only one of several factors that may have “caused” the increase in the number of persons riding the buses.
In most experimental studies, as many as possible of the factors that affect