KEYWORDS
Asbestos, ASTM D7200, chrysotile, concentration, crocidolite, grinding, NIST SRM 1866, phase contrast microscopy (PCM), scanning electron microscopy (SEM), sonication, transmission electron microscopy (TEM), tremolite
ABSTRACT
Natural occurrences of asbestos and potential ex-posures to such materials have drawn significant pub-lic and regulatory interest in recent years. Proposed revisions to a published analytical method (ASTM D7200) that is designed to monitor airborne fiber con-centrations are based on data developed using inappropriate sample preparation strategies, includ-ing over-grindinclud-ing the samples and the use of ultrasonication. Tests demonstrating the effects of grinding and preparation of asbestos minerals have been conducted. Sample preparation procedures used by some laboratories destroy the characteristics of asbestos, thereby limiting the usefulness of ASTM D7200 and similar analytical methods. The effects of sample preparation on the morphology of particles must be considered when creating or revising asbes-tos analytical procedures.
INTRODUCTION
When rocks that contain veins or pockets with natural occurrences of asbestos are crushed, there is a
possibility that asbestos fibers will be released and become airborne. If the airborne asbestos is of respi-rable size, these fibers pose a potential hazard to work-ers and bystandwork-ers who may breathe them.
Fortunately, minerals rarely grow as asbestos fi-bers, but more generally grow as (comparatively) larger crystals that do not possess the characteristics of asbestisform fibers. Unfortunately, when these non-asbestos minerals are fractured, many will fracture as elongated particles that have dimensions that are en-compassed by various regulatory analytical proce-dures. For example, OSHA (29 CFR §1910.1001) and MSHA (30 CFR §56.5001) regulate airborne asbestos fibers if they are at least 5 μm long, have a minimum aspect ratio (length:width) of 3:1 and are visible in an optical microscope. Fractured non-asbestos minerals that frequently occur with asbestos are routinely ob-served with these dimensions even though they are not asbestos.
Therefore, it is necessary to be able to analyze samples to determine the amount of asbestos (inde-pendent of any non-asbestos mineral) in the samples. ASTM D7200 (1) is an optical microscopy procedure for analyzing airborne particles from mines, quarries and construction activities to determine which samples need additional analyses using electron mi-croscopy to determine compliance with MSHA and OSHA worker exposure regulations. ASTM D7200 pro-vides an index used to estimate whether the popula-tion of counted fibers are potentially asbestos.
collected at operating mines and quarries. The method and the test results were produced during testimony at an OSHA hearing in 1990 (2). The method was adopted, with slight modification, by ASTM in 2006 after several years of consideration.
ASTM D7200 is an analytical method for airborne particulate collected on filters. The method involves a standard phase contrast microscopy (PCM) analysis that then divides counted elongated particulate (mini-mum 3:1 aspect ratio, 5 μm or longer) into three bins: one that includes obvious bundles and/or curved fi-bers, a second that includes long (> 10 μm), thin (high aspect ratio) fibers, and a third bin for the remainder of the counts. If the D7200 concentration of countable fibers exceeds one half of the current regulatory limit and the number of fibers reported in the first two bins exceed 50% of the total count, the method strongly rec-ommends the mine owner/operator to take additional analytical measures to determine if the fibers are as-bestos. If no further analyses are conducted, the fibers should be considered to be asbestos. This trigger at one-half the PEL and 50% of the counts in the first two bins serves as a safety factor. Regardless of the distri-bution of counts in the bins, the reported concentra-tion retains comparability to current regulatory lev-els and to historical PCM analyses. The binning pro-cess is a form of differential counting that is based on published dimensional and crystal growth character-istics described in the literature (3–5).
Recently, Harper et al. published a paper (6) dis-cussing the size characteristics of asbestos and non-asbestos amphibole particles that mischaracterizes ASTM D7200 by suggesting that the method indicates that particle dimensions (lengths and widths) are used to positively identify asbestos fibers and to classify all remaining particles as non-asbestos particles. It is im-portant to understand, however, that D7200 is expressly intended to be a screening tool designed to encourage mine and quarry operators to be proactive in monitor-ing their employees for potential asbestos exposure. If such a potential is indicated through the screening ap-proach, additional analyses that are more complex, time consuming and costly are required for positive identifi-cation of asbestos (see step 1.6 in the method).
The testing reported by Harper, et al. (6) to ad-dress the reliability of these bins as a screening for potential asbestos fibers (avoidance of false negatives in particular) is also misleading, in part, due to the inappropriate sample preparation procedures used to generate the test fibers. In their test of D7200 to dis-criminate asbestos populations from non-asbestos populations, Harper tested a number of samples that
could be classified as either asbestos or non-asbestos on the basis of their appearance in hand samples. How-ever, the purity of these specimens is unclear, and the value of their work would be enhanced if the originat-ing sample composition was fully characterized. Sev-eral standard reference materials for amphibole as-bestos used in the Harper work are known to contain considerable non-asbestiform fragments (7–9).
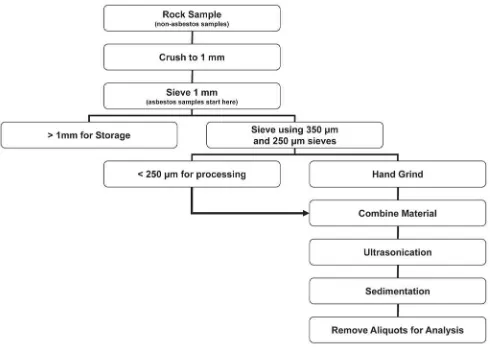
In the Harper paper, the mineral samples were heavily processed to optimize the number of the 3:1 aspect ratio and particles longer than 5 μm, resulting in powders whose particles had widths of generally < 3 μm (10). Their general sample preparation proce-dure is shown in the flowchart in Figure 1. Part of their sample preparation procedure used an ultrasonic disruptor to further disaggregate the crushed par-ticles. It is not clear from the publication what size particles were subjected to ultrasonic treatment, though Harper et al. (11) provides additional descrip-tion of the sample preparadescrip-tion procedures in a second paper. The mineral samples classified by Harper as “asbestos” were not subjected to the initial crushing step shown in Figure 1.
In regard to asbestos, the sample processing pro-cedure used by Harper may well have destroyed the asbestiform nature of the asbestos test minerals. Us-ing ultrasonic energy to process asbestos fibers is known to separate fiber bundles into the individual fibers and to comminute the fibers into shorter fibers, thus reducing the apparent aspect ratio of the asbes-tos fibers (12). This sonication effect is acknowledged in other ASTM asbestos procedures that utilize ultrasonication (13).
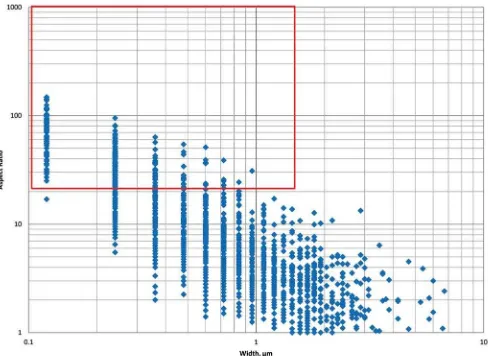
not have the size characteristics of asbestos. The con-tract laboratory that produced the samples, reported by Harper, evaluated some of the fiber samples using transmission electron microscopy (TEM). A plot of width versus aspect ratio (Figure 2) indicates that only a small fraction of the fibers (16%) meet the minimum aspect ratio of 20:1 recommended by the EPA (24). Of the five minerals classified as asbestos, only the croci-dolite sample contained more than 50% of fibers with an aspect ratio greater than 20:1 (77%); the other samples were 26% (amosite) or fewer than 3% (acti-nolite asbestos, tremolite asbestos and anthophyllite asbestos).
Therefore, if the sample preparation procedures affected the morphological and size characteristics of the minerals used in his tests, Harper’s conclusions about the efficacy of various test methods are not valid. Analytical procedures need to be tested and modified as new information about a program or analyte
be-comes known, and certainly the D7200 method should be tested to confirm its performance. However, the tests should be conducted with a clear understanding of the effect of sample preparation on the reference test min-erals. Only with this understanding can tests be prop-erly designed and the results interpreted.
EXPERIMENTAL PLAN
Crocidolite from the NIST SRM 1866 standard was examined in order to provide a direct comparison to the samples used by Harper. Crocidolite from NIST SRM 1866 was first placed in a beaker of distilled wa-ter and sonicated for three minutes using a 100 W ul-trasonic bath. At the completion of the sonication, the suspension was thoroughly mixed and allowed to settle for 30 minutes. At that time, an aliquot of the remain-ing suspension was removed, deposited onto a poly-carbonate filter (0.2 μm pore) and mounted on a
bon planchette for analysis by scanning electron mi-croscopy (SEM).
In a second procedure, crocidolite from NIST SRM 1866 was placed in an elutriation chamber and aero-solized using compressed air. Air filters (MCE, 0.8 μm pore) were placed at the top of the chamber and were used to collect samples of the airborne dust at a sam-pling rate of 2 lpm. At the end of the samsam-pling, a por-tion of the filter was excised and mounted on a carbon planchette for analysis by SEM.
The prepared crocidolite samples were examined with a JEOL 6460 LV SEM at magnifications ranging from 1,000x to 5,000x. Images of fields of particles were recorded for offline measurements of approximately 650 particles. The counted particles were limited to those longer than 5 μm with a minimum aspect ratio of 3:1. Particles that were obvious bundles were
la-beled so their dimensions could be evaluated separately from the other fibers.
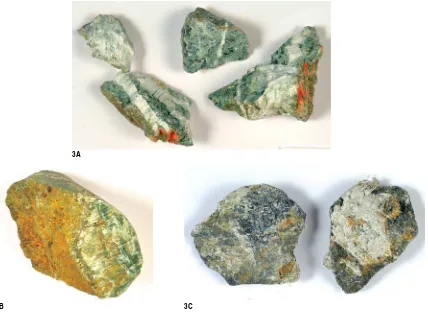
Additional tests were conducted to demonstrate the effect of grinding and sonication on the size and morphology of amphibole minerals. An experiment was designed to demonstrate the effect of sample preparation procedures, specifically sonication, on crushed rock samples. Three samples, shown in Figure 3, were obtained and used in the testing. Each sample was 50 mm–75 mm, which is a typical size of railroad ballast or rock that would be used as base material for road building. Each sample contained a
1Byssolite is a fibrous form of amphibole minerals that has low
tensile strength and moderate fiber widths. A portion of the fibers will show crystal faces. Byssolite fibers are not asbestiform fibers and they are not asbestos.
vein or veins of visibly fibrous minerals that were identified as the amphibole minerals tremolite asbes-tos, actinolite (byssolite1) or the serpentine mineral
chrysotile.
Each sample was stage ground so that the product size was generally finer than 150 μm (100 mesh) (25). The ground samples were riffled into equal parts.
The effect of sonication was examined by taking one portion of each ground sample and sonicating it using a Biologics Ultrasonic Homogenizer (Model 150 V/T) equipped with a titanium tip (0.5 inch). The pul-verized material was suspended in approximately 100 ml of deionized water and then sonicated for 15 minutes, the same time used by Harper (6) and Beard (10). Aliquots of the sonicated material were removed from the suspension at the completion of the sonica-tion (no settling) and filtered onto a new mixed cellu-lose ester filter (0.2 μm pore size).
The other portion of each sample was aerosolized in a glove box using small fans; the airborne particles
were collected onto filters in general accordance with NIOSH 7400 (26). While aerosolized, some of the coarser particles did not remain airborne, therefore, these aerosolized fractions represent a subset of the entire sample.
Each collected filter was analyzed in general ac-cordance with PCM (ASTM D7200 [1]) and SEM (ISO 14966 [27]). For the PCM analyses, the definition of Bin 2 was modified to include fibers longer than 10
μm and thinner than 1 μm. The primary purpose of the SEM analyses was to determine the size distribu-tion of the counted fibers. The ISO procedure was modified to count fibers 5 μm and longer with no mini-mum width.
ANALYTICAL RESULTS
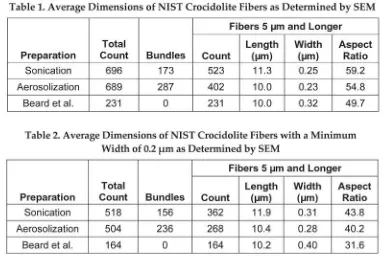
The average dimensions of the crocidolite fibers from these tests are shown in Table 1, compared to the dimensions reported by Beard et al. (10). The fiber
di-Figure 3. Rock samples used in the test program to demonstrate the effect of sample preparation procedures, specifically sonication, on crushed rock: 3A, pieces of rock containing tremolite asbestos that were taken from a drill core; 3B, a sample that contains actinolite (byssolite), which was also obtained from a drill core; and 3C, two pieces of chrysotile ore from the mine in Lowell, Vermont.
3A
mensions presented in Table 1 are limited to fibers and do not include the dimensions of bundles. As can be seen in Table 1, there are differences between the three analyses primarily in the number of bundles counted. In these tests, between 25% and 40% of the counts were crocidolite bundles; none were reported by Beard et al. (10). The dimensions of the fibers are relatively con-sistent between the three analyses.
Some of the fibers included in Table 1 are thinner than 0.2 μm (the minimum width generally visible in the PCM). Removing these very thin fibers from the count slightly changes the dimensions as shown in Table 2, which shows the dimensions for fibers, exclu-sive of bundles. The proportion of particles that were bundles increased slightly in the sonication (25%–30%) and aerosolization (42%–47%) data as a result of ex-cluding the particles with widths less than 0.2 μm.
The lengths of the crocidolite fibers are similar in the three data sets, but there is a slight difference in the width of the fibers (resulting in a slight difference in the aspect ratio). These dimensions indicate that the sample preparation procedure used by Beard et al. (10) resulted in fibers, with no bundles present in the sample.
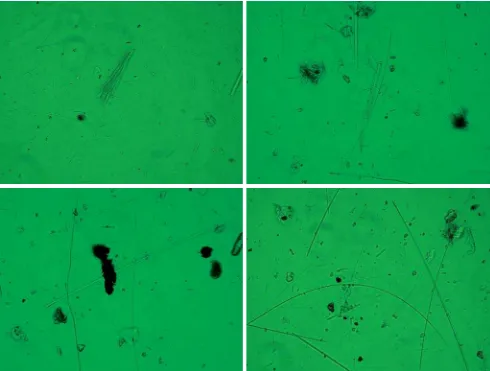
The presence of bundles of fibers is a hallmark characteristic of asbestos. As an example, Figure 4 shows PCM photographs of crocidolite bundles and curved crocidolite fibers observed in samples collected at an operating cement plant where crocidolite was
used as a component of the cement product. Harper instructed the laboratory not to differentiate between bundles of fibers and single fibers during the TEM char-acterization of the fibers on the basis that identifying bundles with PCM is difficult, subjective and judg-mental. However, the characterization of particles as bundles (Bin 1) is a key factor in the D7200 analysis and should not be discarded if the method is to be prop-erly evaluated. This error minimized the efficacy of the method to identify populations of asbestiform fi-bers. Bundles of fibers are well known characteristics of asbestiform minerals, and eliminating this hallmark characteristic through both sample preparation and analytical procedures will significantly bias the re-sulting data and conclusions.
bundles or curvature (Bin 1).
What should be noted about Table 3 is that the percentage of counts in Bins 1 and 2 for the asbestos samples (tremolite and chrysotile) are approximately 50% or greater, regardless of the sample preparation procedure. This suggests that the use of D7200 in min-ing environments to identify airborne particulate as potential asbestos fibers is valid.
The size distributions of the samples for particles 5 μm and longer are shown in Tables 4–6. The sizes of the particles are greatly affected by sonication, with a reduction in length (less for the tremolite sample) and width. There is some difference in the aspect ratios of the minerals when comparing sonicated versus non-sonicated processes, but less of a difference than what might have been expected when considering the length and width distributions.
With the exception of the change in length for the tremolite sample, all of the dimensions were statisti-cally different (p < 0.05) for each sample when evalu-ated using both parametric (ANOVA) and nonpara-metric (Mann-Whitney test) analytical procedures. These data confirm published observations that soni-cation adversely affects particle size (12).
DISCUSSION
The data from these experiments demonstrate that the issues related to the pulverization and sonication of asbestos minerals are complex. Liberation of par-ticles is ongoing throughout all comminution processes, including sonication. The energy input into a system, whether as a mechanical force from the grinder or as an effect of the sonic energy, affects each particle differ-ently. Fibers and/or bundles can be released from com-plex (locked) particles; bundles can be split partially or completely into the individual fiber components; and fibers can be fractured into shorter, thinner, more numerous particles.
Incorrect sample preparation will result in biased analytical results. These studies demonstrate:
Sonicating samples destroys the observable asbes-tos characteristics. Fundamental asbesasbes-tos character-istics, such as bundling of fibers or long, curved fibers, are destroyed by sonication. As shown in Table 2, the percentage of countable bundles or curved fibers (Bin 1) was significantly reduced solely due to sonication.
Sonicating asbestos samples biased the evaluation of the D7200 analytical method. The effect of sonica-tion has been extensively discussed in the asbestos analytical literature (12, 28–31), consistently showing that the use of ultrasonic energy disaggregates bound
particles from matrices, splits bundles of fibers longi-tudinally into separate fibrils and fractures fibers transversely. Given the existing knowledge base of the effects of sonication, it is inappropriate to use the soni-cation technique to prepare samples that would be used to evaluate the ASTM D7200 procedure. The use of sonication in preparation of the fiber samples (with the intent of evaluating the D7200 method) significantly biases the results.
Sonicating asbestos samples does not alter the D7200 evaluation as to whether a sample contains a population of asbestos or not. As shown in Table 2, the percentage of counts that are used to suggest a sample of airborne fibers may be asbestos found in (Bin 1 + Bin 2) is 50% or greater. These tests support the basic concept of the D7200 method that a popula-tion of asbestos fibers will be comprised of bundles and/or long thin fibers.
This study demonstrates that sample preparation procedures (grinding and sonication) do affect the as-bestos fibers. It also suggests that these procedures can be used inadvertently to skew results, reinforcing the concept that standard but appropriate methods be used for asbestos analyses. These data show that the choice of material to test for evaluation of analytical methods will affect the usefulness of the method evalu-ation. Any material chosen for method evaluation must be fully and carefully characterized prior to use.
D7200 is a slight modification of standard PCM ana-lytical procedures, requiring binning of the counts. The observed concentrations are data that can be used for regulatory compliance documentation. Because of the binning of the counts, D7200 should provide informa-tion on the fracinforma-tion of counted fibers that may be as-bestos. Not all asbestos fibers are observable by PCM (32), but the concentrations derived using D7200 should direct the user to additional (TEM) analyses and/ or personal protective measures for the employees.
Analytical test methods do need to be evaluated and updated as new information on the analyte or pro-cedure is obtained. However, these tests should be con-ducted using appropriately prepared reference mate-rials in order to avoid inherent test bias.
ACKNOWLEDGMENTS
REFERENCES
1. ASTM International, Inc. (ASTM). “Standard Practice for Sampling and Counting Airborne Fibers, Including Asbestos Fibers in Mines and Quarries, by Phase Contrast Microscopy and Transmission Electron Microscopy,” Method D7200, ASTM Book of Standards,
Vol. 11.07, 2006.
2. Lee, R.J. Testimony before OSHA Panel, Docket H033D-490F, May 9, 1990.
3. Wylie, A.G., Virta, R.L. and Russek, E. “Charac-terizing and Discriminating Airborne Amphibole Cleavage Fragments and Amosite Fibers: Implications for the NIOSH Method,” American Industrial Hygiene As-sociation Journal, 46, pp 197–201, 1985.
4. Wylie, A.G. “Fiber Length and Aspect Ratio of Some Selected Asbestos Samples,” Health Hazards of Asbestos Exposure, Annals of The New York Academy of Sciences, 330, pp 605–610, 1979.
5. Van Orden, D.R., Lee, R.J., Allison, K.A. and Addison, J. “Width Distributions of Asbestos and Non-Asbestos Amphibole Minerals,” Indoor Built Environment, 18, pp 531–540, 2009.
6. Harper, M., Lee, E.G., Doorn, S.S. and Hammond, O. “Differentiating Non-Asbestiform Amphibole and Amphibole Asbestos by Size Characteristics,” Journal of Occupational and Environmental Hygiene, 5, pp 761–770, 2008.
7. Chatfield, E.J. “A Procedure for Quantitative De-scription of Fibrosity In Amphibole Minerals,” pre-sented at the 2008 ASTM Johnson Conference, Burlington, VT.
8. Brown, B.M. and Gunter, M.E. “Morphological and Optical Characterization of Amphiboles from Libby, Montana U.S.A. by Spindle Stage Assisted — Polarized Light Microscopy,” TheMicroscope, 51, pp 121–140, 2003.
9. Sanchez, M.S., Lee, R.J. and Van Orden, D. “Ex-tinction Characteristics of Six Tremolites with Differ-ing Morphologies,” TheMicroscope, 56, pp 13–27, 2008.
10. Beard, M.E., Ennis, J.T., Crankshaw, O.S., Doorn, S.S., Greene, L.C., Winstead, W.W. and Harvey, B.W.
Preparation of Nonasbestiform Amphibole Minerals for Method Evaluation and Health Studies: Summary Report, RTI Inter-national, Research Triangle Park, N.C., 2007.
11. Harper, M., Lee, E.G., Slaven, J. and Bartley, D. “An Inter-Laboratory Study to Determine the Effec-tiveness of Procedures for Discriminating Amphibole Asbestos Fibers from Amphibole Cleavage Fragments in Fiber Counting by Phase-Contrast Microscopy,”
Annals of Occupational Hygiene, 56, pp 645–659, 2012.
12. Van Orden, D., Lee, R.J. and Badger, S.
“Charac-terizing asbestos fiber comminution resulting from preparation of environmental samples, Powder Technol-ogy, 162, pp 183–189, 2006.
13. ASTM International, Inc. (ASTM) “Standard Test Method for Microvacuum Sampling and Indirect Analysis of Dust by Transmission Electron Microscopy for Asbestos Structure Number Surface Loading,” ASTM D5755 (Section 1.4.1), West Conshohocken, PA., 2003.
14. Gibbs, G. and Hwang, C. “Physical parameters of airborne asbestos fibres in various work environ-ments — preliminary findings,” American IndustrialHy
-giene Association Journal, 36, pp 459–466, 1975.
15. Pooley, F. and Clark, N. “A comparison of fibre dimensions in chrysotile, crocidolite and amosite par-ticles from samples of airborne dust and from post-mortem lung tissue specimens,” in Wagner JC (Editor-in-Chief): Biological Effects of Mineral Fibres, Vol. 1, Lyon, International Agency for Research on Cancer, pp 79–86, 1980.
16. Assuncao, J. and Corn, M. “The effects of mill-ing on diameters and lengths of fibrous glass and chrysotile asbestos fibers,” American Industrial Hygiene Association Journal, 36, pp 811–819, 1975.
17. Parson, R., Bryant, D. and Edstrom, H. “Varia-tions in Fibre and Dust Counts in an Asbestos Mine and Mill,” Annals of Occupational Hygiene, 30, pp 63–75, 1986.
18. Spurny, K., Stober, W., Opiela, H. and Weiss, G. “On the problem of milling and ultrasonic treatment of asbestos and glass fibers in biological and analyti-cal applications,” American Industrial Hygiene Association Journal, 41, pp 198–203, 1980.
19. Virta, R., Shedd, K., Wylie, A. and Snyder, J. “Size and Shape Characteristics of Amphibole Asbes-tos (Amosite) and Amphibole Cleavage Fragments (Ac-tinolite, Cummingtonite) Collected on Occupational Air Monitoring Filters,” Aerosols in the Mining and Indus-trial Work Environment, Vol. 2, pp 633–643, 1983.
20. Rood, A. and Streeter, R. “Comparison of the Size Distributions of Occupational Asbestos and Man-Made Mineral Fibres Determined by Transmission Microscopy,” Annals of Occupational Hygiene, 32, pp 361– 367, Supplement 1, 1988.
21. Beckett, S. and Javis, J. “A Study of the Size Dis-tributions of Airborne Amosite Fibres in the Manufac-ture of Asbestos Insulation Boards,” Annals of Occupa-tional Hygiene, 22, pp 273–284, 1979.
22. Rice, C. and Heineman, E. “An Asbestos Job Ex-posure Matrix to Characterize Fiber Type, Length, and Relative Exposure Intensity,” Applied Occupational and
pp 3–9, 2012.
26. NIOSH. “Asbestos and Other Fibers by PCM,” NIOSH Manual of Analytical Methods, Method 7400, Issue 2, Aug. 15, 1994, http://www.cdc.gov/niosh/docs/ 2003-154/pdfs/7400.pdf, accessed Aug. 17, 2010.
27. ISO. “Ambient air — Determination of numeri-cal concentration of inorganic fibrous particles — Scan-ning electron microscopy method,” International Or-ganization for Standardization, Method 14966, Nov. 15, 2002.
28. Lee, R.J., Dagenhart, T., Dunmyre, G., Stewart, I. and Van Orden, D. “Effect of Indirect Sample Prepara-tion Procedures on the Apparent ConcentraPrepara-tion of
As-330, 1996.
31. Chatfield, E. “Correlated Measurements of Air-borne Asbestos-Containing Particles and Surface Dust,” in Advances in Environmental Measurement
Meth-ods for Asbestos, M.E. Beard and H.L. Rook, eds.,
Ameri-can Society for Testing and Materials, pp 378–402, 1999.
32. Snyder, J., Virta, R. and Segreti, J. “Evaluation of the Phase Contrast Microscopy Method for the De-tection of Fibrous and Other Elongated Minerals Par-ticulates by Comparison With a STEM Technique,”