Electronic copy available at: https://ssrn.com/abstract=2975717 CORRESPONDENCE Ebrahim Mansoori [email protected]
© 2017 ROSTAMI & MANSOORI.
Open Access terms of the Creative Commons Attribution 4.0 International License apply. The license permits unrestricted use, distribution, and reproduction in any medium, on the condition that users give exact credit to the original author(s) and the source, provide a link to the Creative Commons license, and indicate if they made any changes. (http://creativecommons.org/licenses/by/4.0/)
Introduction
The required funds for progressing daily commercial activities called the working capital. Working capital management includes an optimal combination of working capital items (that is, current assets and current liabilities) in a way that the wealth of shareholders will be maximized. Generally, working capital management related to daily activities and not related to the long-term decisions of a commercial unit. For example, access to raw materials, granting credit to customers and gathering due accounts, creating the advantage of credit INTERNATIONAL JOURNAL OF ENVIRONMENTAL & SCIENCE EDUCATION
2017, VOL. 12, NO. 2, 291-301
Evaluate The Relationship Between Risk Management
and Working Capital Management in Companies Accepted
in Tehran Stock Exchange During the Time Period of
2010-2015
Reza Rostami
a, Ebrahim Mansoori
aaDepartment of Accounting, Mahabad Branch Islamic Azad University, Mahabad, Iran
ABSTRACT
The aim of this study is to investigate the relationship between risk management and working capital management in companies accepted in Tehran Stock Exchange during the time period of 2010-2015. The sample includes total of 104 companies listed on the Tehran Stock Exchange. To test research hypothesis, risk management is considered as the independent variable, and working capital management is considered as the dependent variable. The results of panel data analysis showed that there is a significant inverse relationship between risk management and working capital indicators. That is, managers increase the level of investment in working capital to decrease the level of risk. Moreover, the results indicate that both operation working capital and liquid working capital is affected by risk management.
KEYWORDS ARTICLE HISTORY
Risk Management, Working Capital Management, Cash Conversion Cycle, Net Liquid Balance
Received 20 December 2067 Revised 13 April 2017 Accepted 19 April 2017
Electronic copy available at: https://ssrn.com/abstract=2975717
292 ROSTAMI & MANSOORI.
purchase, cash management account... . These factors will facilitate the daily operations of the commercial unit (Dianti Deylami et al, 2012). One of the most powerful criteria for assessing the quality of working capital management is cash conversion cycle. Cash conversion cycle refers to a period of time, in which cash funds consuming in the company's operating process to produce a product item (Mohammadi, 2009)
Risk can be defined as all types of events or circumstances that may prevent the organization from achieving its goals (Gordon et al., 2009). International Standards Organization defines the risk as a combination of the probability of an event and its effects. Thus, determining all potential risks in a process and the likelihood of their occurrence is the main part of an organization's risk assessment. Accordingly, Enterprise risk management (ERM) can be defined as an organized and continuous process throughout the organization for determination, assessment, decision making about the answer about opportunities and risks that can affect the achievement of the objectives. So, technically the risk can be either opportunity or danger (Jahanbani and Bagherpour, 2010)
Over the past few decades, significant changes have occurred in the role of risk management in the enterprises. Until the 1980s, the work of ERM commonly included insurance. During the 1990s and 2000s, the ERM was extended and included different types of risks including operational risk, credit risk and recent strategic risk. The main objective of risk management is maximizing the credit of shareholders. Enterprise risk management can help companies to reduce the cost of enterprise investment. According to mentioned contents, in this paper, we investigate the relationship between risk management and working capital management in companies accepted in Tehran Stock Exchange during the time period of 2010-2015. In fact, the following question arises: Is there any relationship between risk management and working capital management of companies? If the answer is yes, how are its type and impact?
Research Methods
This study tries to investigate the relationship between working capital management and risk management. The research sample include firms listed in Tehran Stock Exchange. The systematic method was used for sampling that applied measures to choose the sample are as following:
1) Companies listed in the main board of Tehran Stock Exchange
2) The companies must be accepted before 2010 in the Tehran Stock
Exchange
3) The required information must be available from 2010 to 2015
4) The financial period must end to helical date, in order to consistency in
reporting history and remove the seasonal effects
5) Banks and financial institutions (investment companies, financial
INTERNATIONAL JOURNAL OF ENVIRONMENTAL & SCIENCE EDUCATION 293
The final sample include 104 firms, and required research data are obtained from official website of Tehran Stock Exchange as well as special data software (Reh Award Nowin),
Research Variables
Independent Variable
Essinger (1991) defines risk management as an effective method for minimizing undesirable effects and in contrast maximizing obtained advantages from the effects of risk and Chapman (1997) knows the basic objective of risk management as improving the level of the performance process through the systematic identification of assessment and management risks related to project.
The independent variable is Risk Management. Risk Management is calculated by, dividing the standard deviation of annual net sales on the standard deviation of Return on Investments (ROI) and Return on Assets (ROA) separately, and during an average six years (Pourzamani and Karimi,2010).
The standard deviation of annual net sales is divided on SD of investment return and the return of assets of each company during six years and from the result of the division, we obtained logarithm due to large numbers and considered the result as an independent variable.
The Dependent Variable:
Working capital management is applied as dependent variable. Net Liquid Balance (NLB) and Cash Conversion Cycle (CCC) is selected as two indicators of working capital management.
Net Liquid Balance: is another indicator to determine the company's liquidity situation.in this index for indicating the company's liquidity situation, cash balance and securities are considered.This index shows the real liquidity store indices in related to unforeseen needs. The method of calculating the net liquidity balance is as follows (Shulman and Cox,1985):
In which,
NLB: Net Liquid Balance
Cash :liquidity
MKT: Marketable securities
PA: Payable papers
TA: total assets
Cash Conversion Cycle
294 ROSTAMI & MANSOORI.
Is a net time period between pay debts and get cash from the collection of receivables. The shorter the period, the company has better liquidity. The formula to calculate the cash conversion cycle is as follows (again,1974):
CCC = OC - PP Where,
OC is operation period that is calculated as follows: OC = INVP + RP
Where,
RP: The period of recovering receivables
INVP: The maintenance period of goods inventory
PP: The period of payable accounts, calculated as follows: PP=PA/DOGS
Which
PA: the remained of payable accounts
DCOGS: the cost of daily sold goods (COGS/360)
Control Variables
The reason for using control variables in this model is controlling the known and unknown causes in the relationship between dependent and independent variables (Scott et al, 2013)
Firm Size
Firm size has an impact on liquidity and working capital management because big companies have more bargaining power with their investors and customers in compare than small companies. for example, big companies can have negotiations with their suppliers to the value of discount and more period time for payment. Natural logarithm of firm assets is used as a index for firm size. (Dailof, 2003)
Profitability
Both profitability and liquidity are the core concerns of corporate managers. It is expected that profitability would have a great impact on the working capital management. A company with more investment in working capital may have more credit sales because gives long-term commercial credits to the customers (Deloof,2003). Lazaridis and Tryfonidis (2006) found that there is a negative relationship between the cash conversion cycle and evaluated profitability by operating gross profit. These researchers suggested that the shorter period length of cash conversion leads to more profit.
Return on Assets (ROA) is used as an index for profitability:
Return on Assets=
INTERNATIONAL JOURNAL OF ENVIRONMENTAL & SCIENCE EDUCATION 295
Data Analysis Method
Multivariate regression analysis is used for data analysis and testing hypothesis, this means that firstly the required data for doing the calculation and then the correlation between variables be evaluated using correlation coefficient. The statistical method used in this research is of cross-sectional data method. For testing hypothesis, first using F test, the accuracy of data integration is tested, then according to results of Hausman Test, the type of test method (fixed effects or random effects) is determined and according to the type of method, the estimation of the model is done. For measuring the significance of the whole model the F-statistic used and to evaluate the significance of coefficients of independent variables in each model statistics is used and at the %95 confidence level, took decisions for reject or accept the hypothesis.
Findings
Descriptive statistics of research variables in are presented in Table 1. Table 1: Results of descriptive statistics
NLB CCC SIZE ROA SG SROI SROA
Mean 0.123 302.088 13.655 0.176 0.227 415.992 592.227
middle 0.061 265.331 13.518 0.151 0.127 142.365 100.758
Max 1.321 411.290 18.936 0.656 15.877 13,286.280 103,000.100
Min 0.001 58.215 8.900 -0.248 -0.938 0.00078 0.00021
SD 0.182 609.929 1.430 0.141 1.017 1,037.042 4,776.394
Coefficient of variation
1.476 1.639 0.105 0.804 4.483 2.493 8.065
Skewness 3.494 11.321 0.626 0.568 10.734 7.062 18.408
Elongation 17.824 182.515 4.450 3.567 151.324 67.177 369.196
observations 624 624 624 624 624 624 624
Assess the Correlation between the Variables Table 2: Results of correlation coefficient
Probability NLB CCC SIZE ROA SG SROI SROA
NLB 1
---
CCC 0.201 1
)0.000( ---
SIZE 0.571 0.508 1
)0.000( )0.000( ---
ROA 0.410 0.391 0.172 1
)0.000( )0.000( )0.012( ---
SG 0.139 0.104 0.217 0.190 1
)0.001( )0.009( )0.000( )0.000( ---
SROI 0.238 0.173 0.370 0.316 0.090 1
)0.000( )0.000( )0.000( )0.000( )0.025( ---
SROA 0.087 0.061 0.124 0.123 0.044 0.034 1
296 ROSTAMI & MANSOORI.
According to table 2, we can say that the significance level of regression coefficients at a significant level of %5 between variables of research, there is no serious self-correlation problem.
The Test of F Limer
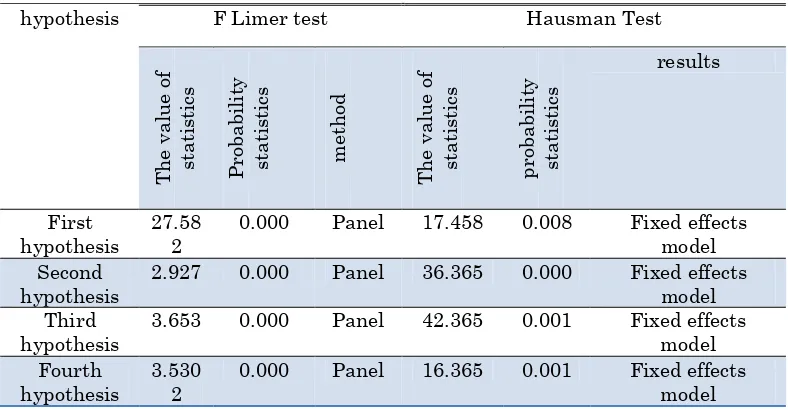
Table 3: results of F Limer and Husman tests
hypothesis F Limer test Hausman Test
1 0.000 Panel 28..17 0.007 Fixed effects model
Second hypothesis
1.918 0.000 Panel .6..61 0.000 Fixed effects
model Third
hypothesis
..61. 0.000 Panel .1..61 0.002 Fixed effects
model Fourth
hypothesis
..1.0
1 0.000 Panel 26..61 0.002 Fixed effects model
The value probability of the statistic of F Limer, for all hypothesis of research in table 3 is lower than %5 significance level and therefore, for the testing hypothesis of research, using the consolidated data is avoided.
After rejecting integration method (Pattern of common fixed amount), the researcher must use panel data and determine the type of panel data (Choose a fixed effect model or random effects model) the Hausman test is used. The test results are shown in Table 3.
According to obtained results, since the amount of P.value of Hausman test for all hypothesis of research is less than %5 significance level, therefore, we use a fixed effects model.
Testing of research hypotheses
Testing the first hypothesis
The first secondary hypothesis: there is a significant relationship between risk management of investment returns and the cash conversion period.
The model of second hypothesis test:
INTERNATIONAL JOURNAL OF ENVIRONMENTAL & SCIENCE EDUCATION 297
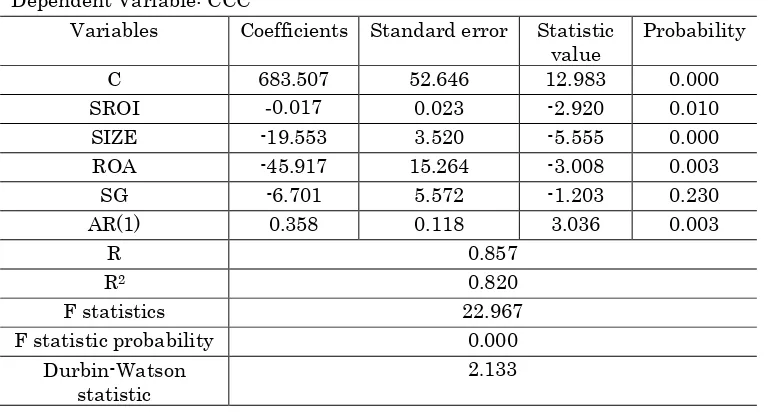
Table 4: The results of the second research hypothesis Dependent Variable: CCC
Variables Coefficients Standard error Statistic
value
Probability
C 683.507 52.646 12.983 0.000
SROI -0.028 0.013 -2.920 0.010
SIZE -19.553 3.520 -5.555 0.000
ROA -45.917 15.264 -3.008 0.003
SG -6.701 5.572 -1.203 0.230
AR(1) 0.358 0.118 3.036 0.003
R 0.857
R2 0.810
F statistics 22.967
F statistic probability 0.000
Durbin-Watson statistic
1.133
The results of the regression model are presented in Table 5 with GLS least generalized squares method. According to obtained results, we can say that, all of the characteristics of a company (Company size, profitability, as firm characteristics) affecting working capital management.
The results in Table 5 shows that the relationship of Cash Conversion Cycle with Risk Management of Return on assets is negative (-0.001) and is significant considering the probability of t-statistic (0.001).Also, results associated with F-statistics show that the model is significant in general and according to Durbin-Watson statistic lacks the problem of autocorrelation. In addition, results related to adjust the determination coefficient shows that in total research period almost %82 of changes of the cash conversion cycle has been under the influence of risk management of return on assets and also controlled variables. According to significantly the relationship between the cash conversion cycle Return on assets with risk management, the second secondary hypothesis of the main research hypothesis is confirmed.
The Third Hypothesis Testing
The third secondary hypothesis: there is a significant relationship between risk management of investment returns and Net Liquid Balance.
The model of third hypothesis test:
The obtained results of the regression model with GLS generalized least squares presented in the table (6). According to obtained results, we can say that all attributes a company (Company size, profitability, as firm characteristics) affecting the management of corporate capital.
298 ROSTAMI & MANSOORI.
%65 of changes of the Net Liquidity Balance has been under the influence of risk management of return on investment and also controlled variables. According to significantly the relationship between the Net Liquid Balance with Return on investment with risk management, the third secondary hypothesis of the main research hypothesis is confirmed.
Table (6): the regression analysis of the third hypothesis Dependent Variable: NLB
Variables Coefficients Standard error Statistic
value
Probability
C 0.064 0.015 4.383 0.000
SROI -0.013 0.000 -4.935 0.000
SIZE 0.005 0.001 5.058 0.000
ROA -0.025 0.008 -3.251 0.001
SG 0.001 0.001 0.480 0.632
AR(1) 0.126 0.088 2.429 0.015
R 0.728
R2 0.656
F-statistic 10.190
F statistic probability 0.000
Durbin-Watson statistic 2.309
The fourth hypothesis testing of research
The fourth secondary hypothesis: there is a significant relationship between risk management of return on assets and Net Liquid Balance.
The fourth test research hypotheses:
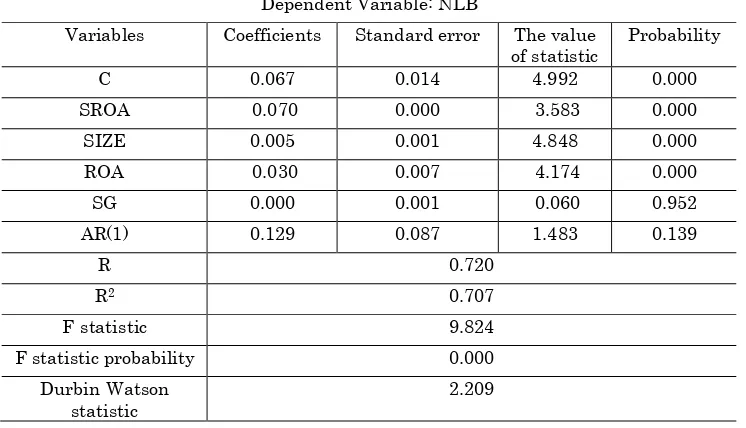
Table 7: results of regression analysis of fourth research hypothesis Dependent Variable: NLB
Variables Coefficients Standard error The value
of statistic
Probability
C 0.067 0.014 4.992 0.000
SROA -0.070 0.000 -3.583 0.000
SIZE 0.005 0.001 4.848 0.000
ROA -0.030 0.007 -4.174 0.000
SG 0.000 0.001 -0.060 0.952
AR(1) 0.129 0.087 1.483 0.139
R 0.720
R2 0.707
F-statistic 9.824
F statistic probability 0.000
Durbin-Watson statistic
INTERNATIONAL JOURNAL OF ENVIRONMENTAL & SCIENCE EDUCATION 299
The obtained results of the regression model with GLS generalized least squares presented in the table (7). According to obtained results, we can say that all attributes a company (Company size, profitability, as firm characteristics) affecting the management of corporate capital.
The results in Table 7 shows that the relationship of Net Liquid Balance with Risk Management of Return on assets is negative (-0.070) and is significant considering the probability of t statistic (0.000). Also, results associated with F-statistics show that the model is significant in general and according to Durbin-Watson statistic lacks the problem of autocorrelation. In addition, results related to adjust the determination coefficient shows that in total research period almost %70 of changes of the Net Liquid Balance has been under the influence of risk management of return on assets and also controlled variables. According to significantly the relationship between the Net Liquid Balance with Return on assets with risk management, the fourth secondary hypothesis of the main research hypothesis is confirmed.
Discussions and Conclusion
The purpose of this research was to evaluate the relationship between risk management and working capital management in companies accepted in Tehran Stock Exchange during the time period of 2010-2015.Results indicated that there is a negative and significant relationship between risk management of investment return and the cash conversion cycle. It can be stated that as the risk management be effective through investment, the length of the cash conversion cycle in companies would be lower. In other words, whatever the managers are more willing to invest in current assets and increased the duration of the cash conversion cycle, risk management will be more inefficient. The results obtained from this hypothesis are consistent with previous research results of Raee et al (2004), Jamee (2001), Sharp et al, (1995), Deloof (2003), Moradi and Najjar (2013).
Results suggested that there is a negative and significant relationship between return on assets and the cash conversion cycle. It can be stated that the existence of risk management through company's return on assets, leads to decrease the length of the cash conversion cycle. In other words, corporate managers to reduce the risk of return assets using fewer investment policies in current assets and they are involving more in, constant assets that have less for the company. Results of this hypothesis are consistent partly with results of Zohdi et al (2010), Epohami (2008), Raee et al (2004), Jamee (2001), Sharp et al, (1995), Deloof (2003), Moradi and Najjar (2013).
Results indicated that there is the negative and significant relationship between risk management of investment returns and Net Liquid Balance.it can be stated that existence risk management through company’s investment will lead to a decrease of holding liquidity and cash equivalents. In other words, corporate managers less using investing policies in current assets for decrease risk of return on invest and they are involving more in, constant assets that have less for the company. The results of this hypothesis are consistent partly with results of Nikomaram et al (2006), Horn (1969) Zohdi et al Moradi and Najjar (2013).
300 ROSTAMI & MANSOORI.
that existence risk management through returns on assets will lead to a decrease of holding liquidity and cash equivalents.In other words, corporate managers less using investing policies in current assets for decrease risk of return on assets and they are involving more in, constant assets that have less for the company. The results of this hypothesis are consistent partly with results of Nikomaram et al (2006), Zohdi et al Moradi and Najjar (2013).
Notes on contributors
Reza Rostami- Department of Accounting, Mahabad Branch Islamic Azad University, Mahabad, Iran
Ebrahim Mansoori- Department of Accounting, Mahabad Branch Islamic Azad University, Mahabad, Iran
References
Appuhami, Ranjith, (2008), The Impact of Firms’ Capital Expenditure on Working Capital
Management: An Empirical Study across Industries in Thailand, International Management
Review, 4(1), 8-21.
Deloof, M. (2003). Does Working Capital Management Affect Probability of Belgian Firm?, Journal of Business, Finance and Accounting 30 (3-4), 573-588.
Dianati Deylami, Z, and Barzegar, M (2014), risk management model of receivable accounts, Journal of Scientific Research, knowledge accountants and management auditors, third-year / 11 / Autumn 2014
Gitman, L. J. (1974). Estimating Corporate Liquidity Requirements: A Simplified Approach, The
Financial Reviews, 9(1), 79-88.
Gordon, Lawrence A. Loeb, Martin P., Tseng, Chih-Yang, (2009), "Enterprise Risk Management and
Firm Performance: A Contingency Perspective", J. Account. Public Policy ,10 982– 910.
Heybati, F, and Mosavi, S (2011), predicting the stock exchange index using modeling, the special journal of capital market / Number Seven, Summer 2011.
Jahanbani, M and Bagherpour Velashani, M, (2010), internal audit based on modern equipment at the service of risk management, Official Accountants, 9, 33-42.
Jamee, H, (2001), The study of liquidity and working capital policies in pharmaceutical companies listed on the stock exchange, University, Tehran Securities during 1999, Esfahan,2001. Maslach, C., Schaufeli, W. B., &Leiter, M. P. (2001). Job burnout. Annual Review of Psychology, 52, Maslow, A. (1970). Motivation and personality (2nd ed). New York: Harper and Row.
Meyer, J. P., & Allen, N. J. (1997). Commitment in the workplace: Theory, research, and application. Thousand Oaks, CA: Sage
Mohammadi.M. (2009), The impact of working capital management on the profitability of the company listed on the Tehran Stock Exchange, Accounting Studies, 23, 65-43.
Moradi, M and Shafiee Sardasht, M and Memar PourYazdi, M (2014), the relationship of working
capital management strategies at the corporate market value, Empirical Research in
Accounting 3, 3.
Naumann, S.E., & Bennett, N. (2000). A case for procedural justiceclimate: Development and test of multi-level model. Academy of Management Journal, 43, 881-889.
Nikoomaram, H, O, Rahnamae Roodposhti, F and Heybati, F (2007) " Financial Management Basics" second volume, Termeh Publications
Nocco, B. W., & Stulz, R. M. (1006). Enterprise risk management: Theory and practice. Journal of
Applied Corporate Finance, 27(.), 7e10.
Parker, C.P. Baltez, B.B., Young. S.A., Huff, J.W. Altmann, R.A. & Lacost, H.A. (2003). Relationships between psychological climateperceptions and work outcomes: A meta-analytic review. Journal of Organizational Behavior, 24, 389-416.
Pourzamani, Z, and Karimi, A, (2010), The impact of risk management and intellectual capital on firm performance, Journal of Financial Studies, Number six, Summer 2010.
Raee, R, and Saeedi (2006), Principles of Financial Engineering and Risk Management, Publication of the study and development of Humanities books (SMT)
INTERNATIONAL JOURNAL OF ENVIRONMENTAL & SCIENCE EDUCATION 301
Reeve, C. L., & Smith, C. S. (1002). Refining Lodahl and Kejner’s job Involvement Scale with a convergent evidence approach: Applying multiple methods to multiple samples. Organization Research Methods, 4 (2), 91-111.
Resick, C. J., Baltes, B. B., & Shantz, C. W. (2007). Person-organization fit and work-related attitudes and decisions: Examining interactive effects with job fit and conscientiousness. Journal of Applied Psychology, 92, 1446-1455.
Rhoades, L., Eisenberger, R., & Armeli, S. (2001). Affective commitment to the organization: The contribution of perceived organizational support. Journal of Applied Psychology, 86, 825-836. Richman, A. (2006). Everyone wants an engaged workforce how can you create it? Workspan, 49,
36-9.
Saks, A. M. (2006). Antecedents and consequences of employee engagement. Journal of Managerial Psychology, 21, 600-619.
Schaufeli, W. B., & Bakker, A. B. (2004). Job demands, job resources, and their relationship with burnout and engagement: A multi-sample study. Journal of Organizational Behavior, 25, 293. Schaufeli, W. B., Bakker, A. B., & Salanova, M. (2006). The measurement of work engagement with
a short questionnaire: A cross-national study. Educational & Psychological Measurement, 66, 701.
Shantz, A., Alfes, K., Truss, C., and Soane, E. (2013). The role of employee engagement in the relationship between job design and task performance, citizenship and deviant behaviours. The International Journal of Human Resource Management, 24, 2608-2627.
Sharp, J. M & Irani, Z & Desai, S. (1999) Workings towards agile manufacturing in the UK industry, International Journal of production economics, 62 : 155-196.
Shuck, B., Thomas, G. Reio, Jr & Tonette, S. R. (2011). Employee engagement: An examination of
antecedent and outcome variables, Human Resource Development, International, 14:4,
427-445.
Shulman, J., and Cox, R. (2971). “An Integrative Approach to Working Capital Management”, Journal Cash Management, 64-67.
Smith, K. K., & Berg, D. N. (1987). Paradoxes of group life. San Francisco: Jossey Bass
Sonnentag, S. (2003). Recovery, work engagement, and proactive behavior: A new look at the
interface between nonwork and work. Journal of Applied Psychology, 88, 518–528.
Steel, R. P., & Ovalle, N. K. (1984). A review of the meta-analysis of research on the relationship between behavioral intentions and employee turnover. Journal of Applied Psychology, 69, 673. Thomas, C. H. (2007). A new measurement scale for employee engagement: Scale development, pilot
test, and replication. Academy of Management Proceedings, 2¬6, 6.
Wagner, R., & Harter, J. K. (2006). The great elements of managing. Washington, DC: The Gallup Organization.
Welbourne, T. (2007). Engagment: Beyond the fad in to the executive suite.Leader to Leader, 44, 45-51.