For further information. please contact:
Economic Outlook & Policy Dissemination
Bureau of Monetary Policy
Directorate of Economic Research and Monetary Policy
Telephone : +62 61 3818163
+62 21 3818206
Fax.
: +62 21 3452489
MONETARY POLICY REPORT
BANK INDONESIAThe Monetary Policy Report is published quarterly by Bank Indonesia after the Board
of Governors’ Meetings in January, April, July, and October. In addition to fulfilling the
mandate of article 58 of Act Number 23 of 1999 concerning Bank Indonesia, amended
by Act No. 3 of 2004 and Act No. 6 of 2009, the report has two main purposes: (i)
to function as a tangible product of a forward-looking working framework in which
formulation of monetary policy is based on economic and inflation forecasts; and (ii) as
a medium for the Board of Governors of Bank Indonesia to present to the public the
various policy considerations underlying its monetary policy decisions.
The Board of Governors
Darmin Nasution
Senior Deputy Governor
Hartadi A. Sarwono
Deputy Governor
S. Budi Rochadi
Deputy Governor
Muliaman D. Hadad
Deputy Governor
Ardhayadi Mitroatmodjo
Deputy Governor
Budi Mulya
Deputy Governor
Halim Alamsyah
Deputy Governor
MONETARY POLICY REPORT
BANK INDONESIAMonetary Policy Strategy
Underlying Principles
Under the ITF. the inflation target is established as the overriding objective and nominal anchor for monetary policy. In this regard. Bank Indonesia has adopted a forward looking strategy by guiding the present monetary policy response for achievement of a medium-term inflation target.
The application of the ITF does not mean that monetary policy disregards economic growth. The basic monetary policy paradigm of striking the optimum balance between inflation and economic growth is retained in both setting the inflation target and in the monetary policy response by focusing on achievement of low. stable inflation in the medium to long-term.
The Inflation Target
Government upon coordination with Bank Indonesia has set and announce an inflation target of CPI every year. Based on KMK No.1/KMK.011/2008, the inflation targets established by the Government for 2008-2010 are 5.0%, 4.5% and 4.0% with ±1% deviation. However, based on the latest developments, Bank Indonesia has proposed new inflation target to the government. The proposed inflation target for 2010-2012 are 5% ± 1%, 5% ± 1%, and 4.5% ± 1% respectively.
Monetary Instruments and Operations
The BI Rate is the published policy rate reflecting the monetary policy stance adopted by Bank Indonesia. The BI Rate is a signal for achieving the medium to long-term inflation target and is announced periodically by Bank Indonesia for a specific period. To strengthen the operational framework for monetary policy. Bank Indonesia changed from use of the 1-month SBI rate as the operational target to the overnight interbank rate with effect from 9 June 2008. In monetary operations. the BI Rate is implemented through liquidity management on the money market to achieve the monetary policy operational target. reflected in movement in the overnight interbank money market rate. To enhance the effectiveness of liquidity management on the market. a set of standing facilities in combination with an interest rate corridor is employed in day-to-day monetary operations.
Policymaking Process
The BI Rate is determined by the Board of Governors in the Monthly Board of Governors’ Meeting. In unforeseen circumstances. the monetary policy stance may be adjusted in advance of the Monthly Board of Governors’ Meeting in a weekly Board of Governors’ Meeting. Changes in the BI Rate essentially depict the Bank Indonesia monetary policy response for guiding the forecasted level of inflation within the limits of the established inflation target.
Transparency
Monetary policy is regularly communicated to the public through customary media for communication. such as statements to the press and market actors. website postings and publication of the Monetary Policy Report (MPR). This transparency is aimed at building improved understanding and shaping public expectations of the economic and inflation outlook and the monetary response taken by Bank Indonesia.
Coordination with the Government
For the purpose of coordination in inflation targeting. monitoring and control. the Government and Bank Indonesia have established a team of officials representing the various relevant agencies. The task of the Team is to deliberate and recommend the necessary policy actions for the Government and Bank Indonesia in managing inflationary pressures for achievement of the established inflation target.
Steps for Reinforcing Monetary Policy with the Overriding Objective of Price Stability (Inflation Targeting Framework)
In July 2005. Bank Indonesia launched a reinforced monetary policy framework consistent with the Inflation Targeting Framework (ITF). encompassing four key elements: (1) use of the BI Rate as the policy reference rate. (2) anticipatory monetary policymaking process. (3) more transparent communications strategy and (4) closer policy coordination with the Government. These measures are intended to strengthen monetary policy effectiveness and governance in order to achieve the overriding objective of price stability in support of sustainable economic growth and greater public prosperity.
Enhanced Monetary Policy Measures
Under Inflation Targeting Framework
MONETARY POLICY REPORT
BANK INDONESIAForeword
The global economic recovery moved forward in Q2/2010 despite pressures on global financial markets and fears over the sustainability of recovery in Europe. The latest indicators for 2010 point to more robust recovery in advanced economies, most importantly the United States and Japan. Similarly, recovery is progressing more rapidly in Asia’s emerging economies, led by China, India and the ASEAN-5, and has become a major driving force in global economic recovery. So far, the European crisis has produced more tangible impact in global financial market volatility albeit with no significant effect on global recovery in 2010.
Indonesia has seen steady improvement in the performance of the economy alongside monetary stability and financial system stability. The ongoing improvement in the global economy had a positive effect on Indonesia’s external sector performance and investment during Q2/2010. Domestic economic recovery has gained added momentum, relying not only on consumption but also bolstered by investment and exports. These upbeat economic developments are supported by prudently managed financial system stability reflected in stable banking industry growth and the onset of more rapid credit expansion. Improvement in external sector performance is reflected in the solid balance of payments, with surpluses in the current account and financial transaction account running ahead of original estimations. These surpluses are consistent with the improvement in the global economy and mounting foreign capital inflows following the upgrading Indonesia’s credit rating outlook and positive international perceptions of Indonesia. Supporting this is the launching of a Bank Indonesia policy package on 16 July 2010 that has met with positive response from a wide range of domestic and international market actors, coupled with strengthened monetary management and financial market deepening in Indonesia. Bank Indonesia estimates Indonesia’s economic growth in Q2/2010 at about 6%.
Looking forward, the gains in global and domestic economic developments during Q2/2010 are predicted to continue. Economic growth in 2010 is forecasted near the upper end of the 5.5%-6.0% projected range. Continued growth in exports and investment is expected to drive increased consumption and take economic growth to higher levels in 2010 and 2011. In 2011, the economy is forecasted to grow in the range of 6.0%-6.5%. In regard to prices, Bank Indonesia will keep a close watch on signs of intensifying inflationary pressure. During the remaining months of 2010, inflationary pressure is expected to mount mainly in response to increased electricity billing rates, the arrival of
MONETARY POLICY REPORT
BANK INDONESIAthe Ramadan fasting month and Eid-ul-Fitr festivities and higher food prices resulting from uncertainties in seasonal conditions. In 2011, inflationary pressure may be fuelled by more constrained supply-side responses to mounting demand, a trend expected to persist. Bank Indonesia will keep a close watch on escalation inflationary pressure and make the necessary adjustments in the monetary policy response to keep inflation on track with the targeted range of 5%±1% in 2010 and 2011.
Jakarta, July 2010
Acting Governor of Bank Indonesia
Monetary Policy Report - Quarter III-2009
Contents
MONETARY POLICY REPORT
BANK INDONESIAContents
1. General Review ... 1
2. Latest Macroeconomic Indicators... 4
Deveopments In The World Economy ... 4
Economic Growth ... 7
Balance of Payments ... 13
3. Monetary Indicators and Policy, Q2-2010 ... 15
Rupiah Exchange Rate ... 15
Inlation ... 16
Monetary Policy ... 19
4. The Indonesian Economic Outlook ... 28
Assumptions ... 28
Economic Growth Outlook ... 30
Inflation Forecast ... 37
Risk ... 38
5. Monetary Policy Response, Q2-2010 ... 39
Monetary Policy Report - Quarter III-2009
Contents
1. General Review
The Indonesian economy gained added momentum during Q2/2010. Optimism was buoyed by investment performance and accelerated export growth in keeping with the recovery in the global economy. Conditions in the economy, marked by growing optimism, support a more upbeat outlook compared to earlier forecasts. In 2010, Indonesia’s economic growth is heading for the upper limit of the 5.5%-6.0% range and in 2011 is predicted to reach 6.0%-6.5%. In regard to prices, inflationary pressure mounted higher in Q2/2010 in response to developments in volatile food items, led by miscellaneous seasonings and rice. In contrast, administered prices and core inflation accounted for a minimum contribution to price movements during Q2/2010. Accordingly, for the year as a whole, CPI inflation will remain within the 5%±1% inflation targeting range.
The global economic recovery charted further progress despite pressures on global financial markets and concerns over the sustainability of recovery in Europe. In estimates for Q2/2010, global recovery moved at a more moderate pace compared to Q1/2010. Nevertheless, these developments have reinforced optimism in the process for global recovery with added support from improving conditions in advanced economies, led by the US and Japan, and some Asian countries. In Asia, economic growth gathered pace except in China, where activity slowed somewhat due to government policy actions in response to signs of overheating. Pressure from the European crisis bore down on global financial markets throughout Q2/2010, as reflected in plunging stock indices worldwide and sharp increases in CDS and yield spreads for the PIIGS nations (Portugal, Italy, Ireland, Greece and Spain). In Asia, flight to quality was indicated by net selling by foreign investors on stock markets, weakening in regional currencies and increased CDS on sovereign debt. So far, the European crisis has taken its toll more on global financial markets and has not significantly affected the overall outlook for global economic recovery. Various measures pursued by the crisis-hit nations in Europe, such as austerity programmes and aid from the EU and IMF, have quelled the turmoil that beset global financial markets during Q2/2010.
Domestic economic performance in Q2/2010 is estimated ahead of earlier projections. During Q2/2010, the domestic economy grew by an estimated 6.0%, surpassing the original projection at 5.7%. Key to this optimism is renewed momentum in investment growth. In Q2/2010, investment growth reached an estimated 10% (yoy) in response to strengthening domestic and external demand. The more favourable investment climate also received a boost from the upgrading of Indonesia’s sovereign credit rating in keeping with improvement in economic fundamentals. In analysis by sector, economy performance in 2010 is fuelled by the trade, hotels and restaurants sector and transport and communications. The accelerated pace of the domestic economy also requires support primarily in relation to more rapid implementation of infrastructure programmes.
improving economic performance in the regions is supported mainly by stronger consumption, investment and exports. The brisk pace of household consumption growth in these regions is evident in the increased growth in consumption lending, sustained high growth in retail sales and stable farmer terms of trade in some areas. In addition, the elections for regional heads of government during Q2/2010 have also boosted consumption in the regions. Investment is growing mainly in the area of construction. Vibrant activity in construction investment is under way in Sumatra, Jakarta and Java, Bali and Nusa Tenggara. The construction investment in these regions mainly involves property developments for commercial and residential use. Export growth continues at a brisk pace for mining commodities from Kalimantan, Sulawesi, the Moluccan island, Papua and Sumatra, and for manufactured products from Jakarta, Bali and Nusa Tenggara.
In regard to prices, inflationary pressure gathered pace in Q2/2010 due to developments in non-fundamentals. Increased prices for seasonings and rice throughout the second quarter generated significant upward pressure on CPI inflation. In June 2010, CPI inflation was recorded at 0.97% (mtm), up from earlier months marked by inflation at 0.15% in May and -0.14% in April 2010. Taken together, CPI inflation in Q2/2010 reached 1.41% (qtq) or 5.05% (yoy), up significantly from 0.99% (yoy) and 3.43% (yoy) in the preceding quarter. The strong inflation in foodstuff commodities is explained by supply constraints caused by problems in production and distribution following heavy rains in some areas. In contrast, developments in the administered prices category had little effect on CPI inflation. On the fundamentals side, pressure from core inflation remains low with support from subdued inflation expectations, minimum pressure from externals and adequate supply-side response to rising demand. Despite increased inflationary pressure during Q2/2010, CPI inflation for the year as a whole is predicted to stay within the 5%±1% inflation targeting range.
The more conducive condition of the global economy and robust domestic economic fundamentals have enabled Indonesia to maintain a solid balance of payments position. The current account posted an estimated surplus, mainly in response to the steady improvement in the global economy and upward trend in global commodity prices. Estimates for the capital and financial account in Q2/2010 also point to a surplus. The surplus in the capital and financial account is again bolstered by renewed inflows of foreign capital in keeping with easing of global financial market jitters and improvement in Indonesia’s credit rating outlook. Taken together, international reserves at end-June 2010 stood at 76.3 billion US dollars, equivalent to 5.9 months of imports and servicing of official external debt.
Financial markets showed overall improved performance during Q2/2010, despite coming under pressure in May 2010. Conditions on the government securities and capital markets have progressively improved in the wake of pressures in May 2010 from negative sentiments over the European debt crisis. Key to the gains on the capital and government securities markets in Q2/2010 were renewed inflows of foreign investor funds and the subsiding of the stock market bubble. Conditions on the interbank money market reflected adequate levels of liquidity during Q2/2010. The widening of the overnight interbank interest rate corridor on 17 June 2010 helped to ease the overnight rate. Improvement in global conditions and domestic fundamentals has also brought improvement in monetary policy transmission. Reflecting this is the downward movement in bank deposit and lending rates accompanied by rising credit expansion, estimated at 18.6% in June 2010.
At the micro level, conditions in the national banking system are stable. Reflecting this is the still comfortable level of the capital adequacy ratio (CAR) at 17.8% in May 2010. Similarly, the gross non-performing loans (NPLs) ratio remains subdued at 3.6% with the net ratio at 1%. Furthermore, liquidity in the banking system, including the interbank money market, has progressively improved alongside continued growth in depositor funds.
2. Latest Macroeconomic Indicators
The ongoing process of global economic recovery has also contributed to more robust performance in the domestic economy. During Q2/2010, the increasingly broad-based recovery in the global economy was supported by solid economic performance in Asia with positive impact on the domestic economy. In Q2/2010, economic growth outperformed earlier forecasts on the strength of more robust exports and indications of mounting investment. Growing demand in trading partner nations coupled with high commodity prices has had a positive effect on export performance. In a similar vein, business optimism for improvement economic conditions, improvements in the domestic investment climate and plans for government-sponsored infrastructure projects strengthened investment performance. Household consumption similarly maintained an upward trend, bolstered by strong public purchasing power and buoyant consumer optimism. On the supply side, rising exports and imports are expected to strengthen performance in manufacturing, trade and the hotels and restaurants sector. Growing export demand will generate a positive contribution for manufacturing, while higher exports will bring greater activity to the trade, hotels and restaurants sector. On the other hand, less vigorous growth in agriculture growth is expected for Q2/2010, mainly due to the shift in the harvest season to early Q2/2010. The other high-growth sectors are electricity, gas and water utilities, in which the kerosene conversion programme is moving forward in some regions and several powerplants in the Phase I 10,000MW project have entered service, and the transport and communications sector as a result of market penetration by telecommunications operators.
DEVELOPMENTS IN THE WORLD ECONOMY
The global economy made further progress in recovery during Q2/2010, despite escalating turmoil on global economic markets triggered by the European debt crisis.
During Q2/2010, global financial markets weakened in response to downturn in the Greek crisis. The buoyant optimism in early Q1/2010 has now retreated due to the worsening of the European debt crisis. Downgraded ratings for PIIGS nations and weakening indicators for Europe’s economic fundamentals set off a round of panic on global financial markets. To calm the turmoil, European governments and the IMF announced a €110 billion
aid package for Greece in May 2010. However, this has failed to dispel fears of a contagion effect from the Greek crisis on other European nations that has compelled European governments and the IMF to announce a new €750 billion aid package under the European
Stabilisation Mechanism.
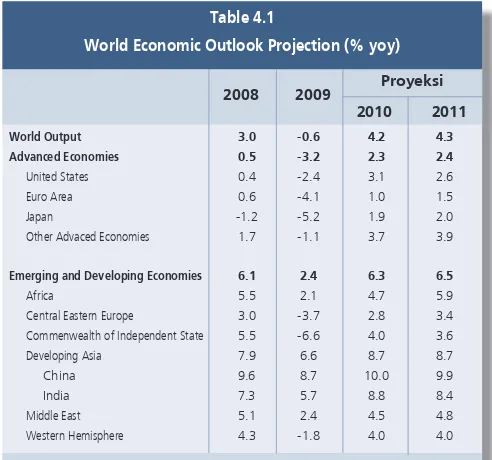
Amid the turmoil on global financial markets, the world economy charted more vigorous growth during Q2/2010, bolstered by the manufacturing sector. Composite data on realised growth and Consensus Forecasts for various nations indicates that world economic growth in Q2/2010 reached 4.9% (yoy). However, the outlook is for slightly reduced economic growth in developing nations due to the slowdown in the Chinese economy brought on by monetary tightening in that nation. Advanced economies are forecasted to chart higher growth, fuelled by economic growth in the US, Canada, Japan and Germany. These growth estimates are consistent with leading economic indicators for various countries reporting positive growth and global PMI indicators now in expansionary territory (PMI index > 50).
Estimates of US growth during Q2/2010 suggest vigorous performance bolstered by manufacturing activity. Manufactured products have become the engine of US economic recovery as external demand recovers. The renewed strength of the manufacturing sector1 has generated more employment, although unemployment levels as a whole remain high. Mounting retail sales have resulted in drawing down of inventories, with business responding by increasing production as reflected in the rising purchasing manager index (PMI), capacity utilisation and the industrial production index. Regarding households, the consumption trend is steadily climbing, as reflected in strengthening consumer confidence. However, high unemployment and tight bank lending continue to hamper improvement in household consumption. Accordingly, US economic growth is forecasted at 3.6% (yoy).
Most European economies have improved, with the exception of the PIIGS nations (Portugal, Ireland, Italy, Greece and Spain. On the production side, conditions in Europe have picked up as indicated by gains in industrial production, capacity utilisation and the manufacturing sector PMI. This improvement was driven largely by industrial sectors in Europe’s major economies (Germany and France). However, production indices for the PIIGS nations have declined due to weakening domestic consumption. Household consumption in Europe faces persistent challenges from rising unemployment, while fiscal stimulus options have become more constrained to due tightening of fiscal spending. In view of these challenges, European recovery is likely to progress slowly, as reflected in economic growth forecasts still in the range of 1.0% (yoy).
1 According to the latest data release, US non-farm payrolls were up in May although more in response to greater public sector
Asian economies remain on a growth track despite indicators of slowing growth in the Chinese economy. Rising exports and solid domestic demand have been the key forces in Asia’s economic growth. Key factors stimulating domestic demand include positive wealth assets alongside rising housing prices and stock market indices in Asia and central bank decisions to maintain interest rates at accommodative levels. China and India are two Asian nations that are moving forward with positive growth trends in their economies fuelled by domestic demand. However, the slowdown in China’s economy could affect other Asian economies as China acts to reduce its dependence on the external sector and rein in bank lending. China and India, the economic engines of Asia, charted an estimated 10.7% (yoy) and 8.7% (yoy) growth in Q2/2010.
World inflation edged upwards in Q2/2010, although remaining very low. World inflation was recorded at 3.2% (yoy) in May 2010, largely unchanged from one quarter earlier. This is also consistent with weak consumption. Inflation in developed nations has stayed low. In the US, CPI inflation in May reached 2.0% (yoy), relatively stable when compared to the March 2010 inflation of 2.3% (yoy). In the Eurozone, May 2010 inflation was recorded at 1.6%, within the 2.0% ECB target. In contrast to this consolidating trend, Japan remains mired in deflation. During May 2010, the Japanese CPI registered -0.9% growth (yoy). However, inflationary pressure in developing nations is on the rise. Brisk economic growth is stoking inflationary pressure in Asian economies, as reflected in escalating consumer prices in China and India. China’s inflation reached 3.1% (yoy) in May, surpassing the central bank target set at 3.0% (yoy). Similar inflation was recorded in India. India’s Wholesale Price Index mounted 10.16% (yoy) in May, well ahead of the 5.0% (yoy) targeted by the central bank. Inflationary pressure in other nations is also on the rise, despite some easing in May.
ECONOMIC GROWTH Aggregate Demand
Economic growth in preliminary figures for Q2/2010 reached 6.0% (yoy), ahead of the Q1/2010 level of 5.7% (yoy). This higher growth is being fuelled by more robust domestic demand and growing external demand (Table 2.1). The continued recovery in the global economy is driving brisk growth in exports and imports, although at a slightly slowed pace compared to before. In further developments, investment growth has improved in response to escalating demand, improvements in the domestic investment climate and launching of government projects. Mounting demand from domestic and external actors is fuelling rapid growth in imports. Domestic demand has mounted in response to sustained high levels of purchasing power, increased bank financing and improving business tendencies in the business community.
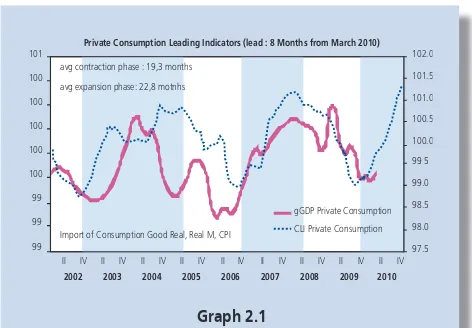
Given the positive developments in key indicators, estimates for household consumption in Q2/2010 point to increased growth. Rising household consumption is evident from movement in leading household consumption indicators showing that household consumption growth is in the expansionary phase of the cycle (Graph 2.1). The buoyant increase in household consumption during Q2/2010 is borne out in rapid ascending sales of motor vehicles, electronic goods and imported food and non-food consumer goods as of May 2010 (Graph 2.2). Increased consumption has been financed not only from export earnings, but also higher incomes resulting from the 5% salary raise for civil servants, military and police, increases in regional minimum wage levels for 2010 and the organisation of the Regional Head of Government elections commencing in Q2/2010. The upward trend in private consumption growth was also bolstered by seasonal factors, with school holidays commencing at the end of Q2/2010. In response to these developments, private consumption climbed 4.9% (yoy) in preliminary figures for Q2/2010, up from the preceding quarter.
Graph 2.1
Private Consumption Leading Indicator
���� ���� ���� ���� ��� � ����� ����� ����� ����� �����
�� �� �� ��� ��� ��� ��� ��� ���
�� �� �� �� �� �� �� �� �� �� �� �� �� �� �� �� �� ��
���� ���� ���� ���� ���� ���� ���� ���� ���� ������������������������������������������������������������������������
������������������������ ����������������������� ��������������������������������������������
����������������������������������� ��������������������������������
I II III IV I II III IV I II*
I t e m
Table 2.1
Economic Growth - Demand Side
* Bank Indonesia Projection
Total Consumption 4.9 5.5 5.5 6.3 6.4 5.9 7.3 6.3 5.4 5.9 6.2 2.5 4.0
Private Consumption 5.0 5.7 5.5 5.3 4.8 5.3 6.0 4.8 4.7 4.0 4.9 3.9 4.9
Government Consumption 3.9 3.6 5.3 14.1 16.4 10.4 19.2 17.0 10.3 17.0 15.7 -8.8 -1.5
Gross Fixed Capital Formation 9.4 13.9 12.2 12.3 9.4 11.9 3.5 2.4 3.2 4.2 3.3 7.9 10.0
Export Good and Services 8.5 13.6 12.4 10.6 2.0 9.5 -18.7 -15.5 -7.8 3.7 -9.7 19.6 14.6
Import Good and Services 9.0 18.0 16.1 11.1 -3.7 10.0 -24.4 -21.0 -14.7 1.6 -15.0 22.6 15.8
GDP 6.3 6.2 6.3 6.2 5.3 6.0 4.5 4.1 4.2 5.4 4.5 5.7 6.0
2007 2008 2008 2009 2009 2010
Consumer optimism is on the rise in response to strengthening confidence in the condition of the economy and higher expectations for future incomes. Reflecting this is the Consumer Confidence Index (CCI) generated by the Bank Indonesia Consumer Survey, recorded at 111.4 points for June 2010 or up 1.5 points from the preceding month. The rise in the CCI is supported by more optimistic consumer perceptions of current economic conditions and economic conditions 6 months in the future as household incomes are forecasted to rise. The Consumer Tendency Index released by the Central Statistics Agency (BPS) emulated the optimistic trend in the BI CCI by climbing to 106.49 in Q2/2010 from the Q1/2010 level of 102.58. This rise was driven mainly by consumer expectations of higher household incomes.
Investment growth is estimated higher in preliminary figures for Q2/2010, buoyed by strengthening domestic demand, more vigorous demand for exports and a conducive business climate. The stronger investment growth is supported by a conducive domestic investment climate and reforms in various investment regulations. Positive indications of higher non-construction investment are reflected in rising imports of capital goods and raw materials and sales of commercial vehicles (Graph 2.3). A similar pattern is also evident in high levels of cement consumption related to realised investment in the construction sector and infrastructure projects. Business sentiment is also upbeat in trading partner nations. This improvement in business sentiment will benefit exports, which in turn will foster business optimism for large orders placed by overseas buyers and thus stimulate further expansion of business activity, primarily in industry. The upbeat trend in business activity during Q2/2010 is reflected in the latest developments in investment leading indicators pointing to more robust investment growth (Graph 2.4).
Developments in a range of prompt indicators confirm the potential for increased investment growth during Q2/2010. Rising cement consumption points to a more buoyant outlook for construction investment (Graph 2.5). Construction has seen a flurry of investment in the property sector and infrastructure projects. Lower interest rates on investment credit during Q1/2010 offer potential for further acceleration of investment growth (Graph 2.6). Stronger financing support from the banking industry and finance companies is reflected in more vigorous growth in investment credit and leasing. Similarly, the strengthening trend in realisation of FDI and domestic investment projects during Q1/2010 is predicted to continue.
Graph 2.4
Investment Leading Indicator
�� �� �� ��� ��� ��� ��� ��� ��� ���� ���� ���� ���� ���� ���� ���� ���� ���� ��������������������������������������������������������������� ������� ��� �������������������������������������������� ����������������������������� ����������������������������������� ��������������������������������� �� �� �� �� �� �� �� �� �� �� �� �� �� �� � ��� � ��� ��� ��� �� � � �� �� �� �� �� ������ ����� ��� ���� ����� ����� ����� � �� ��� �� � �� ��� �� � �� ��� �� � �� ��� �� � �� ��� �� � �� ��� �� � ��� ���� ���� ���� ���� ���� ���� ���� �������������������� �������������������� ������������ ���������������������������� ����������������� ����� ����� Graph 2.3
Investment Prompt Indicators
Exports maintained high growth in estimates for Q2/2010 despite some slowing from the preceding quarter. The more modest showing in exports corresponds to the less vigorous growth volume of world trade and movement in international commodity prices. Developments in World Trade Volume, the Baltic Dry Index and commodity prices confirm the more moderate growth in exports during Q2/2010 (Graph 2.7). The slowing exports in Q2/2010 are thought to be related to the diminishing capacity of China, India and Europe to absorb exports. Despite losing some steam, exports have maintained high levels of growth in estimated figures, consistent with the upbeat trend in global business sentiment and consumer confidence.
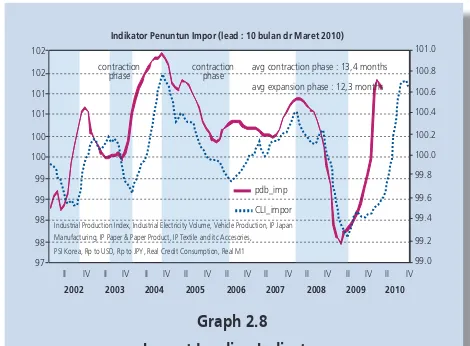
Import growth maintained a brisk pace during Q2/2010, although less rapid than before. Estimates of vigorous import growth are supported by the high rate of export activities, non-construction investment and rising private consumption. These signs are supported by movement in leading import indicators showing that import growth remains in an expansionary phase (Graph 2.8). The most important indication of slowing exports is visible in raw material imports and diminishing imports from Europe and China. Alongside this, import VAT revenues continue to expand at a brisk pace although at a slightly reduced pace (as of April 2010).
Government Financial Operations
In the outcome for Q2/2010, the state budget reported a high surplus. This condition represents an outworking of more rapidly ascending performance in state revenues compared to state expenditures. During the second quarter (data for April and May 2010), budget operations posted a Rp 43 trillion surplus, well ahead of the surplus for the same period in 2009 at only Rp 5.8 trillion. With the addition of the Rp 18.2 trillion surplus in Q1/2010, the budget surplus in the January-May outcome reached Rp 61.1 trillion or 1.0% of GDP. In May 2010, state revenues reached 35.9% of the revised budget target, ahead of the equivalent 2009 performance of 33.9%. On the other hand, absorption of state expenditures came to 26.2% of the revised budget target, down from the previous year’s absorption at 28.7% of the revised budget target.
State revenue performance has improved with an added boost from non-tax revenues. Nominal natural resource revenues received for oil and natural gas mounted significantly from Rp 8.7 trillion in the first quarter to Rp 34.9 trillion in the second quarter. Accordingly, total natural resources revenues from oil and natural gas reached Rp
����� ����� ����� ��� ���� ���� ���� ���� ���� ���� � ��� ��� ��� ��� ��� ���������������� ��������� ������������ ����� ������������ ��������������������������������������������������������������������������������������������� ��������� ���� ���� ���� ���� ���� ���� ���� ���� ���� ���� ����� Graph 2.7
WTV, Baltic Dry Index and Export Graph 2.5
Building and Non-Building Investment
�� ��� ��� ��� � �� �� �� �� � �� ��� �� � �� ��� �� � �� ��� �� � �� ��� �� � �� ��� �� � ���� ���� ���� ���� ���� ���� � � � � � �� �� �� �� �� ���������������� ����������������������������� ������������ ������� ��������������������������������������������������������������������������� Graph 2.6
Growth Investment Credit and Leasing
43.6 trillion in January-May 2010, up from the same period last year recorded at Rp 27.9 trillion. The buoyant natural resources revenues from oil and gas are explained largely by higher crude oil prices on the international market. Besides the boost provided by natural resources revenues from oil and natural gas production, non-tax revenues have also benefited from performance in other non-tax revenues. The policy for service improvements and fee adjustments in some line ministries and statutory agencies has had a beneficial effect on other non-tax receipts. In response to these conditions, actual non-tax revenues reached 32.5% of the revised budget target in Q2/2010. Regarding taxation, incoming tax revenues as of Q2/2010 came to 37.1% of the revised budget target, similar to the 36.8% outcome in 2009.
In regard to government expenditures, in May 2010 realised central government expenditures were recorded at 22.4% of the revised budget target. Furthermore, during the first five months of 2010, realised transfers to regions came to 34.7% of the revised budget target. On the financing side, issuances of Indonesian government securities have progressed well. No difficulties are expected in funding the budget deficit from issuances of Indonesian government securities in view of the keen market interest in these instruments. In June 2010, net issuance of Indonesian government securities reached 66.9% of the revised budget target.
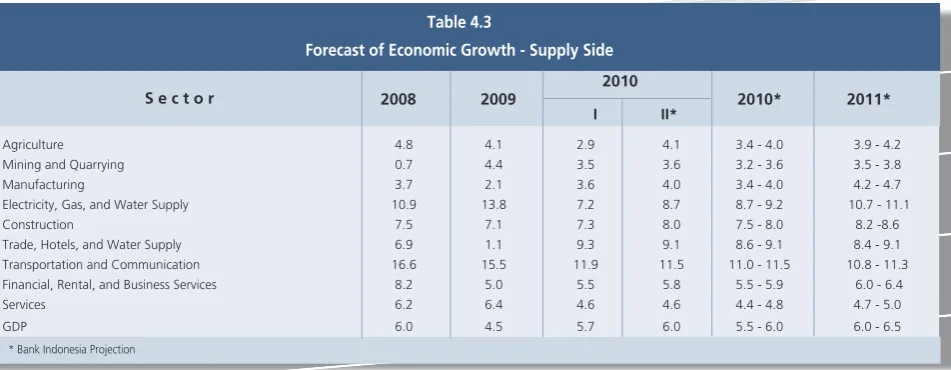
Aggregate Supply
Rising domestic demand and buoyant growth in exports and imports has bolstered estimates of production side performance. Sectors closely related to consumption and export/import activities, such as manufacturing and the transport and communications sector, registered higher growth in estimates for Q2/2010. In response, the trade, hotels and restaurants sector and the financial services, leading and general services sector maintained vigorous growth
I II III IV I II III IV I II*
I t e m
Table 2.2
Economic Growth – Supply Side
Agriculture 3.4 6.4 4.8 3.2 5.1 4.8 5.9 2.9 3.3 4.6 4.1 2.9 4.1
Mining and Quarrying 2.0 -1.6 -0.4 2.3 2.4 0.7 2.6 3.4 6.2 5.2 4.4 3.5 3.6
Manufacturing 4.7 4.3 4.2 4.3 1.8 3.7 1.5 1.5 1.3 4.2 2.1 3.6 4.0
Electricity, Gas and Water Supply 10.3 12.3 11.8 10.4 9.3 10.9 11.2 15.3 14.5 14.0 13.8 7.2 8.7
Construction 8.6 8.2 8.3 7.8 5.9 7.5 6.2 6.1 7.7 8.0 7.1 7.3 8.0
Trade, Hotels and Restaurant 8.4 6.7 7.7 7.6 5.5 6.9 0.6 0.0 -0.2 4.2 1.1 9.3 9.1
Transportation and Communication 14.0 18.1 16.6 15.6 16.1 16.6 16.8 17.0 16.4 12.2 15.5 11.9 11.5
Financial, Rental and Business Service 8.0 8.3 8.7 8.6 7.4 8.2 6.3 5.3 4.9 3.8 5.0 5.5 5.8
Services 6.6 5.5 6.5 7.0 5.9 6.2 6.7 7.2 6.0 5.7 6.4 4.6 4.6
GDP 6.3 6.2 6.3 6.2 5.3 6.0 4.5 4.1 4.2 5.4 4.5 5.7 6.0
2007 2008 2008 2009 2009 2010
* Bank Indonesia Projection
% Y-o-Y, Base Year 2000
Graph 2.8 Import Leading Indicator
���� ���� ���� ���� ���� ����� ����� ����� ����� ����� �����
�� �� �� �� �� ��� ��� ��� ��� ��� ���
�� �� �� �� �� �� �� �� �� �� �� �� �� �� �� �� �� ��
���� ���� ���� ���� ���� ���� ���� ���� ���� ��������������������������������������������������������
�����������
����� ���������������� ����������������������������������� ���������������������������������
as for Q1/2010. Estimates indicate that manufacturing, transport and trade were again the engines of growth during Q2/2010 (Table 2.2).
Manufacturing recorded increased growth in estimated figures for Q2/2010. The more upbeat performance in manufacturing is consistent with indications provided by movement in the leading indicators for the manufacturing sector. Similarly, the composite prompt indicator for manufacturing in early Q2/2010 indicates that manufacturing sector performance is moving in a sound direction. The latest developments in manufacturing indicators (May 2010) also confirm the improving growth trend in manufacturing industry. Manufactured exports maintained high levels of growth in April 2010. Similarly, indicators of domestic demand in the manufacturing sector, such as sales of cars and motorcycles, also point to sustained high growth. Cement production also demonstrated vigorous expansion. Production indicators for the manufacturing sector, such as the production index, capacity utilisation and use of production inputs maintained an upward trend. High growth is also evident production indices, capacity utilisation and imported raw material for manufacturing. On a note similar to that struck by manufacturing performance, banks embarked on more vigorous expansion of lending to the manufacturing sector (position in April 2010).
In Q2/2010, the trade sector is estimated to have carried forward the vibrant growth of Q1/2010. Indications of persistently high trade growth are also evident from movement in leading indicators, currently in an expansionary phase, and the present high growth in the composite prompt indicator for the trade sector. High imports and improving performance in tradable sectors have both fuelled vibrant performance in the trade sector. Total imports and import VAT payments both recorded high growth in May 2010. Increased growth in tradable sectors, namely agriculture, manufacturing and mining, also resulted in a positive contribution to growth in total stock of traded goods. The hotels and restaurants subsector also showed healthy results with sustained vigorous growth in hotel occupancy rates and foreign tourist arrivals. Growth in the trade sector was also bolstered by developments in bank financing, which has maintained a comparatively steady growth track (April 2010).
Agricultural sector growth is estimated to have improved over one quarter before. The shift in the rice planting season at the end of 2009 has resulted in a shift in the period of concentrated rice harvesting into April 2010. This contributed towards the more upbeat agriculture sector growth in Q2/2010. Based on the Initial Forecast Figures (ARAM I) for 2010, published by the Central Statistics Agency (BPS), the expected increase in rice production is only 0.88% over the previous year to 64.9 million tons. The predicted rice crop is estimated to be sufficient to cope with domestic needs. At the same time, strong performance in the estates subsector will help boost the performance of the agriculture sector. The performance in the estates subsector is reflected in growing demand for exported estate commodities as conditions improve in the world economy. Agricultural and estate commodity exports again recorded buoyant growth in April 2010. As regards financing, agriculture sector performance is also supported by the more rapid growth in bank lending to agriculture in April 2010.
slowed further in May 2010. This slowdown was also confirmed by more modest growth in exports of key non-oil exports, led by non-oil and gas commodities such as coal, aluminium and nickel. Despite this, oil and natural gas subsector performance may be able to compensate in overall terms for slowed growth in non-oil and gas subsectors. This is because of the substantial share of the oil and natural gas subsector to total mining GDP formation at 55%. Mining sector performance was consistent with the growing support from lending to the mining sector during April 2010.
In Q2/2010, the transport and communications sector maintained an improving trend. Recent developments in transportation indicators reinforce the present indications of continued robust growth in this sector. In the communications subsector, numbers of cellular subscribers are expected to climb further as in Q1/2010. Among the factors driving this growth is the nascent boom in data communications as telecommunications operators launch aggressive promotions of internet data traffic. The vibrant growth in data traffic is reflected in rising growth of data sales. In similar developments, indicators for the transportation subsector are also upbeat. Improved growth is also evident in air passenger traffic. In a similar vein, rail freight in May 2010 and cargo traffic at the five major ports (Belawan, Tanjung Priok, Balikpapan and Makassar) is also predicted to rise in response to the brisk pace of export and import activities. In regard to financing, bank lending to the transport and communications sector recorded slightly faster expansion as of early Q2/2010.
Construction sector estimates point to improved performance during Q2/2010. Improved construction sector performance is visible from the continued high growth in cement production and rising growth in cement imports. In the Bank Indonesia Commercial Property survey, supply of property on the market continued to mount, particularly in leased retail space, apartments for sale and industrial land. Furthermore, some retail shopping centre projects were slated for completion during Q2/2010. In regard to financing, more vigorous expansion was recorded for bank lending to the construction sector in April 2010.
Regional Economies
At the sectoral level, economic growth in some regions is driven by more vigorous performance in the agriculture sector due to a shift in harvest concentration and onset of the oil palm harvest in Sumatra. The manufacturing sector in Java has been bolstered by strong domestic and international demand. Performance in the trade sector is commensurate to the strengthening of domestic demand and brisk pace of export/import activity.
In regard to prices, inflationary surges in the regions have come mainly from volatile foods due to crop failures caused by heavy rains and flooding in some agricultural centres and diminished supply from imports. Garlic underwent significant increases in prices brought on mainly by tight supply from China, the most important supplier of garlic to Indonesia (90%).
BALANCE OF PAYMENTS
Indonesia’s balance of payments maintained solid performance in estimates for Q2/2010. The current account and the capital and financial account are both expected to post robust surpluses. The solid performance of Indonesia’s balance of payments in Q2/2010 is bolstered by the ongoing recovery in the global economy, persistently high commodity prices, improvement in domestic economic fundamentals and continued positive international perceptions of the Indonesian economy. Under the conditions described above, international reserves at end-Q2/2010 mounted to USD76.3 billion, equivalent to 5.9 months of imports and servicing of official external debt.
The Current Account
In estimates for Q2/2010, the current account posted a considerable surplus. The sustained global economic recovery has brought improvement to exports, which in turn has bolstered performance in the current account. Data for January-May 2010 shows that non-oil and gas exports are on an upward trend. Exports to advanced nations such as the US and Japan continue to rise, buoyed by the increasingly solid recovery of the economies of the US and Japan. Alongside this, estimates also indicate that Indonesia’s exports to key trade destinations such as China and Indonesia continue to climb. Analysed by volume, almost all commodities saw positive growth.
The Capital and Financial Account
The capital and financial account again recorded a high estimated surplus in Q2/2010, bolstered by positive international perceptions of the domestic economy. Given the improving outlook for the economy, FDI inflows into Indonesia are again estimated high for Q2/2010. The remarkably strong increase in capital inflows is also reflected in the issuance of private foreign currency bonds. Concerning portfolio investments, the Greek crisis triggered a round of turmoil on global financial markets that ended with the capital reversals at end-of-May 2010. Nevertheless, positive perceptions of improvement in the Indonesian economy (the positive rating outlook) triggered renewed inflows of foreign funds into Indonesia at the end of quarter, targeting mainly Indonesian government securities.
International Reserves
3. Monetary Indicators and Policy
Q2-2010
The rupiah appreciated in value during Q2/2010 on the solid performance of
Indonesia’s balance of payments alongside subdued risks. External side improvements
matched by high returns on rupiah placements and improvement in perceptions of domestic risk all influenced movement in the rupiah exchange rate, which appreciated by an average 1.6% to Rp 9,110 the US dollar. The gains in the rupiah were also matched by reduced volatility compared to one quarter earlier. The policy package launched by Bank Indonesia in mid-June 2010 is expected to meet with positive market response and reinforce the effectiveness of monetary management. Concerning prices, inflationary pressure began
mounting slightly during Q2/2010 in response to non-fundamental factors. Measured
annually, CPI inflation in Q2/2010 reached 5.05% (yoy), up from the Q1/2010 level of 3.43% (yoy). This rise is explained primarily by strengthening inflationary pressure from non-fundamentals, led by volatile foods inflation, while inflationary pressure from fundamentals reflected in core inflation remained minimal.
In other developments, monetary policy transmission continued through various
channels. Monetary policy transmission was maintained in the deposit rate channel, albeit
with more limited magnitude. Loan interest rates charted more aggressive downward movement in comparison to deposit rates. In the credit channel, monetary policy transmission saw improvement during Q2/2010. Credit expansion mounted to an indicated level of 18.6% (yoy) in June 2010, up from 10.7% (yoy) one quarter earlier. In other developments, monetary policy transmission on the capital market, government securities market and mutual funds market was also positive. On the stock market, the JSX Composite climbed further with gains outperforming other markets in the region. On the government securities market, yield eased in almost all tenors. In other developments, the mutual funds market also showed positive movement in line with performance of underlying assets in their individual markets.
RUPIAH EXCHANGE RATE
During Q2/2010, the rupiah exchange rate gained value. Over the quarter, the average rate for the rupiah appreciated 1.6% to reach Rp 9110 to the US dollar (Graph 3.1). Halfway through Q2/2010, the rupiah dipped from negative sentiment on global financial markets triggered by the fiscal crisis in a number of European countries. Nevertheless, the sustained solid performance of the domestic economy providing positive support for the rupiah in June, which kept the rupiah value on a stable track. At end-Q2/2010, the rupiah closed at Rp 9,060 to the US dollar, up 0.3% over the close of the preceding quarter. Rupiah appreciation in Q2/2010 was accompanied by a fall in rupiah volatility to 0.47% from the equivalent 0.57% one quarter before (Graph 3.2).
Graph 3.1
Average Rupiah Exchange Rate �����
���� ���� ���� ����� ����� ����� ����� ����� �����
�������������������
��������������� �����������������
������
��� �
��� � �����
�����
�����
����
���� ����
��� ��� ��� ��� ��� ��� ��� ��� ��� ���
Turmoil on global financial markets during Q2/2010 came in consequence to the worsening of the fiscal crisis in Greece. Downgraded ratings for PIIGS nations and weakening indicators for Europe’s economic fundamentals set off a round of panic on global financial markets. To calm the turmoil, European governments and the IMF announced an aid package for Greece. The combination of positive sentiment over economic recovery and fears over the crisis in Europe set off a round of exchange rate turmoil in Asia that lasted throughout Q2/2010. To resolve this, some central banks launched intervention actions that calmed the volatility in exchange rates.
At home, a key factor in the appreciation of the rupiah is the positive showing of the domestic economy. Subdued inflation, quarterly GDP growth in Q1/2010 at 5.7% (yoy) and the positive outcomes in Indonesia’s balance of payments have helped rein in the effects of negative sentiments driven by external conditions. This positive performance is also reflected in rising foreign confidence, demonstrated in Moody’s decision to upgrade the rating outlook for Indonesia.
Foreign investor confidence improved, as reflected in more positive perceptions of domestic risks. The Credit Default Swap (CDS) indicator for Indonesia remained low in line with the declining levels recorded in other risk indicators, namely yield spread between Indonesian government bonds and US T-Notes (Graph 3.3). At the same time, the swap premium (an indicator of expected direction of movement in the rupiah) maintained stable movement in all tenors (Graph 3.4).
The improvement in domestic risks has bolstered the attractiveness of rupiah-denominated investments. Rupiah returns, reflected in the level of Uncovered Interest Parity (UIP) at 6.07%, are still the highest compared to other countries in Asia (Graph 3.5). When the improvement in the risk premium is taken into account, investment in the rupiah becomes even more attractive, as reflected in the rising trend in Covered Interest Parity (CIP) indicator so far in 2010. At the end of June 2010, the CIP indicator eased slightly to 3.88%, but continued to outperform similar indicators in Korea, the Philippines and Malaysia (Graph 3.6).
INFLATION
Inflationary pressure mounted during Q2/2010 with non-fundamentals coming into play as a result of supply shocks and problems with distribution of volatile food commodities.
Graph 3.2
Rupiah Exchange Rate Volatility
������ ����� ����� ����� ����� ����� ����� ���� ���� ���� ���� ��� ��� ��� ��� ��� ���� ���� ���� ���� ���� � �� � � � � � � � � � ����� ���� ������������������ ���������������������� ������������� ���� ��� ������ ��� ��� ��� ��� ������ ��� ��� ���� ��� Graph 3.4
Swap Premium in Various Tenors
���������� ���������� ���������� ����������� � �� �� �� � � ��� ��� ��� ��� ��� ��� ��� ��� ��� ���� ���� ��������������������������� ��� ��� ��� ��� ��� ��� ��� ��� ��� ���� ��������� Graph 3.3 Risk Perception Indicators
Measured annually, CPI inflation in Q2/2010 came to 5.05% (yoy), up from the preceding quarter’s level of 3.43% (yoy) (Graph 3.7). In June 2010, CPI inflation was recorded at 0.97% (mtm), up in comparison to preceding months with 0.15% recorded for May and -0.14% for April 2010.
The higher CPI inflation in Q2/2010 compared to one quarter earlier was fuelled mainly from pressure in the volatile foods category. Declining production of major food stuff commodities, such as seasonings and rice, compounded by disruptions in some distribution channels caused by adverse weather conditions, has spurred increases in volatile foods inflation compared to earlier periods. During the quarter under review, volatile foods inflation reached 4.61% (qtq) or 11.51% (yoy), up significantly from 1.83% (qtq) or 4.41% (yoy) one quarter earlier.
Disaggregated by category of expenditure, inflationary pressure during Q1/2010 came mainly from the foodstuffs category (Graph 3.8). Rising inflation in this category was spurred by supply shocks for some food items, most importantly miscellaneous seasonings. Falling production for red chilli peppers and shallots prompted high levels of inflation for the two commodities. Supply shocks were also exacerbated by disruptions to supplies in some regions caused by heavy rains. These two commodities accounted for an 0.35% (qtq) and 0.07% (qtq) contribution to inflation. In the case of garlic, steep price increases during the period under review were driven by reduced imports from China. Most of Indonesia’s garlic (90%) is imported, and this in the absence of a policy to improve the supply of garlic, upward pressure on garlic prices could potentially last a considerable time.
Disaggregation of Inflation
Core inflation was kept at subdued levels during Q2/2010. The supporting factors of subdued inflation expectations, the appreciating exchange rate and adequate supply-side response kept core inflation subdued at a modest level. In response to these developments, core inflation was recorded at 0.68% (qtq) in Q2/2010, down from the previous quarter’s level of 0.89% (qtq). Measured annually, core inflation came to 3.97% (yoy), having climbed from 3.56% (yoy) one quarter earlier. This rise is explained by a surge in core inflation near the end of Q2/2010, namely in June. This development resulted from mounting international
Graph 3.6
CIP for Countries in the Region
��������� ����������� �������� ����� ���� ���� ���� ���� � ��� ��� ��� ��� ��� ��� ��� ���� ���� ���� ���� ��� ��� ��� ��� ������ ������ ��� ��� ������ ���� ���� ��� ��� ��� ��� ��� ��� ������ ��� ���� ������ ��� Graph 3.7 Inflation �� �� �� � �� �� ������ ��� ���������������� ������������� ������������������ � � � � � � � � � ������ � � � � � � � � � ������ � � � � � � � � � ���� ���� ���� �� � � � ���� ���� � � � Graph 3.5
UIP for Countries in the Region
gold prices followed by increased supply of the commodity on the domestic market and a temporary weakening in the rupiah exchange rate (Graph 3.9). This was also reflected in inflation indicators, including the mounting inflation in imported commodities and the import wholesale price index (Graph 3.10).
More buoyant economic growth and appreciation in the exchange rate have had a positive effect on inflation expectations. This is borne out in the results of the Consensus Forecast (CF) survey in June 2010, which point to a downward trend in inflation expectations for 2010. In 2011, expectations of inflation are set to edge upwards (Graph 3.11). The Consumer Survey also points to subdued consumer expectations of inflation (Chart 3.12).
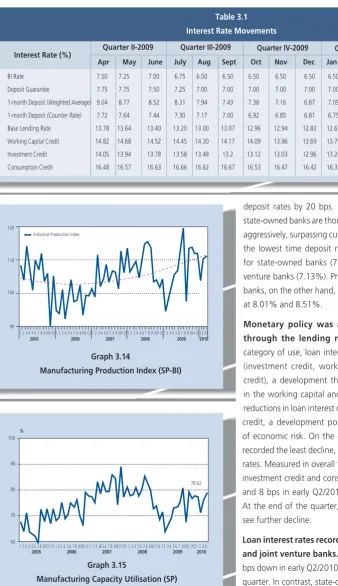
Concerning the output gap, more vigorous demand was still met by adequate supply-side response. Pressure from the output gap on inflation has thus been kept at a minimal level. Demand is still forecasted to rise in keeping with the strengthening performance of the domestic economy. This is borne out in the findings of the Retail Sales Survey, which report steady positive growth from Q3/2009 to the period under review (Graph 3.13). In other developments, supply-side indicators reflected in the manufacturing production index showed a rising trend (Graph 3.14). This is consistent with capacity utilisation in manufacturing, which is also on an upward trend (Graph 3.15).
Volatile foods inflation became a dominant factor driving up CPI inflation during Q2/2010. Falling production of red chilli peppers and shallots and reduced imports of garlic from China contributed to the inflationary spike in volatile foods. In addition to the effect of miscellaneous seasonings, higher rice prices during Q2/2010 resulted in an 0.06% contribution to inflation. Rice prices were up due to falling production caused by harvest and distribution bottlenecks. Nevertheless, the smooth distribution of subsidised rice for the poor (Raskin) helped prevent further increases in prices for rice.
In the administered prices category, inflationary pressure during Q2/2010 was minimal due to the absence of strategic policy decisions. The inflation contribution from this category is explained mainly by higher cigarette prices with clove cigarettes up 0.06%. The comparatively smooth operation of the household fuel conversion programme also helped to curb inflation in this category. According to data from Pertamina, the conversion programme
Graph 3.9
Inflation of Trading Partner Countries and Exchange Rate
����������������������������� ��������������������������������������� ������������������������������� ��� ������ �� �� �� � � �� ���� ���� ���� ���� ���� ���� ��� ��� ��� ��� ��� ���� ���� � � � � � � � � � ������ � � � � � � � � � ������ � � � � � � � � � ������ � � � � � � � � � ������ � � � � � � � � � ������ � � � � � � Graph 3.10
Imported Commodies Inflation, Core Inflation, and WPI Imports
�� ������ �� �� � � �� �������������� ���������������������������� ��������������������������� �� �� �� � ��� �� � � � � � � � � � ������ � � � � � � � � � ������ � � � � � � � � � ������ � � � � � � � � � ������ � � � � � � � � � ������ � � ���� ���� ���� ���� ���� ���� ������ � � � � Graph 3.8 Inflation by Category
forged greater progress compared to earlier months without encountering major obstacles. During the period under review, inflation in administered prices reached 0.57% (q-t-q), having eased from the previous quarter’s inflation recorded at 0.71% (qtq).
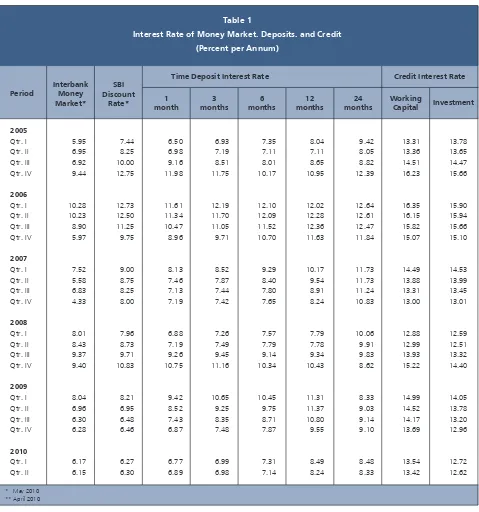
MONETARY POLICY Interest rates
The monetary policy stance transmitted smoothly through the interbank rate channel in various tenors. During Q2/2010, the overnight interbank rate maintained stable movement at round the BI Rate with a daily average at 6.14%, down 4 bps from the preceding quarter (6.18%). As a result, the average relative spread between the overnight interbank rate and the BI Rate during Q2/2010 moved upwards to 66.5% compared to 63.6% one quarter earlier. With the introduction of the 17 June 2010 regulation on widening the interbank overnight rate corridor from +/- 50 bps to +/-100 bps, the weighted average overnight interbank rate dipped to 5.98% in response to a reduction in the FASBI discount to 5.5%, but subsequently recovered. At the end of Q2/2010 the overnight interbank rate closed at 6.25% (Graph 3.16). Like the movement in the overnight interbank rate, average rates in longer interbank tenors edged upwards at end Q2/2010 compared to the preceding quarter. This rise in interbank rates is consistent with the current level of the BI Rate and is more the result of BI efforts to bring movement in the interbank overnight rate to around the BI Rate level near the end of the period. In early Q2/2010, average interbank rates in above 30 day tenors came down significantly due to high levels of excess short-term banking liquidity (Graph 3.17).
Monetary policy transmission continued to operate through the deposit channel, despite slowing in Q2/2010. Deposit rates in various tenors came down 12 bps during Q2/2010, a more modest rate of decline compared to the 57 bps drop in the preceding quarter. The deposit rate structure improved further in early Q2/2010 compared to the end of the preceding quarter in keeping with the more modest decline in longer tenor deposit rates. In response, the 1, 3, 6, 12 and 24-month time deposit rates fell in early Q2/2010 to 6.89%, 6.98%, 7.14%, 8.24% and 8.33% (average 7.52%).
In analysis by category of bank, the steepest decline in time deposit rates took place at foreign and joint venture banks. During Q2/2010, foreign and joint venture banks lowered
Graph 3.12.
Consumers’ Inflation Expectation (Bank Indonesia Consumers Survey)
����� ��� ��� ��� ��� ��� ��� ��� ��� ��� ���� ���� ���� ���� ���� ���� � � � � � � � � � ������� � � � � � � � � ������� � � � � � � � � ������� � � � � � � � � ������� � � � � � � � � ������� � � �� �� �� � � ����������������������������������������� ����������������������������������������� �������������������������� � � � � Graph 3.13. Real Sales Growth
�� �� �� �� � �� ��� ��� � � � � � � � � ������� � � � � � � � � �������� � � � � � � � ������� � � � � � � � � ������� � � � � � � � � � ������� ��������������������������������� ��������������������������������� ���� ���� ���� ���� ���� ����� � � � � Graph 3.11
Inflation Expectations – Consensus Forecast
deposit rates by 20 bps. Despite this, at the end of Q2/2010, state-owned banks are thought to have slashed interest rates more aggressively, surpassing cuts by other bank categories. As a result, the lowest time deposit rates in early Q2/2010 were recorded for state-owned banks (7.09%), followed by foreign and joint venture banks (7.13%). Private banks and regional development banks, on the other hand, continued to offer higher deposit rates at 8.01% and 8.51%.
Monetary policy was also transmitted more smoothly through the lending rate channel. In disaggregation by category of use, loan interest rates were down in all categories (investment credit, working capital credit and consumption credit), a development that prompted more generous lending in the working capital and investment categories. The steepest reductions in loan interest rates were recorded for working capital credit, a development pointing to improved bank perceptions of economic risk. On the other hand, consumption credit rates recorded the least decline, being less elastic to changes in interest rates. Measured in overall terms, rates for working capital credit, investment credit and consumption credit came down by 12, 10 and 8 bps in early Q2/2010 to 13.42%, 12.62% and 15.34%. At the end of the quarter, loan interest rates were expected to see further decline.
Loan interest rates recorded their steepest decline at foreign and joint venture banks. Rates offered by these banks were 25 bps down in early Q2/2010 compared to the end of the preceding quarter. In contrast, state-owned and private banks lowered their rates by only 10 bps and 6 bps over the same period.
Interest Rate (%)
Apr May June July Aug Sept Oct Nov Dec Jan Feb Mar Apr May June Quarter II-2009 Quarter III-2009
Table 3.1 Interest Rate Movements
BI Rate 7.50 7.25 7.00 6.75 6.50 6.50 6.50 6.50 6.50 6.50 6.50 6.50 6.50 6.50 6.50
Deposit Guarantee 7.75 7.75 7.50 7.25 7.00 7.00 7.00 7.00 7.00 7.00 7.00 7.00 7.00 7.00 7.00
1-month Deposit (Weighted Average) 9.04 8.77 8.52 8.31 7.94 7.43 7.38 7.16 6.87 7.09 6.93 6.77 6.89 n.a n.a
1-month Deposit (Counter Rate) 7.72 7.64 7.44 7.30 7.17 7.