he Millennium Development Goals (MDGs) raised the prospect of significantly improving the life and welfare of women and children notably by augmenting chances of survival, reducing poverty, improving health, nutrition and access to education. For children, the MDGs provide a framework for policymakers to ensure that the basic rights of children are met. However, in order to produce this desired effect, equitable outcomes must be realized across the population. Global data trends reveal that while there has been general progress, large portions of population have been left behind, resulting in the widening of socio-economic disparities, and growing numbers of disadvantaged people. If this situation cannot be corrected, the MDG achievements cannot be sustained. The issue of equity is therefore central to the sustainable achievement of the MDGs.
Despite having witnessed multiple crises in the last decades, Indonesia has experienced positive economic growth over the past decade, where poverty reduction has been notable and significant progress towards achieving the MDGs has been realised. According to the latest government report, four of the 35 indicators most directly associated with the welfare of women and children have already been achieved, 20 are on track to be achieved, and 11 require special attention or may not be achieved by 2015.i However, overall progress towards meeting the MDG targets is far from universal. This brief draws attention to the wide disparities that lay underneath the surface of Indonesia’s success, identifying those who are being left behind and key areas of concern.
Issue
Briefs
MDGs, Equity and Children:
The way forward for Indonesia
MDGs and Equity for
MDGs and Equity for Children in Indonesia:
An Overview
I. Inter-province disparities
ndonesia is comprised of 33 provinces and 497 districts. The 2010 Situation Analysis of Children in Indonesia (SITAN) reveals a
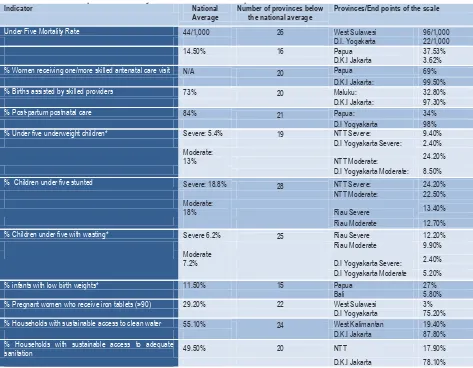
consistent pattern of inter-provincial disparities, whereby a majority of provinces are lagging behind the national average and a small number of provinces have surpassed it (see Table 2).
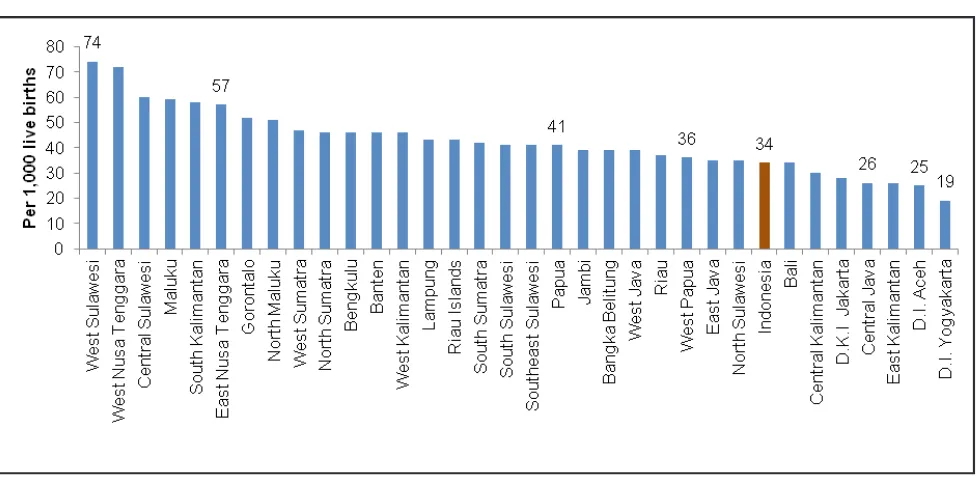
For example, Indonesia is on track to achieve MDG 4.1 on Infant
Mortality Rate at 34 per 1,000 live births, but 27 our 33 provinces have higher mortality rates than the national average.ii
The gap between provinces is also vast: West Sulawesi, the worst off province has an IMR of 74/1,000 live births compared to 34/1,000 for the national average and 19/1,000 in D.I. Yogyakarta.
With the exception of education (see above), there is evidence of provincial disparities in most of the MDG indicators that are directly related to child rights (MDG 1 to 4), and the same can be seen on the service coverage indicators. Provinces located in Eastern Indonesia (in particular Papua, NTT and NTB), newly formed provinces such as West Sulawesi, Gorontalo and Jambi, as well as the conflict-affected provinces Figure 1: Infant Mortality Rate (IMR) by province, Indonesia 2007
I
II. Rural urban disparities
ndonesia is undergoing rapid urbanization with a record high of as much as 48% of the population and 54% of all children living in urban areas. Poverty remains concentrated in rural areas and is one of influencing factors contributing to rural-urban disparities in Indonesia. Other factors include geographic isolation, poor infrastructure, high transport costs, poor quality of services and lower human resource capacity found in the rural areas.
Table 1. Provincial disparities with key MDG and human development indicators
Indicator National
% Pregnant women who receive iron tablets (>90) 29.20% 22 West Sulawesi 3% D.I Yogyakarta 75.20%
% Households with sustainable access to clean water 55.10% 24 West Kalimantan 19.40% D.K.I Jakarta 87.80%
% Households with sustainable access to adequate
sanitation 49.50% 20 NTT 17.90%
D.K.I Jakarta 78.10%
Table 1. Provincial disparities with key MDG and human development indicators
I
1999-2008
Figure 2: Percentage of poor population (based on head-count Index) by area,
At the national level, there has been some closing of the gap between urban and rural populations, as evidenced by the reduction in infant mortality (Figure 3). At the same time, it should be noted that this trend has been mainly due to improvements in rural development, whereas the rate of progress in urban areas have been much slower. A similar trend is also found for neonatal mortality and deaths of children under five years of age, with a greater rate of reduction in rural areas than in urban areas. It is noted that population growth, rapid urbanization and the growth of slum areas are putting significant pressures on the health and other social sector services and infrastructure.
III. Wealth disparities
n sharp contrast to other middle income countries in Latin America and Africa, Indonesia is not associated with high levels of wealth and income disparities. This trend however is changing. Indonesia’s Gini Coefficient is still relatively low but has been rising steadily, from 0.334 in 1993 to an all-time high of 0.364 in 2007.v
I
Figure 3: Infant mortality rate (IMR) by area, Indonesia 19
Figure 3: Infant mortality rate (IMR) by area, Indonesia 1997-2007iv
0% 20% 40% 60% 80% 100%
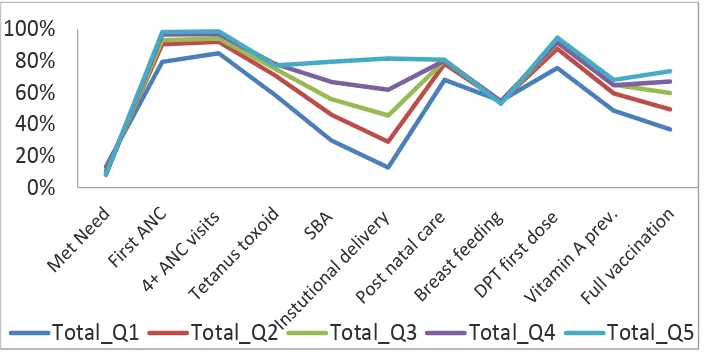
Income disparities are reflected on indicators of child and maternal mortality, which may be explained to a certain extent by the gaps in coverage of health services between the poor and the rich. The Investment Case studyvi found a minimum coverage gap of 20% between the
richest and poorest quintiles across nearly all essential maternal and child health services.
Data from the National Basic Health Research Survey (Riskesdas 2007) shows that traditional birth attendants remain the main source of assistance to pregnant women for the bottom three quintiles. Based on Inter-census survey (SUPAS), Figure 4 above shows that 83 per cent of women in the top quintile give birth at a health facility but only 14 per cent of women in the lowest quintile do so. These findings seem relevant for explaining, at least in part, the only marginal decreases in infant and maternal mortality rates in Indonesia over the past decade.
Figure 5: Percentage of births by place of delivery and by wealth quintile,
Indonesia 2007vii
2009
opor
5
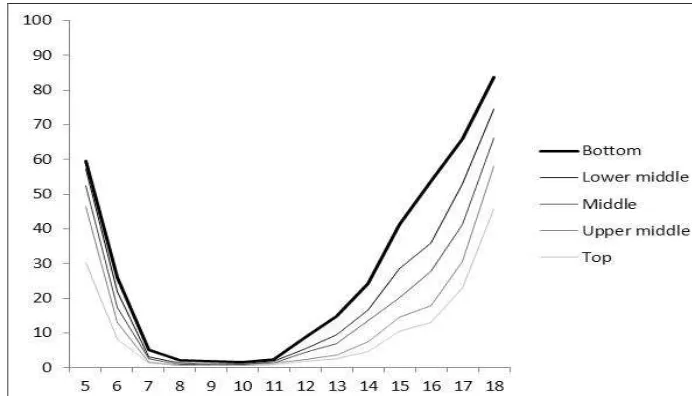
Figure 6. Percentage of out of school children by age and household
Similar trends are also found on indicators related to children’s education. Indonesia has achieved universal primary education (MDG 2) and essentially closed the gap in access to primary education between the poorest and richest population. However, the gap widens as children transition to secondary school. Participation in junior and secondary school is biased toward the wealthier population. Among the 13 to 15 year old age group, children from the poorest households are four times more likely to be out-of-school as compared to children from the richest households. IV. Prevailing poverty among children
ndonesia has achieved the first MDG goal to reduce extreme poverty ahead of 2015. Extreme poverty fell from 20.6% of Indonesians living on less than $1 PPP/day in 1990 to 5.9% in 2008 (BAPPENAS 2010:17)ix and the poverty rate (as per national poverty line equivalent to $1.4 PPP/day) has declined consistently over the years to a historical low of 13.30% in 2010.x (BAPPENAS 2010:17). Indonesia’s success is attributed to a strong economic recovery accompanied by a series of social protection interventions
including health insurance for the poor, social assistance and community-based poverty reduction programmes.
However, the number of children who are still affected by poverty remains worryingly high. Research conducted by the Indonesian research institute SMERU shows that in 2009 around 44.3 million Indonesian children lived on less than $2 PPP per day, of which 13.8 million lived below the national poverty line (approximately $1.4 PPP per day) and 8.4 million children lived in extreme poverty (less than $1 PPP per day). In addition, the rate of reduction in poverty among children lags behind that of the general population.
Poverty alleviation has been at the centre of Indonesian national development planning over the past decade and some measures have been put in place to protect children, particularly in terms of basic education and health, through social safety net programmes, conditional and other cash transfers. However, the emerging evidence on child poverty in Indonesia indicates that children do not receive an equitable share of the benefits of poverty alleviation.
n Indonesia, with the exception of education, inter-provincial
disparities, rural/urban disparities and wealth disparities are prominent against all MDGs. The MDGs in Indonesia have been a key priority and in the latest National Medium-Term Development Plan (RPJMN) 2010-2014 of the Government of Indonesia (GoI) and the corresponding sectoral Strategic Plans (Renstra, Rencana Strategis), equity measures have become more prominent. There are key dilemmas and contradictions attached to tackling disparities in Indonesia. The evidence shows that children in the Eastern region of Indonesia are proportionately at a disadvantage when compared to children from the Western region of Indonesia. However the concentration of population means that highest numbers of poor and vulnerable children are found in Java. Both groups of vulnerable children need to be targeted but through different
approaches and formulas.
Some of the recommendations that can enhance the progress on attaining the MDGs with equity for children in Indonesia are being outlined below.
1. Central government should improve the capacity to monitor child rights and equity dimensions of the MDGs. This requires the systematic disaggregation of key indicators with respective to at least these dimensions: province/district/sub-district/village, rural/urban, household expenditure, household size, level of education, age and gender.
2. In high performing areas, the central and local governments should examine inter-district and group disparities, identify pockets of vulnerable households and children and develop targeted policies, programmes and resources.
3. In poor performing areas, the central and local governments should aim for broader universal programmes in combination with some approaches. The general shape and distribution of disparities indicates that inter-district and inter-group disparities are still likely to be present within disadvantaged provinces.
4. Central government together with local governments should scale up social protection efforts to address the vulnerabilities of the poor,
I
improve access and quality of services for the poor, coupled with community empowerment efforts to increase their demand for services. 5. Central and local governments should set up urgent measures to respond to the rapid urbanization, ensuring adequate infrastructure and services to support social welfare improvement in urban areas. 6. The Government with support of academia and child-focused NGOs should investigate other factors of social exclusion that contribute to vulnerabilities but have not received adequate attention, including:
• Disability
• Living situation (children living in and outside parental care) • Religion and ethnicity
i There are 8 broad categories of MDGs that incorporate over 70 related sub-targets. The SITAN 2010 considered only those MDGs most closely or directly associated with the welfare of women and children such as health, mortality, nutrition, poverty, education and water and sanitation. MDG 8 on building global partnership for instance was not included in the analysis.
ii Source: IDHS 2007. Note: The igures presented here are for the ten-year period preceding the survey
iii Source: Welfare Indicators, processed by BPS - Statistics Indonesia, based on National Socio-Economic Surveys 1999-2008
iv Source: IDHS 1997, 2002-2003 and 2007
v SITAN 2010 based on BPS - Statistics Indonesia, Welfare Indicators; Income and Consumption Indicators, based on National Socio-Economic Surveys 1993, 1996, 1999, 2002, 2005 and 2007
vi UNICEF-MoH ‘Indonesia Investment Case’ study, 2012 vii Source: IDHS 2007
viii Source: Out-of-school children study, Ministry of National Education and Culture, BPS and UNICEF (analysis of Susenas 2009 data)
ix Ministry of National Development Planning/National Development Planning (BAPPENAS) (2010), Report on the Achievement of The Millennium Development Goals, Jakarta, http://www.undp.or.id/pubs/docs/MDG%202010%20Report%20Final%20Full%20LR.pdf, last accessed 15 November 2011.
x The national poverty line is the rupiah value an individual needs to fulill his or her daily minimum requirement for food of 2,100 kilocalories (kcal), plus non-food minimum needs, such as housing, clothing, health, education and transportation. The national poverty line was calculated at 211,726 IRr in 2010 by the national bureau of statistics (BPS),


