Oracle® Fusion Middleware
Performance and Tuning Guide
11
g
Release 1 (11.1.1)
E10108-04
Oracle Fusion Middleware Performance and Tuning Guide 11g Release 1 (11.1.1) E10108-04
Copyright © 2011, Oracle and/or its affiliates. All rights reserved.
Primary Author: Lisa Jamen
This software and related documentation are provided under a license agreement containing restrictions on use and disclosure and are protected by intellectual property laws. Except as expressly permitted in your license agreement or allowed by law, you may not use, copy, reproduce, translate, broadcast, modify, license, transmit, distribute, exhibit, perform, publish, or display any part, in any form, or by any means. Reverse engineering, disassembly, or decompilation of this software, unless required by law for interoperability, is prohibited.
The information contained herein is subject to change without notice and is not warranted to be error-free. If you find any errors, please report them to us in writing.
If this software or related documentation is delivered to the U.S. Government or anyone licensing it on behalf of the U.S. Government, the following notice is applicable:
U.S. GOVERNMENT RIGHTS Programs, software, databases, and related documentation and technical data delivered to U.S. Government customers are "commercial computer software" or "commercial technical data" pursuant to the applicable Federal Acquisition Regulation and agency-specific supplemental regulations. As such, the use, duplication, disclosure, modification, and adaptation shall be subject to the restrictions and license terms set forth in the applicable Government contract, and, to the extent applicable by the terms of the Government contract, the additional rights set forth in FAR 52.227-19, Commercial Computer Software License (December 2007). Oracle USA, Inc., 500 Oracle Parkway, Redwood City, CA 94065.
This software is developed for general use in a variety of information management applications. It is not developed or intended for use in any inherently dangerous applications, including applications which may create a risk of personal injury. If you use this software in dangerous applications, then you shall be responsible to take all appropriate fail-safe, backup, redundancy, and other measures to ensure the safe use of this software. Oracle Corporation and its affiliates disclaim any liability for any damages caused by use of this software in dangerous applications.
Oracle is a registered trademark of Oracle Corporation and/or its affiliates. Other names may be trademarks of their respective owners.
Contents
Preface
... xviiAudience... xvii
Documentation Accessibility ... xvii
Conventions ... xviii
Part I
Introduction
1
Introduction and Roadmap
1.1 Document Scope and Audience... 1-1 1.2 Guide to this Document ... 1-1 1.3 Related Documentation... 1-4
2
Top Performance Areas
3
Performance Planning
3.1 About Oracle Fusion Middleware Performance Planning ... 3-1 3.2 Performance Planning Methodology ... 3-1 3.2.1 Define Your Performance Objectives... 3-2 3.2.2 Design Applications for Performance and Scalability ... 3-4 3.2.3 Monitor and Measure Your Performance Metrics ... 3-4
4
Monitoring Oracle Fusion Middleware
4.1 About Oracle Fusion Middleware Management Tools... 4-1 4.1.1 Measuring Your Performance Metrics... 4-2 4.2 Oracle Enterprise Manager 11g Fusion Middleware Control ... 4-2 4.2.1 Viewing Performance Metrics Using Fusion Middleware Control... 4-3 4.3 Oracle WebLogic Server Administration Console ... 4-4 4.4 WebLogic Diagnostics Framework (WLDF)... 4-5 4.5 WebLogic Scripting Tool (WLST)... 4-6 4.5.1 Using Custom WLST Commands ... 4-7 4.6 DMS Spy Servlet... 4-7 4.6.1 Viewing Performance Metrics Using the Spy Servlet ... 4-7 4.6.2 Using the DMS Spy Servlet ... 4-8 4.7 Oracle Process Manager and Notification Server ... 4-9 4.8 Oracle Enterprise Manager 11g Grid Control... 4-9 4.9 Native Operating System Performance Commands... 4-13 4.10 Network Performance Monitoring Tools ... 4-13
Part II
Core Components
5
Oracle HTTP Server Performance Tuning
5.1 About Oracle HTTP Server... 5-1 5.2 Oracle HTTP Server Directives Tuning Considerations ... 5-1 5.2.1 How Persistent Connections Can Reduce Httpd Process Availability... 5-5 5.3 Oracle HTTP Server Logging Options... 5-7 5.3.1 Access Logging... 5-7 5.3.2 Configuring the HostNameLookups Directive ... 5-7 5.3.3 Error logging ... 5-7 5.4 Oracle HTTP Server Security Performance Considerations ... 5-8 5.4.1 Oracle HTTP Server Secure Sockets Layer (SSL) Performance Issues ... 5-8 5.4.2 Oracle HTTP Server Port Tunneling Performance Issues... 5-10 5.5 Oracle HTTP Server Performance Tips... 5-10 5.5.1 Analyze Static Versus Dynamic Requests... 5-11 5.5.2 Beware of a Single Data Point Yielding Misleading Results ... 5-11 5.5.3 Beware of Having More Modules ... 5-11 5.5.4 Monitoring Oracle HTTP Server ... 5-12
6.2 DMS Availability... 6-6 6.3 DMS Architecture Overview... 6-6 6.4 Viewing DMS Metrics ... 6-7 6.4.1 Viewing Metrics Using the Spy Servlet ... 6-7 6.4.2 Viewing Metrics with WLDF (WebLogic Diagnostic Framework) ... 6-8 6.4.3 Viewing metrics with WLST (Oracle WebLogic Server)... 6-8 6.4.4 Viewing metrics with JConsole... 6-8 6.4.5 Viewing metrics with Oracle Enterprise Manager ... 6-9 6.4.6 Viewing metrics using WSADMIN (IBM WebSphere) ... 6-9 6.5 Accessing DMS Metrics with WLDF... 6-9 6.6 DMS Execution Context ... 6-10 6.6.1 DMS Execution Requests and Sub-Tasks ... 6-10 6.6.2 DMS Execution Context Usage... 6-11 6.6.3 DMS Execution Context Communication ... 6-11 6.7 DMS Tracing and Events ... 6-12 6.7.1 Configuring the DMS Event System ... 6-13 6.7.2 Configuring Destinations ... 6-15 6.7.3 Understanding DMS Event Output ... 6-24 6.7.4 Understanding DMS Event Actions... 6-27 6.8 DMS Best Practices ... 6-28
7
Oracle Metadata Service (MDS) Performance Tuning
7.1 About Oracle Metadata Services (MDS)... 7-1 7.2 Tuning Database Repository ... 7-1 7.2.1 Collect Schema Statistics... 7-2 7.2.2 Increase Redo Log Size ... 7-2 7.2.3 Reclaim Disk Space... 7-2 7.2.4 Monitor the Database Performance ... 7-2 7.3 Purging Document Version History ... 7-3 7.3.1 Auto Purge... 7-3 7.3.2 Manual Purge ... 7-3 7.4 Using Database Polling Interval for Change Detection ... 7-3 7.5 Tuning Cache Configuration... 7-4 7.5.1 Document Cache... 7-5 7.6 Analyzing Performance Impact from Customization ... 7-5 7.7 Understanding DMS metrics and Characteristics... 7-6
Part III
Oracle Fusion Middleware Server Components
8
Oracle Application Development Framework Performance Tuning
8.2.5 Performance Considerations for autoSuggest ... 8-13 8.2.6 Data Delivery - Lazy versus Immediate... 8-13 8.2.7 Performance Considerations for DVT Components... 8-14 8.3 ADF Server Performance ... 8-14 8.3.1 View Objects Tuning ... 8-14 8.3.2 Batch Processing ... 8-17 8.3.3 RangeSize Tuning ... 8-18 8.3.4 Application Module Design Considerations ... 8-18 8.3.5 Application Module Pooling... 8-18 8.3.6 ADFc: Region Usage... 8-23 8.3.7 Reusing Static Data... 8-23 8.3.8 Conditional Validations... 8-23
9
Oracle TopLink (EclipseLink) JPA Performance Tuning
9.1 About Oracle TopLink and EclipseLink ... 9-1 9.2 Efficient SQL Statements and Queries ... 9-2 9.2.1 Entity Relationships Query Parameter Tuning ... 9-5 9.3 Cache Configuration Tuning ... 9-7 9.3.1 Cache Refreshing Scenarios... 9-11 9.3.2 Locking Modes... 9-11 9.4 Coherence Integration ... 9-13 9.5 Mapping and Descriptor Configurations ... 9-13 9.6 Analyzing EclipseLink JPA Entity Performance ... 9-13
10
Oracle Web Cache Performance Tuning
10.1 About Oracle Web Cache... 10-1 10.2 Optimizing Hardware Resources ... 10-1 10.2.1 Hardware Resources ... 10-1 10.2.2 Memory Configuration ... 10-2 10.3 Optimizing Network Connections ... 10-4 10.3.1 Network Bandwidth... 10-4 10.3.2 Network Connections ... 10-4 10.3.3 Network-Related Parameters... 10-5 10.4 Optimizing Platform Connections ... 10-7 10.4.1 UNIX Connections... 10-7 10.4.2 Windows Connections ... 10-7 10.5 Increasing Cache Hit Rates... 10-7 10.6 Optimizing Response Time ... 10-9 10.7 Optimizing Performance with Oracle ADF ... 10-10
Part IV
SOA Suite Components
11
Cross Component Tuning for SOA Suite
11.2.2 Composite Instance State... 11-2 11.2.3 Logging Level... 11-2 11.3 Modifying SOA Configuration Parameters ... 11-2 11.4 JVM Tuning Parameters... 11-3 11.5 Database Settings ... 11-3 11.5.1 Configuring Data Sources for SOA ... 11-3 11.5.2 Weblogic Server Performance Tuning... 11-3
12
Oracle Business Rules Performance Tuning
12.1 About Oracle Business Rules ... 12-1 12.2 Basic Tuning Considerations... 12-1 12.2.1 Use Java Beans... 12-1 12.2.2 Assert Child Facts instead of Multiple Dereferences ... 12-2 12.2.3 Avoid Side Affects in Rule Conditions... 12-2 12.2.4 Avoid Expensive Operations in Rule Conditions ... 12-2 12.2.5 Consider Pattern Ordering... 12-2 12.2.6 Consider the Ordering of Tests in Rule Conditions ... 12-2 12.2.7 Use Functions Instead of AssertXPath and Supports XPath ... 12-3
13
Oracle BPEL Process Manager Performance Tuning
13.1 About BPEL Process Manager ... 13-1 13.2 Basic Tuning Considerations... 13-1 13.2.1 BPEL Threading Model... 13-2 13.2.2 Audit Level ... 13-3 13.2.3 OneWayDeliveryPolicy ... 13-4 13.2.4 StatsLastN ... 13-4 13.2.5 AuditDetailThreshold ... 13-4 13.2.6 LargeDocumentThreshold ... 13-5 13.2.7 Validate XML ... 13-5 13.2.8 SyncMaxWaitTime ... 13-5 13.2.9 InstanceKeyBlockSize... 13-5 13.3 BPEL Properties Set Inside a Composite ... 13-6 13.3.1 Component Properties ... 13-6 13.3.2 Partner Link Property ... 13-6 13.4 Tables Impacted By Instance Data Growth... 13-7
14
Oracle Mediator Performance Tuning
15
Oracle Business Process Management Tuning
15.1 About Oracle Business Process Management... 15-1 15.2 Basic Tuning Considerations... 15-1 15.2.1 Audit Level ... 15-2 15.2.2 LargeDocumentThreshold ... 15-2 15.2.3 Dispatcher System Threads... 15-2 15.2.4 Dispatcher Engine Threads ... 15-3 15.2.5 Dispatcher Invoke Threads ... 15-3 15.3 Tuning Oracle Workspace and Worklist Applications ... 15-3 15.4 Tuning Process Analytics... 15-4 15.4.1 Process Measurement... 15-4 15.4.2 Tuning Process Cubes ... 15-5
16
Oracle Human Workflow Performance Tuning
16.1 About Oracle Human Workflow ... 16-1 16.2 Basic Tuning Considerations... 16-1 16.2.1 Minimize Client Response Time... 16-2 16.2.2 Choose the Right Workflow Service Client ... 16-2 16.2.3 Narrow Qualifying Tasks Using Precise Filters ... 16-2 16.2.4 Retrieve Subset of Qualifying Tasks (Paging) ... 16-3 16.2.5 Fetch Only the Information That Is Needed for a Qualifying Task ... 16-3 16.2.6 Reduce the Number of Return Query Columns ... 16-4 16.2.7 Use the Aggregate API for Charting Task Statistics... 16-4 16.2.8 Use the Count API Methods for Counting the Number of Tasks ... 16-5 16.2.9 Create Indexes On Demand for Flexfields ... 16-5 16.2.10 Use the doesTaskExist Method... 16-5 16.3 Improving Server Performance... 16-5 16.3.1 Archive Completed Instances Periodically... 16-6 16.3.2 Select the Appropriate Workflow Callback Functionality... 16-6 16.3.3 Minimize Performance Impacts from Notification... 16-6 16.3.4 Deploy Clustered Nodes ... 16-6 16.4 Completing Workflows Faster ... 16-7 16.4.1 Use Workflow Reports to Monitor Progress ... 16-7 16.4.2 Specify Escalation Rules ... 16-7 16.4.3 Specify User and Group Rules for Automated Assignment ... 16-7 16.4.4 Use Task Views to Prioritize Work ... 16-8 16.5 Tuning Identity Provider ... 16-8 16.6 Tuning the Database... 16-8
17
Oracle Adapters Performance Tuning
17.3.1 JCA Adapter Basic Tuning Considerations ... 17-4 17.3.2 Existence Checking... 17-6 17.4 Oracle Socket Adapter Tuning... 17-7 17.5 Oracle SOA JMS Adapter Tuning... 17-7 17.5.1 adapter.jms.receive.threads Property ... 17-7 17.6 Oracle AQ Adapter Tuning ... 17-8 17.6.1 adapter.aq.dequeue.threads Property ... 17-8 17.7 Oracle MQ Adapter Tuning ... 17-8
18
Oracle Business Activity Monitoring Performance Tuning
18.1 About Oracle Business Activity Monitoring... 18-1 18.2 Basic Tuning Considerations... 18-1 18.2.1 BAM Server Tuning... 18-1 18.2.2 BAM Dashboard Tuning ... 18-2 18.2.3 BAM Database Tuning... 18-3 18.2.4 Internet Browser Tuning... 18-3 18.2.5 Enterprise Message Source Tuning... 18-3
19
User Messaging Service Performance Tuning
19.1 About Oracle User Messaging Services ... 19-1 19.2 Basic Tuning Considerations... 19-1 19.2.1 SMPP Driver Performance Tuning ... 19-1 19.2.2 Email Driver Polling Frequency ... 19-2 19.3 Database Tuning for Optimal Throughput ... 19-2
20
Oracle B2B Performance Tuning
20.1 About Oracle B2B... 20-1 20.2 MDS Cache Size ... 20-1 20.3 Number of Threads... 20-1 20.4 JMS Multiple Out Queues Setting ... 20-2
21
Oracle Service Bus Performance Tuning
Part V
Identity Management Suite Components
22
Oracle Internet Directory Performance Tuning
22.1 About Oracle Internet Directory... 22-1 22.2 Introduction to Tuning Oracle Internet Directory ... 22-2 22.3 Basic Tuning Considerations... 22-2 22.3.1 Database Parameters ... 22-2 22.3.2 LDAP Server Attributes... 22-3 22.3.3 Database Statistics... 22-4 22.4 Advanced Configurations ... 22-5 22.4.1 Replication or Oracle Directory Integration Platform... 22-5 22.4.2 Replication Server Configuration... 22-5 22.4.3 Garbage Collection Configuration ... 22-6 22.4.4 Oracle Internet Directory with Oracle RAC Database ... 22-7 22.4.5 Password Policies and Verifier Profiles... 22-7 22.4.6 Server Entry Cache ... 22-8 22.4.7 Tuning Security Event Tracking... 22-9 22.5 Low-Priority Tuning Considerations... 22-10 22.5.1 Number of Entries to be Returned by a Search ... 22-10 22.5.2 Enabling the Group Cache ... 22-10 22.5.3 Timeout for Write Operations... 22-10 22.6 Specific Use Cases ... 22-11 22.6.1 Bulk Load Operation ... 22-11 22.6.2 Bulk Delete Operation ... 22-11 22.6.3 High LDAP Write Operations Load ... 22-11 22.7 Optimizing Searches... 22-12 22.7.1 Optimizing Searches for Large Group Entries ... 22-12 22.7.2 Optimizing Searches for Skewed Attributes ... 22-12 22.7.3 Optimizing Performance of Complex Search Filters ... 22-13 22.8 Evaluating Performance on UNIX and Windows Systems ... 22-16 22.9 Obtaining Recommendations by Using the Tuning and Sizing Wizard ... 22-16 22.10 Updating Database Statistics by Using oidstats.sql... 22-18 22.11 Setting Performance-Related Replication Configuration Attributes... 22-18 22.12 Modifying Performance-Related System Configuration Attributes... 22-19 22.12.1 Modifying Instance-Specific Attributes by Using Fusion Middleware Control ... 22-19 22.12.2 Modifying Shared Attributes by Using Fusion Middleware Control... 22-20 22.12.3 Modifying Attributes by Using ldapmodify... 22-21 22.13 Setting Garbage Collection Configuration Attributes ... 22-22 22.13.1 Modifying Changelog Purging Attributes by Using ldapmodify ... 22-22 22.13.2 Modifying Changelog Purging in Oracle Directory Services Manager... 22-22
23
Oracle Virtual Directory Performance Tuning
23.3.2 Join Adapters... 23-5 23.3.3 General Filter Tuning ... 23-5 23.3.4 Load Balancer Local Store Adapter Tuning... 23-5 23.3.5 Cache Plug-In Tuning ... 23-5 23.3.6 LDAP Listener Tuning ... 23-6 23.3.7 Server Tuning ... 23-7
24
Oracle Identity Federation Performance Tuning
24.1 About Oracle Identity Federation... 24-1 24.2 LDAP Tuning ... 24-1 24.2.1 Connection Pool Settings ... 24-2 24.2.2 Connection Settings... 24-2 24.2.3 Federation Data Store Settings... 24-3 24.3 Database Tuning ... 24-4 24.3.1 Data Sources ... 24-4 24.3.2 RDBMS Session Cache ... 24-4 24.3.3 RDBMS Compression... 24-4 24.4 Oracle HTTP Server Tuning ... 24-5 24.5 SAML Protocol Tuning ... 24-5 24.5.1 SOAP Connections ... 24-5 24.5.2 XML Digital Signatures... 24-6 24.5.3 POST and Artifact Single Sign-On Profiles... 24-6
25
Oracle Fusion Middleware Security Performance Tuning
25.1 About Security Services ... 25-1 25.2 Detecting General Performance Issues ... 25-2 25.3 Oracle Platform Security Services Tuning... 25-2 25.3.1 JVM Tuning Parameters ... 25-3 25.3.2 LDAP Tuning Parameters ... 25-3 25.3.3 Authentication Tuning Parameters... 25-3 25.3.4 Authorization Tuning Properties ... 25-3 25.3.5 OPSS PDP Service Tuning Parameters ... 25-4 25.4 Oracle Web Services Security Tuning ... 25-6 25.4.1 Choosing the Right Policy ... 25-7 25.4.2 Policy Manager... 25-7 25.4.3 Configuring the Log Assertion to Record SOAP Messages ... 25-7 25.4.4 Monitoring the Performance of Web Services... 25-7
Part VI
Oracle WebCenter Components
26
Oracle WebCenter Performance Tuning
26.2.4 Using Content Compression to Reduce Downloads ... 26-3 26.3 Tuning WebCenter Application Configuration... 26-4 26.3.1 Setting HTTP Session Timeout ... 26-4 26.3.2 Setting JSP Page Timeout... 26-4 26.3.3 Setting ADF Client State Token ... 26-5 26.3.4 Setting ADF View State Compression ... 26-5 26.3.5 Setting MDS Cache Size and Purge Rate... 26-6 26.3.6 Configuring Concurrency Management ... 26-6 26.4 Tuning Back-End Component Configuration... 26-8 26.4.1 Tuning Performance of the Announcements Service... 26-9 26.4.2 Tuning Performance of the Discussions Service ... 26-9 26.4.3 Tuning Performance of the Instant Messaging and Presence (IMP) Service ... 26-10 26.4.4 Tuning Performance of the Mail Service ... 26-10 26.4.5 Tuning Performance of the Personal Events Service... 26-11 26.4.6 Tuning Performance of the RSS News Feed Service ... 26-12 26.4.7 Tuning Performance of the Search Service ... 26-12 26.4.8 Configuring Portlet Cache Size ... 26-12 26.5 Tuning Portlet Configuration ... 26-13 26.5.1 Tuning Performance of the Portlet Service ... 26-13 26.5.2 Enabling Java Object Cache for WSRP Producers ... 26-14 26.5.3 Suppressing Optimistic Rendering for WSRP Portlets ... 26-14 26.5.4 Tuning Performance of Oracle PDK-Java Producers ... 26-15 26.5.5 Setting ExcludedActionScopeRequestAttributes for Portlets ... 26-15 26.5.6 Setting DefaultServedResourceRequiresWsrpRewrite for WSRP Portlets ... 26-15 26.5.7 Setting DefaultProxiedResourceRequiresWsrpRewrite for WSRP Portlets... 26-16 26.5.8 Importing Consumer CSS Files in IFrame Portlets... 26-16 26.5.9 Configuring Portlet Timeout ... 26-16 26.5.10 Tuning Performance of OmniPortlet ... 26-17
Part VII
Capacity Planning, Scalability, and Availability
27
Capacity Planning
27.5.4 Database Configuration ... 27-6
28
Using Clusters and High Availability Features
28.1 About Clusters and High Availability Features... 28-1 28.2 Using Clusters with Oracle Fusion Middleware... 28-2 28.3 Using High Availability Features with Oracle Fusion Middleware ... 28-3
Part VIII
Appendixes
A
Related Reading and References
A.1 Oracle Documentation ... A-1 A.1.1 Oracle Fusion Middleware Library... A-1 A.1.2 Oracle Database ... A-2 A.1.3 Oracle JRockit Java Virtual Machine (JVM) ... A-2
Preface
This guide describes how to monitor and optimize performance, review the key components that impact performance, use multiple components for optimal performance, and design applications for performance in the Oracle Fusion Middleware environment.
This preface contains these topics:
■ Audience
■ Documentation Accessibility
■ Conventions
Audience
Oracle Fusion Middleware Performance and Tuning Guide is aimed at a target audience of Application developers, Oracle Fusion Middleware administrators, database
administrators, and Web masters.
Documentation Accessibility
Our goal is to make Oracle products, services, and supporting documentation accessible to all users, including users that are disabled. To that end, our
documentation includes features that make information available to users of assistive technology. This documentation is available in HTML format, and contains markup to facilitate access by the disabled community. Accessibility standards will continue to evolve over time, and Oracle is actively engaged with other market-leading
technology vendors to address technical obstacles so that our documentation can be accessible to all of our customers. For more information, visit the Oracle Accessibility Program Web site at http://www.oracle.com/accessibility/.
Accessibility of Code Examples in Documentation
Screen readers may not always correctly read the code examples in this document. The conventions for writing code require that closing braces should appear on an
otherwise empty line; however, some screen readers may not always read a line of text that consists solely of a bracket or brace.
Accessibility of Links to External Web Sites in Documentation
This documentation may contain links to Web sites of other companies or
Access to Oracle Support
Oracle customers have access to electronic support through My Oracle Support. For information, visit http://www.oracle.com/support/contact.html or visit http://www.oracle.com/accessibility/support.html if you are hearing impaired.
Conventions
The following text conventions are used in this document:
Convention Meaning
boldface Boldface type indicates graphical user interface elements associated with an action, or terms defined in text or the glossary.
italic Italic type indicates book titles, emphasis, or placeholder variables for which you supply particular values.
Part I
Part IIntroduction
This part describes basic performance concepts, how to measure performance, and designing applications for performance and scalability. It contains the following chapters:
■ Chapter 1, "Introduction and Roadmap"
■ Chapter 2, "Top Performance Areas"
■ Chapter 3, "Performance Planning"
1
1
Introduction and Roadmap
This section describes the contents and organization of this guide.
■ Section 1.1, "Document Scope and Audience"
■ Section 1.2, "Guide to this Document"
■ Section 1.3, "Related Documentation"
1.1 Document Scope and Audience
Oracle Fusion Middleware Performance and Tuning Guide is for a target audience of Application developers, Oracle Fusion Middleware administrators, database administrators, and Web masters. This Guide assumes knowledge of Fusion Middleware Administration and hardware performance tuning fundamentals, WebLogic Server, XML, and the Java programming language.
1.2 Guide to this Document
■ This chapter, Chapter 1, "Introduction and Roadmap," introduces the objectives and organization of this guide.
■ Chapter 2, "Top Performance Areas," describes top tuning areas for Oracle Fusion Middleware and serves as a ’quick start’ for tuning applications.
■ Chapter 3, "Performance Planning," describes the performance planning methodology and tuning concepts for Oracle Fusion Middleware.
■ Chapter 4, "Monitoring Oracle Fusion Middleware," describes how to monitor Oracle Fusion Middleware and its components to obtain performance data that can assist you in tuning the system and debugging applications with performance problems.
■ Chapter 5, "Oracle HTTP Server Performance Tuning," discusses the techniques for optimizing Oracle HTTP Server performance, the Web server component for Oracle Fusion Middleware. It provides a listener for Oracle WebLogic Server and the framework for hosting static pages, dynamic pages, and applications over the Web.
■ Chapter 6, "Oracle Dynamic Monitoring Service" provides an overview and features available in the Oracle Dynamic Monitoring Service (DMS).
Guide to this Document
■ Chapter 8, "Oracle Application Development Framework Performance Tuning," provides basic guidelines on how to maximize the performance and scalability of the ADF stack in applications. Oracle ADF is an end-to-end application framework that builds on Java Platform, Enterprise Edition (Java EE) standards and
open-source technologies to simplify and accelerate implementing
service-oriented applications. This chapter covers design time, configuration time, and deployment time performance considerations.
■ Chapter 9, "Oracle TopLink (EclipseLink) JPA Performance Tuning," provides some of the available performance options for Java Persistence API (JPA) entity architecture. Oracle TopLink includes EclipseLink as the JPA implementation.
■ Chapter 10, "Oracle Web Cache Performance Tuning," provides methods and guidelines for improving the performance of Oracle Application Server Web Cache (Oracle Web Cache). Oracle Web Cache is a content-aware server accelerator or reverse proxy that improves the performance, scalability, and availability of Web sites that run on Oracle Fusion Middleware.
■ Chapter 11, "Cross Component Tuning for SOA Suite," describes the common SOA infrastructure tuning parameters for configuring Oracle Service-Oriented
Architecture (SOA) Suite components to improve performance. Oracle SOA Suite provides a complete set of service infrastructure components for designing, deploying, and managing SOA composite applications. Oracle SOA Suite enables services to be created, managed, and orchestrated into SOA composite
applications. Composites enable you to easily assemble multiple technology components into one SOA composite application.
■ Chapter 12, "Oracle Business Rules Performance Tuning" describes the technology that enables automation of business rules; it also discusses the extraction of business rules from procedural logic such as Java code or BPEL processes.
■ Chapter 13, "Oracle BPEL Process Manager Performance Tuning," provides several BPEL property settings that can be configured to optimize performance at the process, domain, and application server levels. This chapter describes these property settings and provides recommendations on how to use them.
■ Chapter 14, "Oracle Mediator Performance Tuning," describes how to tune Oracle Mediator, a service engine within the Oracle SOA Service Infrastructure, for optimal performance. Oracle Mediator provides the framework to mediate between various providers and consumers of services and events. The Mediator service engine runs with the SOA Service Infrastructure Java EE application.
■ Chapter 15, "Oracle Business Process Management Tuning" describes how to tune Oracle Service Bus (OSB) which provides connectivity, routing, mediation, management and also some process orchestration capabilities.
■ Chapter 16, "Oracle Human Workflow Performance Tuning," describes how to tune Oracle Human Workflow for optimal performance. Oracle Human Workflow is a service engine running in Oracle SOA Service Infrastructure that allows the execution of interactive human driven processes. A human workflow provides the human interaction support such as approve, reject, and reassign actions within a process or outside of any process. The Human Workflow service consists of a number of services that handle various aspects of human interaction with a business process.
Guide to this Document
systems, FTP servers, database queues (advanced queues, or AQ), Java Message Services (JMS), database tables, and message queues (MQ Series).
■ Chapter 18, "Oracle Business Activity Monitoring Performance Tuning," describes how to tune the Oracle Business Activity Monitoring dashboard application for optimal performance. Oracle Business Activity Monitoring (BAM) provides the tools for monitoring business services and processes in the enterprise.
■ Chapter 19, "User Messaging Service Performance Tuning," describes tips for tuning the User Messaging Service. Oracle User Messaging Service (Oracle UMS) enables two way communications between users and deployed applications. It has support for a variety of channels, such as email, IM, SMS, and text-to-voice messages. Oracle UMS is integrated with Oracle Fusion Middleware components, such as Oracle BPEL PM, Oracle Human Workflow, Oracle BAM and Oracle WebCenter.
■ Chapter 20, "Oracle B2B Performance Tuning" provides tuning tips for Oracle B2B. Oracle B2B is an e-commerce gateway that enables the secure and reliable
exchange of business documents between an enterprise and its trading partners. Oracle B2B supports business-to-business document standards, security,
transports, messaging services, and trading partner management. With Oracle B2B used as a binding component within an Oracle SOA Suite composite application, end-to-end business processes can be implemented.
■ Chapter 21, "Oracle Service Bus Performance Tuning" provides basic and advanced tuning tips and design considerations for Oracle Service Bus.
■ Chapter 22, "Oracle Internet Directory Performance Tuning," provides guidelines on Oracle Internet Directory tuning and configuration requirements. Oracle Internet Directory is an LDAP Version 3-enabled service that enables fast retrieval and centralized management of information about dispersed users, network configuration, and other resources.
■ Chapter 23, "Oracle Virtual Directory Performance Tuning," provides tuning tips for Oracle Virtual Directory. Oracle Virtual Directory is an LDAP Version
3-enabled service that provides an abstracted view of one or more enterprise data sources. Oracle Virtual Directory consolidates multiple data sources into a single directory view, enabling you to integrate LDAP-aware applications with diverse directory server data stores.
■ Chapter 24, "Oracle Identity Federation Performance Tuning," provides tuning tips for Oracle Identity Federation, a standalone, self-contained federation server that enables single sign-on (SSO) and authentication in a multiple-domain identity network.
■ Chapter 25, "Oracle Fusion Middleware Security Performance Tuning," describes Oracle Platform Security for Java. Oracle Platform Security for Java is the Oracle Fusion Middleware security implementation for Java features such as Java Authentication and Authorization Service (JAAS) and Java EE security. This chapter describes how you can configure it for optimal performance.
■ Chapter 26, "Oracle WebCenter Performance Tuning," provides suggested tuning tips for Oracle WebCenter including: Environment Configuration, Application Configuration and Back-End Services and Server Configuration.
■ Chapter 27, "Capacity Planning," discusses the process of determining what type of hardware and software configuration is required to meet application needs.
Related Documentation
components, and explains how they can be deployed in a high availability architecture to maximize performance.
■ Appendix A, "Related Reading and References," provides references to additional performance-related documentation.
1.3 Related Documentation
For more information, see the following documents in the Oracle Fusion Middleware 11g Release 1 (11.1.1) documentation set:
■ Oracle Fusion Middleware Administrator's Guide
■ Oracle Fusion Middleware 2 Day Administration Guide
■ Oracle Fusion Middleware Concepts
■ Oracle Fusion Middleware Security Guide
■ Oracle Fusion Middleware High Availability Guide
■ Oracle Fusion Middleware Performance and Tuning for Oracle WebLogic Server
■ Oracle Fusion Middleware Administrator's Guide for Oracle SOA Suite
■ Oracle Fusion Middleware Administrator's Guide for Oracle WebCenter
■ Oracle Fusion Middleware Administrator's Guide for Oracle HTTP Server
■ Oracle Fusion Middleware Administrator's Guide for Oracle Web Cache
■ Oracle Fusion Middleware Security and Administrator's Guide for Web Services
■ Oracle Fusion Middleware Administrator's Guide for Oracle Internet Directory
■ Oracle Fusion Middleware Administrator's Guide for Oracle Virtual Directory
2
2
Top Performance Areas
This chapter describes the top tuning areas for Oracle Fusion Middleware. It covers critical Oracle Fusion Middleware performance areas and provides a quick start for tuning Java EE applications in the following sections:
■ Section 2.1, "About Identifying Top Performance Areas"
■ Section 2.2, "Ensure the Hardware Resources are Sufficient"
■ Section 2.3, "Tune the Operating System"
■ Section 2.4, "Tune Java Virtual Machines (JVMs)"
■ Section 2.5, "Tune the WebLogic Server"
■ Section 2.6, "Tune Database Parameters"
■ Section 2.7, "Reuse Database Connections"
■ Section 2.8, "Enable Data Source Statement Caching"
■ Section 2.9, "Control Concurrency"
■ Section 2.10, "Set Logging Levels"
2.1 About Identifying Top Performance Areas
One of the most challenging aspects of performance tuning is knowing where to begin. This chapter serves as a ’quick start’ guide to performance tuning your Oracle Fusion Middleware applications.
Ensure the Hardware Resources are Sufficient
2.2 Ensure the Hardware Resources are Sufficient
A key component of managing the performance of Oracle Fusion Middleware
applications is to ensure that there are sufficient CPU, memory, and network resources to support the user and application requirements for your installation.
No matter how well you tune your applications, if you do not have the appropriate hardware resources, your applications cannot reach optimal performance levels. Oracle Fusion Middleware has minimum hardware requirements for its applications and database tier. For details on Oracle Fusion Middleware supported configurations, see "System Requirements and Prerequisites" in the Oracle Fusion Middleware
Installation Planning Guide for your platform. Table 2–1 Top Performance Areas for Oracle Fusion Middleware
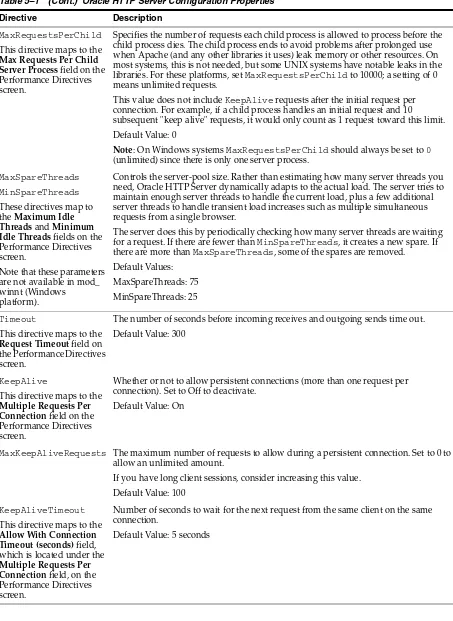
Performance Area Description and Reference
Hardware Resources Ensure that your hardware resources meet or exceed the application's resource requirements to maximize performance.
See Section 2.2, "Ensure the Hardware Resources are Sufficient" for information on how to determine if your hardware resources are sufficient.
Operating System Each operating system has native tools and utilities that can be useful for monitoring purposes.
See Section 2.3, "Tune the Operating System"
Java Virtual Machines (JVMs) This section discusses best practices and provides practical tips to tune the JVM and improve the performance of a Java EE application. It also discusses heap size and JVM garbage collection options.
See Section 2.4, "Tune Java Virtual Machines (JVMs)".
Database For applications that access a database, ensure that your database is properly configured to support your application's requirements. See Section 2.6, "Tune Database Parameters" for more information on garbage collection.
WebLogic Server If your Oracle Fusion Middleware applications are using the WebLogic Server, see Section 2.5, "Tune the WebLogic Server".
Database Connections Pooling the connections so they are reused is an important tuning consideration.
See Section 2.7, "Reuse Database Connections"
Data Source Statement Caching For applications that use a database, you can lower the performance impact of repeated statement parsing and creation by configuring statement caching properly.
See Section 2.8, "Enable Data Source Statement Caching"
Oracle HTTP Server Tune the Oracle HTTP Server directives to set the level of concurrency by specifying the number of HTTP connections.
See Section 2.9, "Control Concurrency".
Concurrency This section discusses ways to control concurrency with Oracle Fusion Middleware components.
See Section 2.9, "Control Concurrency"
Logging Levels Logging levels are thresholds that a system administrator sets to control how much information is logged. Performance can be impacted by the amount of information that applications log therefore it is important to set the logging levels appropriately.
Tune Java Virtual Machines (JVMs)
Sufficient hardware resources should meet or exceed the acceptable response times and throughputs for applications without becoming saturated. To verify that you have sufficient hardware resources, you should monitor resource utilization over an
extended period to determine if (or when) you have occasional peaks of usage or whether a resource is consistently saturated. For more information on monitoring, see Chapter 4, "Monitoring Oracle Fusion Middleware".
If any of the hardware resources are saturated (consistently at or near 100% utilization), one or more of the following conditions may exist:
■ The hardware resources are insufficient to run the application.
■ The system is not properly configured.
■ The application or database must be tuned.
For a consistently saturated resource, the solutions are to reduce load or increase resources. For peak traffic periods when the increased response time is not acceptable, consider increasing resources or determine if there is traffic that can be rescheduled to reduce the peak load, such as scheduling batch or background operations during slower periods.
Oracle Fusion Middleware provides a variety of mechanisms to help you control resource concurrency; this can limit the impact of bursts of traffic. However, for a consistently saturated system, these mechanisms should be viewed as temporary solutions. For more information see Section 2.9, "Control Concurrency".
2.3 Tune the Operating System
Each operating system has native tools and utilities that can be useful for monitoring and tuning purposes. Native operating system commands enable you to monitor CPU utilization, paging activity, swapping, and other system activity information.
For details on operating system commands, and guidelines for performance tuning of the network or operating system, refer to the documentation provided by the
operating system vendor.
2.4 Tune Java Virtual Machines (JVMs)
How you tune your JVM greatly affects the performance of Oracle Fusion Middleware and your applications.
Tip: Your target CPU usage should not reach 100% utilization. You should determine a target CPU utilization based on your application needs, including CPU cycles for peak usage.
Tune Java Virtual Machines (JVMs)
This section covers the following performance tuning areas for your JVM:
■ Configuring Garbage Collection
■ Logging Low Memory Conditions
■ Monitoring and Profiling the JVM
2.4.1 Configuring Garbage Collection
Garbage collection is the JVM process of freeing up unused Java objects in the Java heap. JVM garbage collection can be a resource-intensive operation and may effect application performance. In some cases, inefficient garbage collection can severely degrade application performance. Therefore, it is important to understand how applications create and destroy objects.
This section cover the following Garbage Collection tuning options:
■ Specifying Heap Size Values
■ Selecting a Garbage Collection Scheme
■ Disabling Explicit Garbage Collection
An acceptable rate for garbage collection is application-specific and should be adjusted after analyzing the actual time and frequency of garbage collections. If you set a large heap size, full garbage collection is slower, but it occurs less frequently. If you set your heap size in accordance with your memory needs, full garbage collection is faster, but occurs more frequently.
To tune the JVM garbage collection options you must analyze garbage collection data and check for the frequency and type of garbage collections, the size of the memory pools, and the time spent on garbage collection.
Before you configure JVM garbage collection, analyze the following data points:
1. How often is garbage collection taking place? Compare the time stamps around the garbage collection.
2. How long is a full garbage collection taking?
3. What is the heap size after each full garbage collection? If the heap is always 85 percent free, for example, you might set the heap size smaller.
4. Do the young generation heap sizes (Sun) or Nursery size (Jrockit) need tuning? Note: To maximize performance from your JVM, be sure that you
use only production JVMs on which your applications have been certified and that your operating system patches are up-to-date.
The Supported Configurations pages at
http://www.oracle.com/technology/software/products/i as/files/fusion_certification.html are frequently updated and contain the latest certification information on various platforms.
See Also: The JVM provides a variety of parameters to enable you to more finely tune heap management and garbage collection behavior.
Tune Java Virtual Machines (JVMs)
You can manually log garbage collection and memory pool sizes using verbose garbage collection logging:
■ Sun JVM command line options:
-verbose:gc
-XX:+PrintGCDetails -XX:+PrintGCTimeStamps
Look for "Full GC" to identify major collections.
■ Additional Sun Tools:
– JStat
– JConsole
– Visualgc
For more information on Sun’s options, see
http://java.sun.com/javase/technologies/hotspot/gc/index.jsp
■ Jrockit JVM command line options:
-XXverbose:gc
NOTE: Oracle provides other command-line options to improve the performance of your JRockit VM. For detailed information, see "JRockit JDK Command Line Options by Name" at http://download.oracle.com/docs/cd/E13150_ 01/jrockit_jvm/jrockit/webdocs/index.html
■ Additional JRockit Tools:
– JRockit Runtime Analyzer (jra recording)
– JRockit Management Console (jrmc)
– JRockit Memory Leak Detector
2.4.1.1 Specifying Heap Size Values
The goal of tuning your heap size is to minimize the time that your JVM spends doing garbage collection while maximizing the number of clients that the Fusion
Middleware stack can handle at a given time.
Specifically the Java heap is where the objects of a Java program live. It is a repository for live objects, dead objects, and free memory. When an object can no longer be reached from any pointer in the running program, it is considered "garbage" and ready for collection. A best practice is to tune the time spent doing garbage collection to within 5% of execution time.
The JVM heap size determines how often and how long the virtual machine spends collecting garbage. An acceptable rate for garbage collection is application-specific and should be adjusted after analyzing the actual time and frequency of garbage
collections. If you set a large heap size, full garbage collection is slower, but it occurs less frequently. If you set your heap size in accordance with your memory needs, full garbage collection is faster, but occurs more frequently.
Tune Java Virtual Machines (JVMs)
JVMs running on your system does not exceed the amount of available physical RAM. If this value is exceeded, the Operating System starts paging and performance
degrades significantly. The virtual machine always uses more memory than the heap size. The memory required for internal virtual machine functionality, native libraries outside of the virtual machine, and permanent generation memory (memory required to store classes and methods) is allocated in addition to the heap size settings.
For example, you can use the following JVM options to tune the heap:
■ If you run out of heap memory (not due to a memory leak), increase -Xmx.
■ If you run out of native memory, you may need to decrease -Xmx.
■ For Oracle JRockit, modify -Xns:<nursery size> to tune the size of the nursery.
■ For Sun JVM, modify -Xmn to tune the size of the heap for the young generation.
If you receive java.lang.OutOfMemoryError: PermGen space errors, you may also need to increase the permanent generation space.
2.4.1.2 Selecting a Garbage Collection Scheme
Depending on which JVM you are using, you can choose from several garbage collection schemes to manage your system memory. Some garbage collection schemes are more appropriate for a given type of application. Once you have an understanding of the workload of the application and the different garbage collection algorithms utilized by the JVM, you can optimize the configuration of the garbage collection.
Refer to the following links for garbage collection options for your JVM:
■ For an overview of the garbage collection schemes available with Sun's HotSpot VM, see "Java SE 6 HotSpot Virtual Machine Garbage Collection Tuning" at http://java.sun.com/javase/technologies/hotspot/gc/gc_tuning_ 6.html.
■ For a comprehensive explanation of the collection schemes available, see "Memory Management in the Java HotSpot™ Virtual Machine" at
http://java.sun.com/j2se/reference/whitepapers/memorymanageme See Also: For more information on tuning the young generation see
the "Young Generation" section of the Java SE 6 HotSpot Virtual Machine Garbage Collection Tuning at
http://java.sun.com/javase/technologies/hotspot/gc/g c_tuning_6.html#generation_sizing.young_gen
For more information on Oracle JRockit heap configurations, see "Setting the Heap and Nursery Size" in Diagnostics Guide at http://download.oracle.com/docs/cd/E13188_ 01/jrockit/geninfo/diagnos/memman.html
For the Sun java virtual machine see the "Insufficient Memory" section of "Monitoring and Managing Java SE 6 Platform Applications" at
http://java.sun.com/developer/technicalArticles/J2SE /monitoring/index.html#Insufficient_Memory.
"Out of Memory" Frequently Asked Questions section at
Tune Java Virtual Machines (JVMs)
■ For a discussion of the garbage collection schemes available with the JRockit JDK, see "Using the JRockit Memory Management System" at
http://download.oracle.com/docs/cd/E13150_01/jrockit_ jvm/jrockit/webdocs/index.html.
2.4.1.3 Disabling Explicit Garbage Collection
The following parameters are used to help diagnose whether explicit garbage collections are occurring. They can also be used to disable the explicit garbage collections if necessary until the code is fixed:
■ For Sun virtual machines use -XX:+DisableExplicitGC
For more information on using the explicit garbage collections, see "Java SE 6 HotSpot Virtual Machine Garbage Collection Tuning " at
http://java.sun.com/javase/technologies/hotspot/gc/gc_tuning_ 6.html.
■ For Oracle JRockit virtual machines use -XXnoSystemGC
For more information on tuning the Oracle JRockit, see at http://download.oracle.com/docs/cd/E13188_ 01/jrockit/geninfo/diagnos/bestpractices.html
These parameters disable explicit garbage collection. Applications should avoid the use of system.gc() calls. If you suspect an application may be explicitly triggering garbage collection, set this parameter and observe the differences in your garbage collection behavior. If you detect that performance is affected by explicit collections, check the code to determine where explicit garbage collections are used and why, and the impact of disabling the calls. Application developers sometimes use system.gc() calls to trigger finalizers. This is not a recommended practice and can yield
indeterminate behavior.
2.4.2 Logging Low Memory Conditions
WebLogic Server enables you to automatically log low memory conditions observed by the server. WebLogic Server detects low memory by sampling the available free memory a set number of times during a time interval. At the end of each interval, an average of the free memory is recorded and compared to the average obtained at the next interval. If the average drops by a user-configured amount after any sample interval, the server logs a low memory warning message in the log file and sets the server health state to "warning."
2.4.3 Monitoring and Profiling the JVM
Monitoring the performance of your JVM is crucial to achieving optimal performance. Depending on your platform, the following tools can be used to monitor and profile your JVM:
■ Oracle JRockit® Mission Control
See Also: For more information on using WebLogic Server to detect low memory conditions refer to the following:
"Log low memory conditions" in Oracle Fusion Middleware Oracle WebLogic Server Administration Console Online Help.
Tune the WebLogic Server
Oracle JRockit Mission Control is a suite of tools designed to monitor, manage, profile, and eliminate memory leaks in your Java application without the performance impacts normally associated with these types of tools.
For more information on the Oracle JRockit Mission Control see: http://download.oracle.com/docs/cd/E13188_
01/jrockit/tools/index.html
■ Sun JVM
The Java™ Platform comes with the following monitoring facilities built-in:
■ Java Virtual Machine Monitoring and Management API
■ JConsole
■ Hprof Tools
■ Logging Monitoring and Management Interface
■ Java Management Extensions (JMX)
For more information on the Java platform monitoring tools, see:
http://java.sun.com/developer/technicalArticles/J2SE/monitori ng/
2.5 Tune the WebLogic Server
If your Oracle Fusion Middleware applications are using the WebLogic Server, see "Top Tuning Recommendations for WebLogic Server" in Oracle Fusion Middleware Performance and Tuning for Oracle WebLogic Server.
2.6 Tune Database Parameters
To achieve optimal performance for applications that use the Oracle database, the database tables you access must be designed with performance in mind. Monitoring and tuning the database ensures that you get the best performance from your applications.
This section covers the following:
■ Tuning init.ora Database Parameters
■ Tuning Redo Logs Location and Sizing
■ Automatic Segment-Space Management (ASSM)
2.6.1 Tuning init.ora Database Parameters
The following tables provide common init.ora parameters and their descriptions. Consider following these guidelines to set the database parameters. Ultimately, however, the DBA should monitor the database health and tune parameters based on the need. See the following tables for more information:
Tune Database Parameters
Consider applying Patch Set Release (PSR) 11.1.0.7 and upgrade the database prior to attempting the following modifications.
2.6.1.1 Initialization Parameters for Oracle 10g
The following table describes several performance-related database initialization parameters for Oracle 10g database.
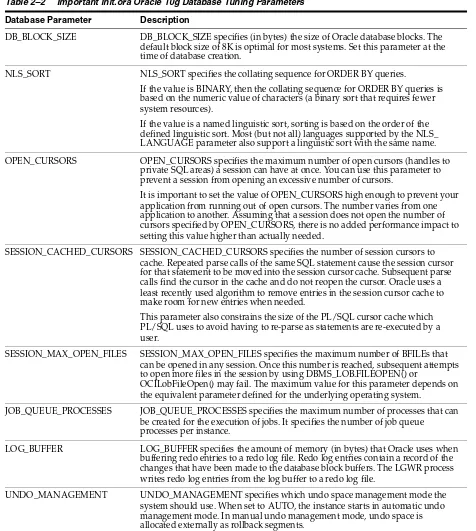
Table 2–2 Important init.ora Oracle 10g Database Tuning Parameters
Database Parameter Description
DB_BLOCK_SIZE DB_BLOCK_SIZE specifies (in bytes) the size of Oracle database blocks. The default block size of 8K is optimal for most systems. Set this parameter at the time of database creation.
NLS_SORT NLS_SORT specifies the collating sequence for ORDER BY queries.
If the value is BINARY, then the collating sequence for ORDER BY queries is based on the numeric value of characters (a binary sort that requires fewer system resources).
If the value is a named linguistic sort, sorting is based on the order of the defined linguistic sort. Most (but not all) languages supported by the NLS_ LANGUAGE parameter also support a linguistic sort with the same name.
OPEN_CURSORS OPEN_CURSORS specifies the maximum number of open cursors (handles to private SQL areas) a session can have at once. You can use this parameter to prevent a session from opening an excessive number of cursors.
It is important to set the value of OPEN_CURSORS high enough to prevent your application from running out of open cursors. The number varies from one application to another. Assuming that a session does not open the number of cursors specified by OPEN_CURSORS, there is no added performance impact to setting this value higher than actually needed.
SESSION_CACHED_CURSORS SESSION_CACHED_CURSORS specifies the number of session cursors to cache. Repeated parse calls of the same SQL statement cause the session cursor for that statement to be moved into the session cursor cache. Subsequent parse calls find the cursor in the cache and do not reopen the cursor. Oracle uses a least recently used algorithm to remove entries in the session cursor cache to make room for new entries when needed.
This parameter also constrains the size of the PL/SQL cursor cache which PL/SQL uses to avoid having to re-parse as statements are re-executed by a user.
SESSION_MAX_OPEN_FILES SESSION_MAX_OPEN_FILES specifies the maximum number of BFILEs that can be opened in any session. Once this number is reached, subsequent attempts to open more files in the session by using DBMS_LOB.FILEOPEN() or
OCILobFileOpen() may fail. The maximum value for this parameter depends on the equivalent parameter defined for the underlying operating system.
JOB_QUEUE_PROCESSES JOB_QUEUE_PROCESSES specifies the maximum number of processes that can be created for the execution of jobs. It specifies the number of job queue
processes per instance.
LOG_BUFFER LOG_BUFFER specifies the amount of memory (in bytes) that Oracle uses when buffering redo entries to a redo log file. Redo log entries contain a record of the changes that have been made to the database block buffers. The LGWR process writes redo log entries from the log buffer to a redo log file.
Tune Database Parameters
2.6.1.2 Initialization Parameters for Oracle 11g
The following table provides information on some important performance-related database initialization parameters for Oracle 11g database.
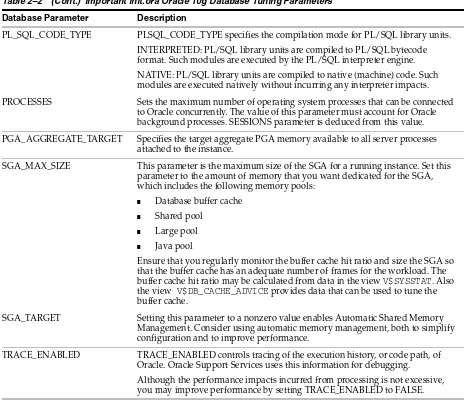
PL_SQL_CODE_TYPE PLSQL_CODE_TYPE specifies the compilation mode for PL/SQL library units. INTERPRETED: PL/SQL library units are compiled to PL/SQL bytecode format. Such modules are executed by the PL/SQL interpreter engine. NATIVE: PL/SQL library units are compiled to native (machine) code. Such modules are executed natively without incurring any interpreter impacts.
PROCESSES Sets the maximum number of operating system processes that can be connected to Oracle concurrently. The value of this parameter must account for Oracle background processes. SESSIONS parameter is deduced from this value.
PGA_AGGREGATE_TARGET Specifies the target aggregate PGA memory available to all server processes attached to the instance.
SGA_MAX_SIZE This parameter is the maximum size of the SGA for a running instance. Set this parameter to the amount of memory that you want dedicated for the SGA, which includes the following memory pools:
■ Database buffer cache ■ Shared pool
■ Large pool ■ Java pool
Ensure that you regularly monitor the buffer cache hit ratio and size the SGA so that the buffer cache has an adequate number of frames for the workload. The buffer cache hit ratio may be calculated from data in the view V$SYSSTAT. Also the view V$DB_CACHE_ADVICE provides data that can be used to tune the buffer cache.
SGA_TARGET Setting this parameter to a nonzero value enables Automatic Shared Memory Management. Consider using automatic memory management, both to simplify configuration and to improve performance.
TRACE_ENABLED TRACE_ENABLED controls tracing of the execution history, or code path, of Oracle. Oracle Support Services uses this information for debugging.
Although the performance impacts incurred from processing is not excessive, you may improve performance by setting TRACE_ENABLED to FALSE.
Table 2–3 Important inti.ora Oracle 11g Database Tuning Parameters
Database Parameter Description
AUDIT_TRAIL AUDIT_TRAIL enables or disables database auditing.
MEMORY_MAX_ TARGET
MEMORY_MAX_TARGET specifies the maximum value to which a DBA can set the MEMORY_TARGET initialization parameter.
MEMORY_TARGET MEMORY_TARGET specifies the Oracle system-wide usable memory. The database tunes memory to the MEMORY_TARGET value, reducing or enlarging the SGA and PGA as needed.
PGA_AGGREGATE_ TARGET
Specifies the target aggregate PGA memory available to all server processes attached to the instance. In Oracle 11g, set MEMORY_TARGET instead of setting SGA and the PGA separately.
SGA_MAX_SIZE Consider setting MEMORY_TARGET instead of setting SGA and the PGA separately.
SGA_TARGET Consider setting MEMORY_TARGET instead of setting SGA and the PGA separately. Table 2–2 (Cont.) Important init.ora Oracle 10g Database Tuning Parameters
Reuse Database Connections
2.6.2 Tuning Redo Logs Location and Sizing
Managing the database I/O load balancing is a non-trivial task. However, tuning the redo log options can provide performance improvement for applications running in an Oracle Fusion Middleware environment, and in some cases, you can significantly improve I/O throughput by moving the redo logs to a separate disk.
The size of the redo log files can also influence performance, because the behavior of the database writer and archiver processes depend on the redo log sizes. Generally, larger redo log files provide better performance by reducing checkpoint activity. It is not possible to provide a specific size recommendation for redo log files, but redo log files in the range of a hundred megabytes to a few gigabytes are considered
reasonable. Size your online redo log files according to the amount of redo your system generates. A rough guide is to switch logs at most once every twenty minutes. Set the initialization parameter LOG_CHECKPOINTS_TO_ALERT = TRUE to have checkpoint times written to the alert file.
The complete set of required redo log files can be created during database creation. After they are created, the size of a redo log size cannot be changed. New, larger files can be added later, however, and the original (smaller) ones can be dropped. For more information see the Oracle Database Performance Tuning Guide.
2.6.3 Automatic Segment-Space Management (ASSM)
For permanent tablespaces, consider using automatic segment-space management. Such tablespaces, often referred to as bitmap tablespaces, are locally managed tablespaces with bitmap segment space management.
For backward compatibility, the default local tablespace segment-space management mode is MANUAL.
For more information, see "Free Space Management" in Oracle Database Concepts, and "Specifying Segment Space Management in Locally Managed Tablespaces" in Oracle Database Administrator's Guide.
2.7 Reuse Database Connections
Creating a database connection is a relatively resource intensive process in any environment. Typically, a connection pool starts with a small number of connections. As client demand for more connections grow, there may not be enough in the pool to satisfy the requests. WebLogic Server creates additional connections and adds them to the pool until the maximum pool size is reached.
One way to avoid connection creation delays is to initialize all connections at server startup, rather than on-demand as clients need them. This may be appropriate if your load is predictable and even. Set the initial number of connections equal to the maximum number of connections in the Connection Pool tab of your data source configuration. Determine the optimal value for the Maximum Capacity as part of your pre-production performance testing.
If your load is uneven, and has a much higher number of connections at peak load than at typical load, consider setting the initial number of connections equal to your typical load. In addition, consider setting the maximum number of connections based on your supported peak load. With these configurations, WebLogic server can free up some connections when they are not used for a period of time.
Enable Data Source Statement Caching
2.8 Enable Data Source Statement Caching
When you use a prepared statement or callable statement in an application or EJB, there may be a performance impact associated with the processing of the
communication between the application server and the database server and on the database server. To minimize the processing impact, enable the data source to cache prepared and callable statements used in your applications. When an application or EJB calls any of the statements stored in the cache, the server reuses the statement stored in the cache. Reusing prepared and callable statements reduces CPU usage on the database server, improving performance for the current statement and leaving CPU cycles for other tasks.
Each connection in a data source has its own individual cache of prepared and callable statements used on the connection. However, you configure statement cache options per data source. That is, the statement cache for each connection in a data source uses the statement cache options specified for the data source, but each connection caches it's own statements. Statement cache configuration options include:
■ Statement Cache Type—The algorithm that determines which statements to store in the statement cache.
■ Statement Cache Size—The number of statements to store in the cache for each connection. The default value is 10. You should analyze your database's statement parse metrics to size the statement cache sufficiently for the number of statements you have in your application.
You can use the Administration Console to set statement cache options for a data source. See "Configure the statement cache for a JDBC data source" in the Oracle Fusion Middleware Oracle WebLogic Server Administration Console Online Help.
For more information on using statement caching, see "Increasing Performance with the Statement Cache" in the Oracle Fusion Middleware Configuring and Managing JDBC for Oracle WebLogic Server.
2.9 Control Concurrency
Limiting concurrency, at multiple layers of the system to match specific usage needs, can greatly improve performance. This section discusses a few of the areas within Oracle Fusion Middleware where concurrency can be controlled.
When system capacity is reached, and a web server or application server continues to accept requests, application performance and stability can deteriorate. There are several places within Oracle Fusion Middleware where you can throttle the requests to avoid overloading the mid-tier or database tier systems and tune for best performance.
■ HTTP Connection Limits
■ Setting the Maximum Number of Connections for Data Sources
■ Tuning the WebLogic Sever Thread Pool
■ Tuning Oracle WebCenter Concurrency
■ Tuning BPEL Concurrency
2.9.1 HTTP Connection Limits
Control Concurrency
For more information on modifying the httpd.conf file, see "Configuring Oracle HTTP Server" in Oracle Fusion Middleware Administrator's Guide for Oracle HTTP Server.
You can use the MaxClients and ThreadsPerChild directives to limit incoming requests to WebLogic instances from the Oracle HTTP Server based on your expected client load and system resources. The following sections describe some Oracle HTTP Server tuning parameters related to connection limits that you typically need to tune based on your expected client load. See Chapter 5, "Oracle HTTP Server Performance Tuning" for more information and a more complete list of tunable parameters.
2.9.1.1 MaxClients/ThreadsPerChild
The MaxClients property specifies a limit on the total number of server threads running, that is, a limit on the number of clients who can simultaneously connect. If the number of client connections reaches this limit, then subsequent requests are queued in the TCP/IP system up to the limit specified (in the ListenBackLog directive).
You can configure the MaxClients directive in the httpd.conf file up to a maximum of 8K (the default value is 150). If your system is not resource-saturated and you have a user population of more than 150 concurrent HTTP connections, you can improve your performance by increasing MaxClients to increase server concurrency. Increase MaxClients until your system becomes fully utilized (85% is a good threshold).
When system resources are saturated, increasing MaxClients does not improve performance. In this case, the MaxClients value could be reduced as a throttle on the number of concurrent requests on the server.
If the server handles persistent connections, then it may require sufficient concurrent httpd server processes to handle both active and idle connections. When you specify MaxClients to act as a throttle for system concurrency, you need to consider that persistent idle httpd connections also consume httpd processes. Specifically, the number of connections includes the currently active persistent and non-persistent connections and the idle persistent connections. When there are no httpd server threads available, connection requests are queued in the TCP/IP system until a thread becomes available, and eventually clients terminate connections.
You can define a number of server processes and the threads per process
(ThreadsPerChild) to handle the incoming connections to Oracle HTTP Server. The ThreadsPerChild property specifies the upper limit on the number of threads that can be created under a server (child) process.
Note: The MaxClients parameter is applicable only to UNIX platforms and on Microsoft Windows (mpm_winnt), the same is achieved through the ThreadsPerChild and ThreadLimit parameters.
Note: ThreadsPerChild, StartServers, and ServerLimit properties are inter-related with the MaxClients setting. All of these properties must be set appropriately to achieve the number of
Control Concurrency
2.9.1.2 KeepAlive
A persistent, KeepAlive, HTTP connection consumes an httpd child process, or thread, for the duration of the connection, even if no requests are currently being processed for the connection.
If you have sufficient capacity, KeepAlive should be enabled; using persistent connections improves performance and prevents wasting CPU resources re-establishing HTTP connections. Normally, you should not need to change KeepAlive parameters.
2.9.1.3 Tuning MOD_WL_OHS
The Oracle HTTP Server (OHS) uses the mod_wl_ohs module to route requests to the underlying Weblogic server or the Weblogic Server cluster. The configuration details for mod_wl_ohs are available in the mod_wl_ohs.conf file in the config directory.
For more information on the tuning parameters for mod_wl_ohs see, "Understanding Oracle HTTP Server Modules" in Oracle Fusion Middleware Administrator's Guide for Oracle HTTP Server.
2.9.2 Setting the Maximum Number of Connections for Data Sources
For applications that use a database, performance can improve when the connection pool associated with a data source limits the number of connections. You can use the MaxCapacity attribute to limit the database requests from Oracle Application Server so that incoming requests do not saturate the database, or to limit the database requests so that the database access does not overload the Oracle Application Server-tier resource.
The connection pool MaxCapacity attribute specifies the maximum number of connections that a connection pool allows. By default, the value of MaxCapacity is set to 15. For best performance, you should specify a value for MaxCapacity that matches the number appropriate to your database performance characteristics.
Limiting the total number of open database connections to a number your database can handle is an important tuning consideration. You should check to make sure that your database is configured to allow at least as large a number of open connections as the total of the values specified for all the data sources MaxCapacity option, as specified in all the applications that access the database.
Note: The default maximum requests for a persistent connection is 100, as specified with the MaxKeepAliveRequests directive in httpd.conf. By default, the server waits for 15 seconds between requests from a client before closing a connection, as specified with the KeepAliveTimeout directive in httpd.conf.
See Also: "JDBC Data Source: Configuration: Connection Pool" in the Oracle Fusion Middleware Oracle WebLogic Server Administration Console Online Help.