This paper has been presented at International Seminar on Innovation in Mathematics and Mathematics
C
–
8
The Implementation of Meshless Local Petrov Galerkin (MLPG)
Method for Determine Pollutant Sources in Brantas River
Miranda Eliyan 1*, Basuki Widodo 2*
Institut Teknologi Sepuluh Nopember,Surabaya, Indonesia1* [email protected]
Institut Teknologi Sepuluh Nopember,Surabaya, Indonesia2*
Abstract
Pollution in the river often occur and can be threaten for aquatic organisms and humans. Polluted river has negative impacts for people around of the Brantas River. Pollutants entering into the river can be derived from industrial and nonindustrial. Based on these problems, the authors conducted a study and analyze the location of pollutant sources by mathematical approach. To find the location of the pollutant sources is not easy, with applying the Meshless Local Petrov Galerkin method (MLPG) we can determine the distance of the point source of pollutant from sample point monitoring Perum Jasa Tirta. The MLPG method does not use a grid that can be used for domains that are not continuous or move. Pollutant source location obtained from the simulation results that the position of 700m to 1000m which is the fluctuation of the position of the concentration of COD, BOD, DO and TSS were lower. This indicates that there is contamination in the highest position of 700 meters until to 1000meters.
Keywords: MLPG, concentration, pollutant
1. Introduction
Pollutants which result in decreased oxygen levels can be detected its presence by looking at several water quality parameters such as COD, BOD, and DO. Pollutants are not dissolved by water will settle to the bottom and attached to the wall of the river and cause sediment formation. In this research we use Meshless Local Petrov Galerkin Method for determine pollutant sources in the confluences two river in Brantas river.
2. The Meshless Local Petrov Galerkin Method
The MLPG method does not use mesh, It is well in interpolation function with trial and test as well as in the calculation integral. This method was researched by Atlury, He get accurate and actual field conditions (see[3]).
The following linear Poisson equation is given:
3. The Mathematical Model of Brantas River
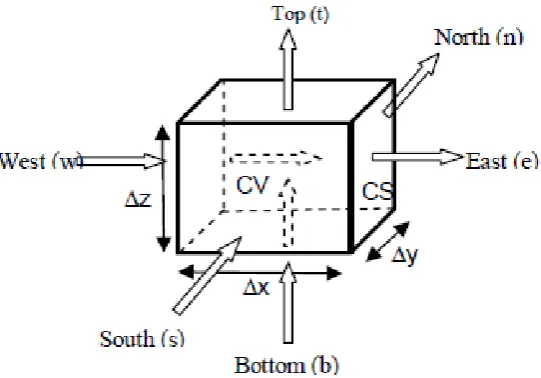
We have assumed the direction of flow of the confluence of two rivers with X-axis and Y-X-axis. In the area the confluence of two streams is assumed there a volume control.
Figure 1 The Schematics of Confluence of Two River
Figure 2 The Control Volume in Confluence of Two River
The Governing Equations:
a. Marmoyo River
Conservation of mass (Continuity Eq.):
Conservation of Momentum:
: Flow rate from marmoyo river : Flow rate from surabaya river Conservation of Momentum: X-Axis:
Y-Axis:
4. Result and Simulation Positioning the X-axis Direction:
For determine the location of the pollutants sources that come from the direction along the marmoyo based on fluctuations in the concentration of COD, BOD and TSS. with provide the initial conditions marmoyo stream velocity, velocity surabaya river, COD, BOD, and TSS same in all positions (x, y). in This simulation assumed a depth of 3m and h is the time t is 10 second. Determining the location of pollutant sources are assumed position 1 represents a distance of 100m of sampling sites by Perum Jasa at Perning Bridge.
The result output of program:
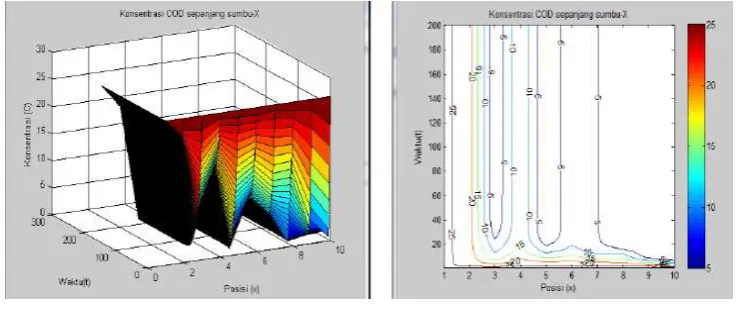
Figure 3 Distribution BOD in X-Axis
Based on the simulation of BOD concentrations is lowest that obtained at intervals position in [7,10]
Based on the simulation of COD concentration is lowest that obtained at intervals position [2,4], position [4,6], and position [7,10].
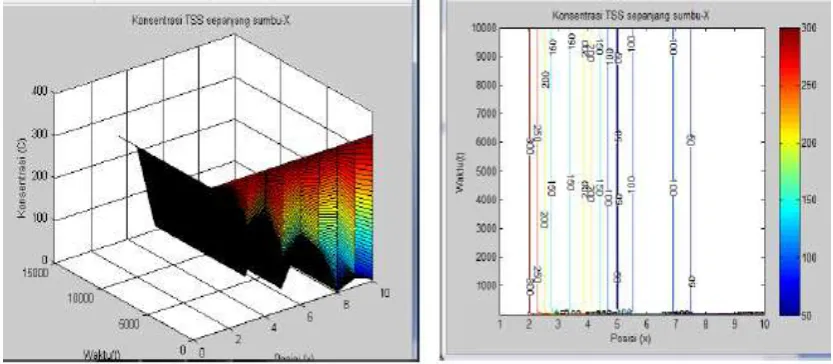
Figure 5 Distribution TSS in X-Axis
Based on the simulation of TSS concentrations is lowest that obtained at intervals position in [5,6] and [7,10].
From the simulation results of COD, BOD and TSS, it is known that lowest concentration is in the interval position [7,10]. When we overlay before confluences of two river along the Marmoyo river seen that the fluctuations in the concentration of COD, BOD and TSS are increased, it is indicates that there is contamination in the highest position [7,10], which is about 700m to 1000m of sampling sites Perum Jasa Tirta.
Position Determination In Direction Y-axis:
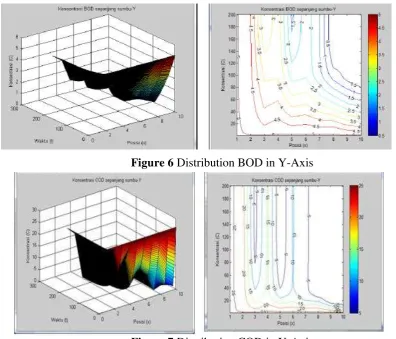
Figure 6 Distribution BOD in Y-Axis
Figure 7 Distribution COD in Y-Axis
Based on the simulation of low COD concentration is obtained at the position of the interval [2,3], [5,6], and [7,10].
Figure 8 Distribution TSS in Y-Axis
From the simulation results of COD, BOD and TSS, it is known that changes is the lowest concentration at the position of the interval [7,10]. If this position in ovelay stricken before the confluence of the river along the Marmoyo seen that fluctuations in the concentration of COD, BOD and TSS are lower, it indicates that the highest contamination in the position [7,10], which is about 700m to 1000m from the location Perum Jasa sampling.
5. Conclusion
Based on the simulation results it can be concluded that the fluctuation of COD, BOD, and TSS is lowest at position 7 to 10, which is at a distance of about 700 meter to 1000 meter from the sampling site Perum Jasa Tirta. It is indicated that there is a high level of pollution.
Acknowledgements The author would like to thanks to Prof.Dr. Basuki Widodo,M.Sc as supervisor, Perum Jasa 1 Malang, and her colleagues for their valuable comments and input.
References
[1] Apsley,David.2005,”Computational Fluid Dynamic”,New York:Spring
2005
[2] Atlurydan Lin. 2001.”The Meshless Local Petrov-Galerkin (MLPG)
Method for Solving Incompressible Navier-Stokes Equation.CMES vol.2.no.2, pp.117-142.
[3] Atlury dan Shen. 2002. ”The Meshless Local Petrov-Galerkin (MLPG)
Method:A Simple & Less-costly Alternative to the Finite Element and Boundary
Element Methods”.CMES vol.3.no.1,pp.11-51.
[4] Darmono.1995.”Logam Dalam Sistem Biologi Makhluk
Hidup”.Universitas Indonesia,Jakarta.
[5] Effendi,H.2003.”TELAAH KUALITAS AIR”, Bagi Pengelola Sumber
Daya dan Lingkungan Perairan.Kanisius,Yogyakarta
[6] Raju.1986.”Aliran Melalui Saluran Terbuka”,Erlangga:Jakarta.
[7] Shabayek, S.,. 2002. “Dynamic Model for Sub Critrical Combining Flows in Channel Junction“, Journal of Hydraulic Engineering, ASCE, pp.821-828
[8] Widodo, B.2013.”Model Matematika Dan Simulasi Komputer Dari
Pengaruh Hidrodinamika Pada Dispersi Polutan di Pertemuan Dua Sungai”,Hibah Penelitian,ITS Surabaya