Summary A process-based, general ecosystem model (BI-OME--BGC) was used to simulate daily gross primary produc-tion, maintenance and heterotrophic respiraproduc-tion, net primary production and net ecosystem carbon exchange of boreal as-pen, jack pine and black spruce stands. Model simulations of daily net carbon exchange of the ecosystem (NEE) explained 51.7% (SE = 1.32 g C m−2 day−1) of the variance in daily NEE derived from stand eddy flux measurements of CO2 during
1994. Differences between measured and simulated results were attributed to several factors including difficulties associ-ated with measuring nighttime CO2 fluxes and model
assump-tions of site homogeneity. However, comparisons between simulations and field data improved markedly at coarser time-scales. Model simulations explained 66.1% (SE = 0.97 g C m−2 day−1) of the variance in measured NEE when 5-day means of daily results were compared. Annual simulations of above-ground net primary production ranged from 0.6--2.4 Mg C ha−1 year−1 and were concurrent with results derived from tree increment core measurements and allometric equations.
Model simulations showed that all of the sites were net sinks (0.1--4.1 Mg C ha−1 year−1) of atmospheric carbon for 1994. Older conifer stands showed narrow margins between uptake of carbon by net photosynthesis and carbon release through respiration. Younger stands were more productive than older stands, primarily because of lower maintenance respiration costs. However, all sites appeared to be less productive than temperate forests. Productivity simulations were strongly linked to stand morphology and site conditions. Old jack pine and aspen stands showed decreased productivity in response to simulated low soil water contents near the end of the 1994 growing season. Compared with the aspen stand, the jack pine stand appeared better adapted to conserve soil water through lower daily evapotranspiration losses but also exhibited a nar-rower margin between daily net photosynthesis and respira-tion. Stands subjected to water stress during the growing season may exist on the edge between being annual sources or sinks for atmospheric carbon.
Keywords: BIOME--BGC, boreal forest, carbon balance, eco-system modeling, net primary production.
Introduction
The boreal forest covers a broad circumpolar band across the Eurasian and North American continents and represents ap-proximately 11% of the Earth’s total land area (Bonan and Shugart 1989). Global climate simulation studies show that the boreal forest region should experience significant warming and drying in response to increases in atmospheric CO2
con-centration and other greenhouse gases (Manabe and Stouffer 1980, Houghton et al. 1990, Monserud et al. 1993). This response is of major concern because the boreal forest region is thought to contain 16--24% of the world’s soil carbon (Gates 1993). Significant warming in this region may result in fairly rapid, large-scale displacement and redistribution of boreal forests, enhanced release of CO2 to the atmosphere and
inten-sification of global warming (Emanuel et al. 1985, Pastor and Post 1988, Neilson and Marks 1994).
A critical goal of the BOREAS project is to integrate point measurements across multiple spatial and temporal scales us-ing process level models of the boreal forest water, energy and biogeochemical cycles (BOREAS Science Steering Commit-tee 1990). BIOME--BGC is a general ecosystem process model designed to simulate daily biogeochemical and hydrologic processes from stand to global scales (Running and Hunt 1993). Our goal was to utilize BIOME--BGC logic to synthe-size field measurements and establish linkages between meas-ured data at various spatial and temporal scales. Specifically, we used BIOME--BGC to simulate daily and annual carbon budgets of several boreal forest stands and compare net carbon flux simulations with results derived from tower eddy flux and biomass measurement data. We also investigated climate and stand characteristics that control simulated carbon fluxes.
Experimental design
BIOME--BGC
BIOME--BGC simulates biogeochemical and hydrologic proc-esses across multiple biomes based on the logic that differ-ences in process rates among biomes are primarily a function of climate and general life-form characteristics. The carbon balance portion of BIOME--BGC utilizes daily meteorological
Simulating forest productivity and surface--atmosphere carbon
exchange in the BOREAS study region
JOHN S. KIMBALL, PETER E. THORNTON, MIKE A. WHITE and STEVEN W. RUNNING
School of Forestry/NTSG, University of Montana, Missoula, MT 59812, USA
Received September 12, 1996
data in conjunction with general stand and soil information to predict net photosynthesis, growth, maintenance and het-erotrophic respiration at a daily time-step. BIOME--BGC is general in the sense that the surface is represented by singular, homogeneous canopy and soil layers. The model is similar in scope and logic to the FOREST--BGC model described by Running and Coughlan (1988), except that site and vegetation components have been determined and tested for multiple biomes, including coniferous and deciduous forests, grassland, shrub-land and alpine cover types (Running and Hunt 1993, Cairns and Mananson 1996, Kremer and Running 1996). The boreal forest represents a unique environment characterized by flat terrain and a short growing season. Measurements from other BOREAS investigators have shown large sensible heat fluxes during the growing season resulting from low solar albedos and low evapotranspiration rates for coniferous stands (Sellers et al. 1995). This investigation constitutes our initial effort to test and improve BIOME--BGC logic at the stand level in order to improve model representation of the boreal forest biome in regional applications. Because BIOME--BGC logic has been described in detail by Running and Coughlan (1988) and Running and Hunt (1993), we present here only a sum-mary of the important components of BIOME--BGC relating to the prediction of daily carbon allocation and exchange.
Gross primary production (GPP) represents the total gain of carbon to the system by net photosynthesis and is defined as the daily sum of gross photosynthesis and daily foliar respira-tion (Rdl). The current representation of photosynthesis differs
significantly from previously published descriptions of the BGC family of models. The current implementation of photo-synthetic biochemistry is closely related to the original BI-OME--BGC logic in that it is based on the Farquhar biochemical model, but the resulting set of equations is some-what different because of differences in the logical constraints applied: we solve a quadratic system of equations by elimina-tion of intracellular CO2 concentration (Ci), instead of
specify-ing Ci as an initial condition. Other differences include a more
detailed dependence of the kinetic parameters on temperature (Woodrow and Berry 1988), and a simplifying assumption that empirically relates the maximum rate of electron transport to maximum carboxylation velocity (Wullschleger 1993).
Photosynthesis is regulated by canopy conductance to CO2,
leaf maintenance respiration and daily meteorological condi-tions including air pressure, air temperature and photosyntheti-cally active photon flux density (PPFD). Canopy conductance to CO2 is calculated as a proportion (62.5%) of canopy
conduc-tance to water vapor (gc). Maximum canopy conductance to
water vapor (gc,max) defines the upper boundary of the
photo-synthetic rate and is determined by LAI and prescribed leaf-scale boundary layer, cuticular and maximum stomatal conductances to water vapor; gc is reduced when air
tempera-ture, vapor pressure deficit, PPFD, or soil water potential deviates from prescribed optimal conditions (Jarvis and Mori-son 1981, Running and Coughlan 1988, Leuning 1990). BI-OME--BGC represents the canopy as a ‘‘big leaf’’ in that all units of leaf area in the canopy are represented by a single, canopy-averaged conductance. This assumption is generally
not valid at sub-daily (e.g., hourly) time-steps because the reduction in irradiance at lower vertical layers of the canopy reduces conductances at the bottom of the canopy. The big leaf assumption is strengthened, however, by the integrative effects of a daily time-step, and by the implicit assumption that allo-cation of leaf nitrogen between light harvesting and carbon fixing enzymes over depth in the canopy varies in response to the canopy light environment, allowing an optimized use of intercepted radiation (Evans 1989).
Total respiration from the system (Rtot) is estimated on a
daily basis as the sum of the maintenance (Rm), heterotrophic
(Rh) and growth (Rg) respiration components. Maintenance
respiration represents the total loss of carbon due to day and night leaf respiration (Rdl+Rnl), sapwood (Rsw), coarse root
(Rcr) and fine root (Rfr) respiration. Respiration is estimated as
a daily proportion of carbon in living tissue that is released as the result of cellular metabolic processes, excluding any growth processes. Maintenance respiration is calculated from mean daily air temperatures and prescribed leaf, root and sapwood carbon pools, using an exponentially increasing function of respiration with temperature as described by Amthor (1986). The magnitude of respiration response to temperature is governed by a prescribed rate defined at a reference temperature (i.e., 20 °C) and a proportional change in rate for a 10 °C change in temperature (Q10). In all cases
except leaf maintenance respiration, the daily average tem-perature is used in calculating a single value for the mass lost to maintenance respiration for the day. However, for leaves, Rdl and Rnl rates are calculated from estimated day and night
air temperatures, respectively, because Rdl is required to
deter-mine GPP. Daily growth respiration (Rg) was not determined
explicitly by the model, but was computed as a proportion (32%) of the daily difference between GPP and Rm (Penning
de Vries et al. 1974).
The heterotrophic respiration term in BIOME--BGC repre-sents the loss of carbon from the system resulting from soil microbial respiration. Daily Rh is estimated as a proportion of
prescribed soil and litter carbon pools. The proportion of litter carbon being respired on a daily basis is regulated by soil water potential and soil temperature, as described by Orchard and Cook (1983), Andren and Paustian (1987), and Running and Coughlan (1988). The proportion of soil carbon respired on a daily basis was estimated as 1% of the proportion of litter carbon respired (Cole and Rapp 1981, Fox and Van Cleve 1983).
Net primary production (NPP) represents the net accumula-tion of carbon by the stand and is determined as the difference between GPP and the sum of Rm and Rg. The net ecosystem
exchange of carbon (NEE) represents the net accumulation or loss of carbon by the entire soil--stand system and is deter-mined as the difference between GPP and Rtot. In this
investi-gation, positive fluxes denote a net uptake of carbon by the system and negative fluxes denote a net carbon loss.
(mountain microclimate simulator) logic as described by Run-ning et al. (1987). Average daily net solar radiation (Rn,s) was
estimated from a prescribed, constant albedo for vegetation. Average daily net solar radiation was attenuated through the vegetation canopy using Beer’s formulation and a prescribed extinction coefficient modulated by LAI to derive the amount of solar radiation transmitted through the canopy (Rs,t). The
amount of solar radiation absorbed by the canopy (Rs,a) was
estimated as the difference between Rn,s and Rs,t. The PPFD
was estimated based on the assumption that photosynthetically active radiation represents approximately 50% of Rs,a
(Run-ning and Coughlan 1988).
Mean daily air temperature (Ta) was estimated as the average
of the measured daily maximum and minimum air tempera-tures. Minimum daily air temperature was assumed equal to mean daily dew point and was used with Ta to estimate mean
daily vapor pressure deficit (VPD). Mean daily soil tempera-tures within the prescribed effective soil depth (Tsoil) were
estimated based on an 11-day running average of Ta (Zheng
et al. 1993). Soil water potential (PSI) was estimated from soil water content, soil depth and texture information described by Cosby et al. (1984). The variables Ta, VPD, PPFD and PSI
were used to estimate gc and GPP, as described by Jarvis and
Morison (1981) and Farquhar and von Caemmerer (1982), respectively. Both Ta and Tsoil were used to estimate Rm, and
Tsoil and PSI were used to estimate Rh (Running and Coughlan
1988).
Study sites
The BOREAS study region consists of a 1 × 10⁶ km2 area covering portions of central Saskatchewan and Manitoba (Sell-ers et al. 1995). Within this region are two intensive study areas, each approximately 10,000 km2 in area. The Southern Study Area (SSA) is located near Prince Albert, Saskatchewan (53.2° N, 105.7° W), whereas the Northern Study Area (NSA) is located roughly 500 km to the northeast near Thompson, Manitoba (55.7° N, 97.8° W). The BOREAS study region consists of relatively flat to gently rolling terrain with mean elevations from 261 m in the NSA to 520 m in the SSA. Vegetation cover is predominantly coniferous with low species diversity and productivity relative to temperate forests. Under-story vegetation is composed of sparse shrubs with extensive moss and lichen ground cover. Temperature and solar radiation play a major role in controlling boreal forest productivity by limiting energy, water supply and nutrient availability to plants for much of the year. The growing season is generally re-stricted to the months between May and September when daily air temperatures rise above 0 °C.
Tower eddy flux and micro-meteorological measurement networks were established within selected forest stands con-sidered representative of the boreal forest region. Detailed descriptions of site characteristics and data collections are presented by Sellers et al. (1995), Black et al. (1996) and Baldocchi et al. (1996). Two tower sites were examined within the NSA representing young jack pine (NYJP) and old black spruce (NOBS) forest types. Three tower sites were examined
within the SSA consisting of old black spruce (SOBS), old jack pine (SOJP) and old aspen (SOAS) forest types.
The jack pine sites were 30--80% forest covered, with jack pine (Pinus banksiana Lamb.) ranging in ages from less than 15 years at the NYJP site to between 70 and 90 years at the SOJP site. Canopy heights ranged from 10--15 m at the SOJP site and from 4--5 m at the NYJP site. Understory vegetation was sparse, consisting predominantly of isolated groups of alder (Alnus crispa (Ait.) Pursch) with an extensive surface cover of lichens (Cladina spp.), bearberry (Arctostaphylos uva-ursi (L.) K. Spreng) and bog cranberry (Vaccinium vi-tisideae L.). Soils were coarse textured, sandy and well drained, and were classified as a degraded Eutric Brunisol/Or-thic Eutric Brunisol.
The SOBS and NOBS sites were 30--70% forest covered with mature stands of black spruce (Picea mariana (Mill.) BSP) from 60--80 years in age with tree heights ranging from 7--18 m. Soils consisted of poorly drained silt and clay pre-dominantly covered by a thick moss layer (Sphagnum spp., Pleurozium spp.).
The SOAS site was 30--60% forest covered with an exten-sive stand of mature aspen (Populus tremuloides Michx.), approximately 70 years old, with average tree heights of ap-proximately 21 m. The SOAS also had an extensive understory composed primarily of hazelnut (Corylus cornuta Marsh.), approximately 2 m in height, interspersed with alder and shrubs. Soils consisted of Orthic Gray Luvisol with a medium to moderately fine silty clay texture.
Measurements
During 1994, air temperature, solar radiation and precipitation were measured at approximately 15-min intervals at each study site (BOREAS Science Team 1995). Detailed descrip-tions of the methods and instruments used to obtain these data are provided by Sellers et al. (1995), Fan et al. (1995), Baldoc-chi et al. (1996) and Black et al. (1996). The 1994 meteorologi-cal records for each study site were incomplete because of instrument malfunction and other factors. Continuous mete-orological records for 1994 were obtained for each study site by temporally interpolating missing data or substituting data from adjacent sites. Daily maximum and minimum air tem-peratures, precipitation and solar radiation were then derived from the continuous data records for each site and used to generate model results.
Model simulations were compared with estimates of various components of daily and annual carbon budgets derived from CO2 flux and biomass measurements to determine whether
results were consistent. Model simulations of daily NEE were compared with daily carbon fluxes derived from above-canopy CO2 flux measurements collected over selected periods during
1994 by tower flux teams at each study site (BOREAS Science Team 1995). Canopy CO2 fluxes were measured by an
eddy-covariance flux method. The 24-h integrated CO2 fluxes were
derived from approximate, half-hourly integrated flux meas-urements and a model for night respiration based on soil and air temperature measurements to adjust for CO2 storage effects
obtained from the tower flux teams at each study site and converted to carbon fluxes.
Aboveground NPP estimates (NPPag) were derived from
BIOME--BGC simulations of the 1994 total NPP using above-to belowground NPP ratios reported in the literature for young and mature spruce, pine and aspen stands in boreal and cold temperate environments (Malkonen 1974, Paavilainen 1980, Gower et al. 1992, Wieder and Yavitt 1994). These results were compared with the 1994 NPPag estimates derived from annual
stem-wood radial increment cores and site specific allometric equations for the SOAS, SOBS, SOJP, and NOBS forest types (BOREAS Science Team 1995).
Model initialization
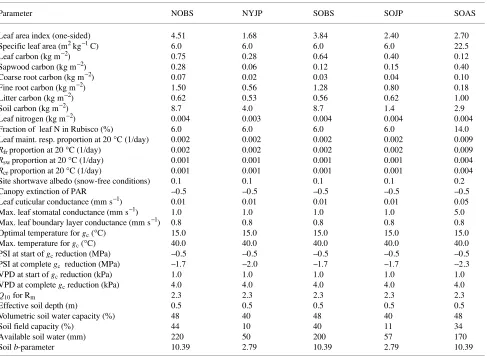
A list of critical parameters used to define soil and stand carbon characteristics at the five study sites is presented in Table 1. These parameters were obtained from both published literature for these genera and unpublished site observations from BOREAS researchers. When data were not available for these genera, parameters were obtained from related genera under similar environmental conditions.
Effective soil depth defines the vegetation rooting depth and is used with soil texture information to determine the maxi-mum amount of soil water available for evapotranspiration. Effective soil depth was set at 0.5 m following Haddeland and Lettenmaier (1995) and Sellers et al. (1995). Soil volumetric water capacity, field capacity and b-parameter values were derived from measurements collected at the sites during 1994 by Cuenca et al. (1997) and values reported in the literature for representative soil types (Cosby et al. 1984).
Mean daily vegetation solar albedos for snow-free condi-tions were estimated from site observacondi-tions reported by Sellers et al. (1995), whereas the mean daily solar albedo for snow was set at 0.8 (Brutsaert 1988). Canopy extinction of solar radiation was set at --0.5 based on data for temperate deciduous and evergreen forests (Jarvis and Leverenz 1984, Hunt and Run-ning 1992).
Mean annual leaf area index values were derived from over-story LAI measurements conducted over approximately three periods during the 1994 growing season at each study site by Chen (1996). No attempt was made to configure the model to represent understory canopy contributions to daily carbon ex-change or seasonal ex-changes in LAI. Specific leaf area (SLA) and leaf nitrogen concentrations were estimated from plucked
Table 1. The BIOME--BGC physiological and soil parameters for the BOREAS study sites.
Parameter NOBS NYJP SOBS SOJP SOAS
Leaf area index (one-sided) 4.51 1.68 3.84 2.40 2.70 Specific leaf area (m2 kg−1 C) 6.0 6.0 6.0 6.0 22.5 Leaf carbon (kg m−2) 0.75 0.28 0.64 0.40 0.12 Sapwood carbon (kg m−2) 0.28 0.06 0.12 0.15 0.40 Coarse root carbon (kg m−2) 0.07 0.02 0.03 0.04 0.10 Fine root carbon (kg m−2) 1.50 0.56 1.28 0.80 0.18 Litter carbon (kg m−2) 0.62 0.53 0.56 0.62 1.00
Soil carbon (kg m−2) 8.7 4.0 8.7 1.4 2.9
Leaf nitrogen (kg m−2) 0.004 0.003 0.004 0.004 0.004 Fraction of leaf N in Rubisco (%) 6.0 6.0 6.0 6.0 14.0 Leaf maint. resp. proportion at 20 °C (1/day) 0.002 0.002 0.002 0.002 0.009
Rfr proportion at 20 °C (1/day) 0.002 0.002 0.002 0.002 0.009
Rsw proportion at 20 °C (1/day) 0.001 0.001 0.001 0.001 0.004
Rcr proportion at 20 °C (1/day) 0.001 0.001 0.001 0.001 0.004
Site shortwave albedo (snow-free conditions) 0.1 0.1 0.1 0.1 0.2 Canopy extinction of PAR --0.5 --0.5 --0.5 --0.5 --0.5 Leaf cuticular conductance (mm s−1) 0.01 0.01 0.01 0.01 0.05 Max. leaf stomatal conductance (mm s−1) 1.0 1.0 1.0 1.0 5.0 Max. leaf boundary layer conductance (mm s−1) 0.8 0.8 0.8 0.8 0.8 Optimal temperature for gc (°C) 15.0 15.0 15.0 15.0 15.0
Max. temperature for gc (°C) 40.0 40.0 40.0 40.0 40.0
PSI at start of gc reduction (MPa) --0.5 --0.5 --0.5 --0.5 --0.5
PSI at complete gc reduction (MPa) --1.7 --2.0 --1.7 --1.7 --2.3
VPD at start of gc reduction (kPa) 1.0 1.0 1.0 1.0 1.0
VPD at complete gc reduction (kPa) 4.0 4.0 4.0 4.0 4.0
Q10 for Rm 2.3 2.3 2.3 2.3 2.3
Effective soil depth (m) 0.5 0.5 0.5 0.5 0.5
Volumetric soil water capacity (%) 48 40 48 40 48
Soil field capacity (%) 44 10 40 11 34
Available soil water (mm) 220 50 200 57 170
needle and leaf measurements at the black spruce, jack pine and aspen sites (Dang et al. 1997). The amounts of leaf nitro-gen in Rubisco were taken from the literature for representative cover types (Field and Mooney 1986, Fan et al. 1995). Leaf carbon was derived from LAI and SLA information. Sapwood carbon was estimated from sapwood biomass measurements collected at the BOREAS study sites (BOREAS Science Team 1995), and estimates of the relative proportions of sapwood live cells (Waring and Schlesinger 1985). Coarse root carbon was estimated to be approximately 25% of sapwood carbon (Grier and Logan 1977, Grier et al. 1981).
The amount of carbon attributed to fine root biomass is highly variable depending on species type, stand age and nutrient availability. Processes governing the partitioning of carbon between root and foliar biomass are generally poorly understood. Observations have shown, however, that fine root biomass is generally greater than foliar biomass in nutrient-limited systems, which often occur in boreal and cold temper-ate forests, and may represent an adaptation to maximize nutrient uptake (Tetreault et al. 1978, Keyes and Grier 1981, Nadelhoffer et al. 1985). Soil carbon attributed to fine roots was estimated from 1.5 (SOAS) to 3.5 (SOJP) times the esti-mated foliar carbon based on observations from boreal and cold temperate coniferous and deciduous stands on nutrient poor sites (Linder and Axelsson 1982, Perala and Alban 1982, Comeau and Kimmins 1989, Gower et al. 1992). Soil litter and mineralized organic carbon pools within the prescribed soil depths were estimated from soil layer depth, bulk density and percent organic carbon measurements conducted at each of the study sites (BOREAS Science Team 1995).
Leaf, stem, coarse and fine root maintenance respiration coefficients reflect daily rates of carbon respired per unit of carbon in living tissue and were estimated from measured rates for coniferous and deciduous cover types (Vowinckel et al. 1975, Johnson-Flanagan and Owens 1986, Sprugel et al. 1995). Leaf cuticular, boundary layer and maximum stomatal conductances were obtained from Nobel (1991) and Waring and Schlesinger (1985). These parameters show a wide range of values reported in the literature, varying significantly with life-form, boundary layer thickness, drought and shading con-ditions. Values used for this investigation represent the lower end of the range reported in the literature, based on evidence that reduced nutrient availability in boreal regions causes re-ductions in carbon uptake and stomatal conductances (Shulze et al. 1994, Baldocchi and Vogel 1996). Temperature, VPD and PSI bounds on gc were estimated from values reported in the
literature for coniferous and deciduous stands (Vowinckel et al. 1975, Waring and Franklin 1979, Waring and Schlesinger 1985, Baldocchi and Vogel 1996).
The Q10 parameter quantifies the slope of the exponential
relationship between temperature and maintenance respira-tion. Values of Q10 show considerable variation in the literature
(e.g., 1.3--3.0), but center near a value of approximately 2.0 for most plants (Sprugel et al. 1995). A Q10 of 2.3 was used for all
sites based on observations by Ryan (1991) that the Q10 value
may be higher for woody plants than for herbaceous plants. A
value of 2.3 is generally consistent with Q10 values reported by
Baldocchi and Vogel (1996) for the jack pine stand in the SSA. BIOME--BGC was run over a two-year period at each study site. The model was initialized using AMS mesonet station meteorological data for 1989 from the Thompson airport (55.8° N, 97.9° W) for study sites in the NSA, and Prince Albert airport (53.2° N, 105.7° W) and Waskesiu Lake (53.9° N, 106.1° W) for study sites in the SSA (BOREAS Science Team 1995). All analyses of model results in the second year were made using the 1994 meteorological data.
Results and discussion
Meteorological characteristics
The 1994 daily meteorological data records for the study sites showed that the NSA was slightly colder than the SSA, with a mean annual air temperature of --1.6 °C (SD = 16) compared to 1.0 °C (SD = 15) within the SSA. The growing season was defined as the number of days with minimum daily air tem-peratures above 0 °C. The growing season occurred over a period of approximately 151 days in the NSA and 178 days in the SSA. Mean daily air temperatures during the growing season were similar between the NSA and SSA, averaging 11.7 °C (SD = 6.2). Mean daily vapor pressure deficits for the same period averaged approximately 0.6 kPa (SD = 0.34) in both regions. Annual precipitation for 1994 averaged 44.7 and 42.1 cm for sites in the NSA and SSA, respectively. The greater amount of annual precipitation in the NSA was the result of greater winter snowfall relative to the SSA; however, the SSA received approximately 36 cm of rainfall during the growing season, which was almost 10 cm greater than the NSA re-ceived.
BIOME--BGC simulations
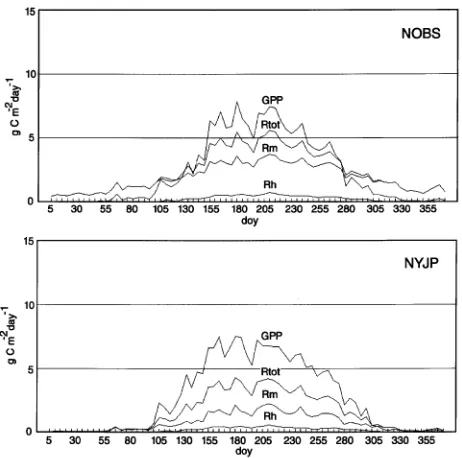
Mean daily plots of BIOME--BGC simulations of the 1994 carbon balance for sites within the SSA and NSA are presented in Figures 1 and 2, respectively. Black spruce and SOJP sites generally had low rates of GPP ranging from 0 to 7.6 and 0 to 5.8 g C m−2 day−1, respectively, over the year, with mean daily fluxes of 4.2 and 3.2 g C m−2 day−1, respectively, during the growing season. Total respiration rates at these sites were relatively large ranging from 0.3 to 5.3 g C m−2 day−1 over the year and averaging 3.4 (black spruce) and 2.8 (SOJP) g C m−2 day−1 during the growing season. Gross primary production exceeded Rtot over a 172-day period from April 9 to September
Simulated total respiration rates at the SOAS site were relatively large, ranging from 0 to 7.4 g C m−2 day−1 over the year and averaging 4.8 g C m−2 day−1 during the growing season. Gross primary production exceeded total respiration at the SOAS site over a 100-day period from May 31 to Septem-ber 9. The large respiration costs and short period of carbon uptake at the aspen site were generally compensated for by a large photosynthetic capacity, whereby GPP averaged 8.0 g C m−2 day−1 with maximum daily fluxes of 13.5 g C m−2 day−1 during the 1994 growing season. The resulting NEE ranged from --2.2 to 6.1 g C m−2 day−1 over the year and averaged 3.1 g C m−2 day−1 during the growing season.
Gross primary production at the NYJP site averaged 4.7 (SD = 2.1) g C m−2 day−1 during the growing season with maximum rates of approximately 7.5 g C m−2 day−1. Mean daily total respiration rates at this site ranged from 0 to 4.3 g C m−2 day−1 over the year and averaged 2.6 g C m−2 day−1 during the growing season. Respiration rates were lower in the NYJP stand than in the older conifer stands because of lower foliar, sapwood and root biomass (Table 1). Gross primary produc-tion exceeded total respiraproduc-tion over a 191-day period from April 9 to October 17 and resulted in mean daily NEE ranging from --0.2 to 3.5 g C m−2 day−1 over the year and averaging 2.0 g C m−2 day−1 during the growing season.
Heterotrophic respiration simulations represented a small component of Rtot at all of the sites, averaging approximately
0.2 (SD = 0.3) g C m−2 day−1 over the year, whereas Rm
generally averaged 49 (NYJP) 54 (SOAS), 76 (black spruce) and 77 (SOJP) percent of the total daily respiration rate during the growing season. Maintenance respiration also constituted a large proportion of simulated daily productivity at the SOBS, NOBS and SOJP sites, averaging 73, 88 and 94% of growing season GPP, respectively. The large proportion of mean daily GPP represented by Rm at the SOJP site was primarily a result
of reduced GPP in response to low soil water content at the end of the growing season. Compared with the SOJP site, Rm
constituted smaller proportions of daily productivity at the SOAS and NYJP sites, averaging 43 and 30% of GPP, respec-tively.
On an annual basis, simulated GPP ranged from 7.1 Mg C ha−1 year−1 at the SOJP site to 9.6 Mg C ha−1 year−1 at the NYJP site (Table 2). Because of lower maintenance respiration costs, estimated total respiration costs only constituted 57% of GPP at the NYJP site, whereas Rtot costs at the black spruce, SOAS
and SOJP sites were large, representing 79 to 99% of GPP. For 1994, simulated maintenance respiration costs ranged from 2.7 (NYJP) to 6.8 (NOBS) Mg C ha−1 year−1. Roots constituted more than half of the total maintenance respiration costs, followed by foliage and sapwood Rm components. Root
respiration also averaged more than twice annual foliar respi-ration costs. These results concur with annual autotrophic respiration estimates derived from chamber measurements of foliage, woody tissue, and fine roots at BOREAS aspen, black spruce and jack pine sites during 1994 (Ryan and Lavigne 1997).
The large simulated total respiration rates at the black spruce and SOJP sites resulted in a small (≤ 1.0 Mg C ha−1 year−1)
Figure 2. Five-day means of 1994 BIOME--BGC simulated gross primary productivity (GPP), maintenance (Rm), heterotrophic (Rh) and
total (Rtot) respiration for the NSA study sites.
Figure 1. Five-day means of 1994 BIOME--BGC simulated gross primary productivity (GPP), maintenance (Rm), heterotrophic (Rh) and
estimated net annual carbon accumulation at these sites for 1994. Simulated NEE was greater (1.8 Mg C ha−1 year−1) at the SOAS site than at the black spruce and SOJP sites because of lower annual maintenance respiration costs as a result of the shorter growing season of the deciduous canopy. Among the sites, the NYJP site showed the highest simulated NEE at 4.1 Mg C ha−1 year−1 primarily because of lower maintenance respiration costs.
Model comparison with measured results
BIOME--BGC simulations of daily NEE were compared with NEE derived from stand eddy flux measurements collected during 1994 (Table 3). For all sites, the sample periods for the measured data ranged from 81 to 229 days and averaged 133 (SD = 50.5) days. Sample periods were limited by sensor malfunctions and the high cost and difficulty of maintaining continuous measurements over long periods.
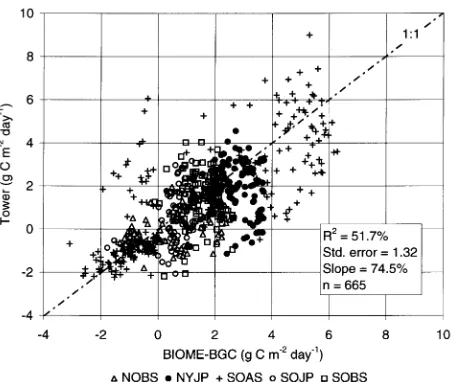
Mean daily differences between simulated and measured NEE ranged from 0.12 to 0.3 g C m−2 day−1. Root mean squared errors (RMSE) between tower flux measurements and BIOME--BGC results ranged from 0.99 (NOBS) to 1.69 (NYJP) g C m−2 day−1 and averaged 1.35 g C m−2 day−1 for all sites. Simulated NEE explained only 51.7% (SE = 1.32 g C m−2 day−1) of the variance in daily tower flux results for all sites (Figure 3). Simulated results also tended to overestimate tower flux results by approximately 25%.
Differences between BIOME--BGC and tower-flux meas-ured NEE results were probably a result of several factors. One factor is that NEE was simulated on a daily basis as a residual between two values of similar magnitude (Figures 1 and 2). Daily simulations of Rtot and GPP were generally within 1.5 g
C m−2 day−1 of each other and were each approximately 3.5 times the magnitude of simulated NEE. These results reflect the age-related decline in productivity observed in older stands (Ryan et al. 1997). The effects of relatively small errors in the estimation of daily GPP or Rtot appear to be compounded in
daily NEE simulations. For example, simulated changes of ± 1% in either GPP or Rtot resulted in corresponding changes
of 143% in mean daily NEE during the growing season at the NOBS site.
Another factor may be the way in which 24-h CO2 fluxes
were determined from tower eddy flux measurements. At night, the CO2 measurements were problematic because of
CO2 storage effects resulting from low wind conditions at the
BOREAS study sites (Baldocchi and Vogel 1996, Black et al. 1996). An empirical function between night CO2 flux and soil
temperature measurements at a 2 cm depth was used with daytime CO2 flux measurements to calculate 24-h CO2 fluxes
above the SOAS overstory. This function explained 67% of the variance in measured CO2 fluxes on nights with winds above
3.5 m s−1 (Black et al. 1996). Missing CO2 flux data were also
estimated as an empirical function of photosynthetic photon flux density measurements during the day and air temperature
Table 3. Summary of simulated and tower eddy flux daily carbon fluxes (g C m−2 day−1) for 1994 for the BOREAS study sites. RMSE = root mean squared errors.
Site BIOME--BGC Tower RMSE Sample period average average (Days)
SOJP 0.77 0.55 1.13 81 SOBS 1.60 1.48 1.33 107 SOAS 1.19 1.05 1.59 229 NOBS 0.28 --0.03 0.99 129 NYJP 2.76 1.88 1.69 119
Table 2. The BIOME--BGC predicted annual (1994) carbon budgets (Mg C ha−1 year−1).
SOAS SOBS SOJP NYJP NOBS
GPP1 8.7 9.1 7.1 9.6 8.8
Rdl 0.5 1.1 0.6 0.4 1.2
Rnl 0.2 0.7 0.3 0.2 0.8
Rsw 1.2 0.5 0.6 0.2 0.6
Rcr 0.4 0.1 0.1 0.1 0.2
Rfr 1.6 3.6 3.4 1.9 4.0
Rm 3.9 6.1 5.1 2.7 6.8
Rh 1.0 0.7 0.7 0.6 0.7
Rg 2.0 1.3 0.8 2.2 1.1
Rtot 6.9 8.1 6.6 5.5 8.7
NPPtot 2.8 1.7 1.1 4.7 0.8
NPPag 2.1 1.3 0.8 2.4 0.6
NEE 1.8 1.0 0.5 4.1 0.1
1
Abbreviations: GPP = gross primary production; Rdl = day foliar
respiration; Rnl = night foliar respiration; Rsw = sapwood respiration;
Rcr = coarse root respiration; Rfr = fine root respiration; Rm =
maintenance respiration(Rdl+Rnl+Rcr+Rfr); Rh = heterotrophic
respiration; Rg = growth respiration; Rtot = total respiration (Rm + Rg
+ Rh); NPPtot = total net primary production (GPP + Rm + Rg);
NPPag = aboveground NPP; NEE = net ecosystem carbon exchange
(GPP −Rtot).
at night above the SOJP overstory (Baldocchi and Vogel 1996). In BIOME--BGC, mean daily air temperatures are used to calculate foliar and sapwood respiration, and estimated soil temperatures are used to determine root and heterotrophic respiration; these variables are then used with GPP to calculate NEE. Both BIOME--BGC and tower flux results rely to a large extent on empirical assumptions to determine daily (24-h) NEE at the BOREAS study sites. There is generally consider-able scatter in temperature--respiration relationships within forests because of spatial heterogeneity in stand morphology and meteorological conditions, measurement error and possi-ble additional unknown controls on respiration (Wofsy et al. 1993, Fan et al. 1995, Black et al. 1996).
Site heterogeneity may be another factor responsible for differences between measured and model results. BIOME--BGC is a process-level model designed to be general enough to apply at regional to global scales. Several simplifying as-sumptions are used regarding stand and meteorological condi-tions to facilitate application at regional scales. A fundamental model assumption is that stand physiological conditions such as age, stand structure, LAI and carbon pools are spatially and temporally uniform on an annual basis. Soil conditions such as depth, density and water content are also assumed spatially uniform, with no lateral or subsurface drainage. Stand condi-tions at the study sites were both spatially and temporally diverse and were composed of different age types, biomass densities and species compositions (BOREAS Science Team 1995). Leaf area was represented in BIOME--BGC using a constant, seasonal average LAI based on overstory measure-ments conducted at the beginning, middle and end of the 1994 growing season at each study site. However, LAI measure-ments showed approximate seasonal variations of 12, 18 and 34% of mean values for black spruce, jack pine and aspen stands, respectively. Additionally, understory contributions to carbon fluxes were not represented in model simulations be-cause only overstory LAI was used to characterize canopy leaf area. Observations by Black et al. (1996), however, indicate that the hazelnut understory had a significant effect on sea-sonal carbon fluxes at the SOAS site.
BIOME--BGC and tower flux NEE results also reflected different time-scales of meteorological data which may have contributed to poor agreement between daily results. Daily tower flux measurements were derived from integrated half-hourly measurements and reflect physiological responses to sub-daily meteorological conditions; leaf stomata and canopy CO2 conductances, for example, are capable of responding to
environmental conditions at time-scales on the order of min-utes. BIOME--BGC, however, is driven by daily averaged radiation, temperature and VPD, and reflects an averaged gc
response.
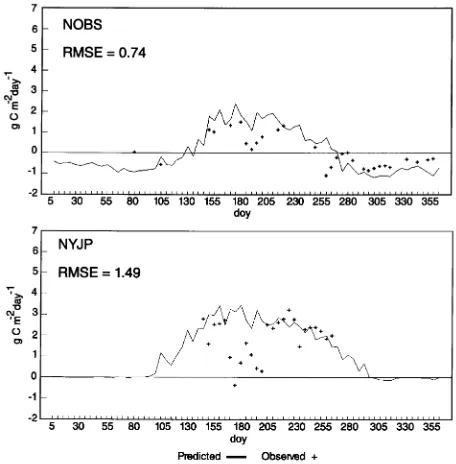
Five-day means of daily results were compared to evaluate seasonal trends in simulated and measured NEE. Plots of these results are presented for SSA and NSA sites in Figures 4 and 5, respectively. The RMS errors between 5-day means of meas-ured and modeled NEE ranged from 0.58 to 1.49 g C m−2 day−1. Model results also accounted for 66.1% of the variation
Figure 4. Five-day means of 1994 BIOME--BGC and tower flux NEE for the SSA study sites
in tower flux NEE (SE = 0.97 g C m−2 day−1) when 5-day means of daily results were compared.
At the SOAS site, model results showed large reductions in NEE during the period from approximately August 7 to Sep-tember 3 in response to simulated soil water stress which the tower-flux measurements did not detect. This period generally coincided with the observed onset of aspen and hazelnut can-opy senescence (Black et al. 1996). Simulated soil water con-tents during this period ranged as low as 25% and were within the range of measured conditions (Cuenca et al. 1997, Kimball et al. 1997). Tower eddy flux measurements above the aspen canopy showed maximum daily evapotranspiration rates from 3.5 to 4.0 mm day−1 during the 1994 growing season (Black et al. 1996); BIOME--BGC simulations of daily evapotranspi-ration were generally consistent with 1994 tower measure-ments at the SOAS site (Kimball et al. 1997). Tower measurements and simulations both showed that evapotranspi-ration rates above the aspen canopy were generally larger than at the BOREAS conifer tower sites during the 1994 growing season. This enhanced depletion of soil water in SOAS simu-lations led to water stress near the end of the growing season and a reduction in NEE. The magnitudes of the reductions in BIOME--BGC and tower NEE differed and may reflect a greater volume of water available to the aspen stand than simulations show, possibly through lateral transport of water from adjacent soil layers or deeper rooting depths. Simulations using effective soil depths up to 1 m (i.e., maximum amount of available soil water = 340 mm), however, still showed drought-related reductions in NEE near the end of the 1994 growing season.
At the SOJP site, BIOME--BGC NEE simulations also showed reductions over two periods in response to water stress. These periods occurred from approximately August 23 to September 5 and from September 13 to October 3. Simu-lated soil water contents during these periods averaged ap-proximately 4% and were also within the ranges of measured conditions (Cuenca et al. 1997, Kimball et al. 1997). Tower flux NEE data were not available at the end of September for comparison. However, Baldocchi and Vogel (1996) concluded that low soil water contents severely limited evapotranspira-tion rates from the SOJP stand and it is likely that CO2 fluxes
were similarly affected because of the strong linkage between photosynthesis and stomatal conductance (Collatz et al. 1991). At the NYJP site, differences between model and tower NEE results were particularly large from approximately June 13 to July 19 (Figure 5). The weather during this period was gener-ally cool and wet. BIOME--BGC simulations showed reduc-tions in both GPP and Rtot in response to reduced
photosynthetic rates and lower air temperatures (Figure 2). The net effect on NEE was therefore minimal. Tower NEE values during this period may have been more sensitive to the soil temperature data that were used to estimate CO2 fluxes at
night. Simulated daily soil temperatures were generally warmer than air temperatures during this period. Warmer soil temperatures may have resulted in enhanced night respiration rates and reduced tower-measured NEE values relative to BI-OME--BGC results.
Measured aboveground, overstory NPP at the tower sites and the ranges of NPPag at adjacent sites with similar stand
characteristics were approximately 2.1 ± 1.01, 1.3 ± 0.52, 0.8 ± 0.24 and 0.6 ± 0.62 Mg C ha−1 year−1 at the SOAS, SOBS, SOJP and NOBS sites, respectively, based on tree increment core data and allometric equations for 1994 (BOREAS Science Team 1995). Differences between measured and simulated NPPag ranged from 0.01 to 0.7 Mg C ha−1 year−1. No NPPag
estimates were made from biomass measurements at the NYJP site, though comparison with measurements made at a mature, high productivity jack pine site within the SSA was approxi-mately 1.3 Mg C ha−1 year−1 for 1994, yielding a difference of 1.0 Mg C ha−1 year−1 with model results.
Conclusions
Comparisons between BIOME--BGC simulations and field data were encouraging given the general nature of model parameterizations of stand morphology and our current, lim-ited understanding of boreal forest structure and processes. Model simulations accounted for approximately half of the variance in observed daily carbon fluxes; differences between tower and simulated NEE were attributed to several factors including problems measuring nighttime CO2 fluxes and
model assumptions of site homogeneity. Comparisons be-tween simulations and field data improved markedly, however, at coarser time-scales. Simulated NEE accounted for 66.1% of the variance in tower measurements when 5-day means of daily fluxes were compared. Simulations of annual NPPag were
also within the ranges of results derived from tree increment core and allometric equations, and annual simulations of the components of Rm were in general agreement with results
determined from chamber measurements of foliage, sapwood and roots. Replication of field measurements and confidence in simulations are likely to improve as we learn more about stand structure and the various processes controlling water and carbon fluxes within the boreal forest from BOREAS field campaigns.
Simulated results showed that all of the sites were small net carbon sinks for 1994. Younger stands were more productive than older stands, though most of these sites appear to be less productive than temperate forests (Grier and Logan 1977, Kinerson et al. 1977, Edwards et al. 1981, Waring and Schlesinger 1985). Our results also imply that these boreal forest stands currently do not have the capacities to be the large terrestrial carbon sinks that global atmospheric CO2
end of the growing season because of enhanced water loss through large daily evapotranspiration rates. Simulated SOJP site productivity was also adversely affected by low soil water conditions because of coarse, sandy soils at the site, though the SOJP canopy appears better able to conserve water through lower daily evaporative water loss. Stands subject to frequent water stress during the growing season may exist on the margin between being annual net sources or sinks for atmospheric carbon, especially older stands that exhibit low photosynthetic and high respiration rates.
Acknowledgments
This study was funded under Grants NAG-52297 and NAGW-4234. Much of the meteorological data used in this investigation were pro-vided by the Saskatchewan Research Council’s AMS mesonet data-base. We thank the BOREAS project and the following BOREAS Science Teams for providing the soil, eddy flux, LAI and additional meteorological and stand physiological data that made this paper possible: AFM-7, HYD-1, RSS-7, TE-6, TE-9; TF-1, TF-3, TF-5, TF-7, TF-10 and TGB-12.
References
Amthor, J.S. 1986. Evolution and applicability of a whole plant respi-ration model. J. Theor. Biol. 122:473--490.
Andren, O. and K. Paustian. 1987. Barley straw decomposition in the field: a comparison of models. Ecology 68:1190--1200.
Baldocchi, D.D. and C.A. Vogel. 1996. Energy and CO2 flux densities
above and below a temperate broad-leaved forest and a boreal pine forest. Tree Physiol. 16:5--16.
Baldocchi, D.D., C.A. Vogel and B. Hall. 1996. Seasonal variation of carbon dioxide exchange rates above and below a boreal jack pine forest. Agric. For. Meteorol. In press.
Black, T.A., G. den Hartog, H.H. Neumann, P.D. Blanken, P.C. Yang, C. Russell, Z. Nesic, X. Lee, S.G. Chen and R. Staebler. 1996. Annual cycles of water vapour and carbon dioxide fluxes in and above a boreal aspen forest. Global Change Biol. 2:219--229. Bonan, G.B. and H.H. Shugart. 1989. Environmental factors and
ecological processes in boreal forests. Annu. Rev. Ecol. Syst. 20:1--28.
BOREAS Science Steering Committee. 1990. Charting the boreal forest’s role in global change. Eos 72:33--40.
BOREAS Science Team. 1995. Boreal Atmosphere--Ecosystem Study, Experimental Plan. Version 3.1, NASA/GSFC, Greenbelt, MD. Brutsaert, W. 1988. Evaporation into the Atmosphere. D. Reidel,
Dordrecht, 297 p.
Cairns, F.M. and G.P. Mananson. 1996. Climate-treeline interactions at decadal time scales in Glacier National Park, Montana. Climate Change. In press.
Chen, J.M. 1996. Optically-based methods for measuring seasonal variation of leaf area index in boreal conifer stands. Agric. For. Meteorol. 80:135--163.
Ciais, P., P. Tans, M. Trolier, J. White and R. Francey. 1995. A large northern hemisphere terrestrial CO2 sink indicated by 13C/12C ratio
of atmospheric CO2. Science 269:1098--1102.
Cole, D.W. and M. Rapp. 1981. Elemental cycling in forest ecosys-tems. In Dynamic Principles of Forest Ecosystems. Ed. D.E. Reichle. Cambridge University Press, New York, pp 341--409. Collatz, G.J., J.T. Ball, C. Grivet and J.A. Berry. 1991. Regulation of
stomatal conductance and transpiration: a physiological model of canopy processes. Agric. For. Meteorol. 54:107--136.
Comeau, P.G. and J.P. Kimmins. 1989. Above- and belowground biomass and production of lodgepole pine on sites with differing soil moisture. Can. J. For. Res. 19:447--454.
Cosby, B.J., G.M. Hornberger, R.B. Clapp and T.R. Ginn. 1984. A statistical exploration of the relationships of soil moisture charac-teristics to the physical properties of soils. Water Resour. Res. 20:682--690.
Cuenca, R.H., D.E. Stangel and S.F. Kelly. 1997. BOREAS large-scale field experiment: soil water monitoring and soil hydraulic proper-ties. J. Geophys. Res. In press.
Dang, Q.-L., H.A. Margolis, M.Sy.M.R. Coyea, G.J. Collatz and C.L. Walthall. 1997. Profiles of PAR, nitrogen and photosynthetic capac-ity in the boreal forest: implications for scaling from leaf to canopy. J. Geophys. Res. In press.
Edwards, N.T., H.H. Shugart, S.B. McLaughlin, W.F. Harris and D.E. Reichle. 1981. Carbon metabolism in terrestrial ecosystems. In
InterBiol. Programme No. 23, Dynamic Properties of Forest Eco-systems. Ed. D.E. Reichle. Cambridge University Press, New York, pp 499--536.
Emanuel, W.R., H.H. Shugart and M.P. Stevenson. 1985. Climate change and the broad-scale distribution of terrestrial ecosystem complexes. Clim. Change 7:29--43.
Evans, J.R. 1989. Photosynthesis and nitrogen relationships in leaves of C3 plants. Oecologia 78:9--19.
Fan, S.M., M.L. Goulden, J.W. Munger, B.C. Daube, P.S. Bakwin, S.C. Wofsy, J.S. Amthor, D.R. Fitzjarrald, K.E. Moore and T.R. Moore. 1995. Environmental controls on the photosynthesis and respiration of a boreal lichen woodland: a growing season of whole-ecosystem exchange measurements by eddy correlation. Oecologia 102:443--452.
Farquhar, G.D. and S. von Caemmerer. 1982. Modelling of photosyn-thetic response to environmental conditions. In Encyclopedia of Plant Physiology, New Series, Vol. 12B, Physiological Plant Ecol-ogy II. Eds. O.L. Lange, P.S. Nobel, C.B. Osmond and H. Ziegler. Springer-Verlag, Berlin, Germany, pp 549--587.
Field, C. and H.A. Mooney. 1986. The photosynthesis--nitrogen rela-tionship in wild plants. In On the Economy of Plant Form and Function. Ed. T.J. Givnish. Cambridge University Press, Cam-bridge, U.K., pp 25--55.
Fox, J.F. and K. Van Cleve. 1983. Relationships between cellulose decomposition, Jenny’s k, forest-floor nitrogen, and soil tempera-ture in Alaskan taiga forests. Can. J. For. Res. 13:789--794. Gates, D.M. 1993. Plant--atmosphere relationships. Chapman and
Hall, New York, 92 p.
Gower, S.T., K.A. Vogt and C.C. Grier. 1992. Carbon dynamics of Rocky Mountain Douglas-fir: influence of water and nutrient avail-ability. Ecol. Monogr. 62:43--65.
Grier, C.C. and R.S. Logan. 1977. Old-growth Pseudotsuga menziesii
communities of a western oregon watershed: biomass distribution and production budgets. Ecol. Monogr. 47:373--400.
Grier, C.C., K.A. Vogt, M.R. Keyes and R.L. Edmonds. 1981. Biomass distribution and above- and belowground production in young and mature Abies amabilis zone ecosystems of the Washington Cas-cades. Can. J. For. Res. 11:155--157.
Haddeland, I. and D.P. Lettenmaier. 1995. Hydrologic modeling of boreal forest ecosystems. Water Resources Series Tech. Rep. 143, 123 p.
Houghton, J.T., G.J. Jenkins and J.J. Ephraums. 1990. Climate change: the IPCC scientific assessment. Cambridge University Press, Cam-bridge, 364 p.
Jarvis, P.G. and J.W. Leverenz. 1984. Productivity of temperate de-ciduous and evergreen forests. In Encyclopedia of Plant Physiology, New Series, Springer-Verlag, Berlin, 12D:233--280.
Jarvis, P.G. and J.I.L. Morison. 1981. Stomatal control of transpiration and photosynthesis. In Stomatal Physiology. Eds. P.G. Jarvis and T.A. Mansfield. Cambridge University Press, Cambridge, pp 247--279.
Johnson-Flanagan, A.M. and J.N. Owens. 1986. Root respiration in white spruce (Picea glauca [Moench] Voss) seedlings in relation to morphology and environment. Plant Physiol. 81:21--25.
Keyes, M.R. and C.C. Grier. 1981. Above- and belowground net production in 40-year-old Douglas-fir stands on high and low pro-ductivity sites. Can. J. For. Res. 11:599--605.
Kimball, J.S., M.A. White and S.W. Running. 1997. BIOME--BGC simulations of stand hydrologic processes for BOREAS. J. Geo-phys. Res. In press.
Kinerson, R.S., C.W. Ralston and C.G. Wells. 1977. Carbon cycling in a loblolly pine plantation. Oecologia 29:1--10.
Kremer, R.G. and S.W. Running. 1996. Simulating seasonal soil water balance in contrasting semi-arid vegetation communities. Ecol. Model. 84:151--162.
Leuning, R. 1990. Modeling stomatal behavior and photosynthesis of
Eucalyptusgrandis. Aust. J. Plant Physiol. 17:159--175.
Linder, S. and B. Axelsson. 1982. Changes in carbon uptake and allocation patterns as a result of irrigation and fertilization in a young Pinus sylvestris stand. In Carbon Uptake and Allocation: Key to Management of Subalpine Forest Ecosystems. Ed. R.H. Waring. International Union Forest Research Organization Workshop, For-est Research Laboratory, Oregon State University, Corvallis, OR, pp 38--44.
Malkonen, E. 1974. Annual primary production and nutrient cycle in some Scots pine stands. Comm. Inst. For. Fenn., Helsinki, No. 84. Manabe, S. and R.J. Stouffer. 1980. Sensitivity of a global climate
model to an increase of CO2 concentration in the atmosphere.
J. Geophys. Res. 85:5529--5554.
Monserud, R.A., N.M. Tchebakova and R. Leemans. 1993. Global vegetation changes predicted by the modified Budyko model. Clim. Change 25:59--83.
Nadelhoffer, K.J., J.D. Aber and J.M. Melillo. 1985. Fine root produc-tion in relaproduc-tion to total net primary producproduc-tion along a nitrogen mineralization gradient in temperate forests: a new hypothesis. Ecology 66:1377--1390.
Neilson, R.P. and D. Marks. 1994. A global perspective of regional vegetation and hydrologic sensitivities from climatic change. J. Veg. Sci. 5:715--730.
Nobel, P.S. 1991. Physiochemical and environmental plant physiol-ogy. Academic Press, New York, NY, 635 p.
Orchard, V.A. and F.J. Cook. 1983. Relationship between soil respira-tion and soil moisture. Soil Biol. Biochem. 15:447--453.
Paavilainen, E. 1980. Effect of fertilization on plant biomass and nutrient cycle on a drained dwarf shrub pine swamp. Comm. Inst. For. Fenn., Helsinki, No. 98.
Pastor, J. and W.M. Post. 1988. Response of northern forests to CO2-induced climate change. Nature 334:55--58.
Penning de Vries, F.W.T., A. Brunsting and H.H. Van Laar. 1974. Products, requirements and efficiency of biosynthesis: A quantita-tive approach. J. Theor. Biol. 45:339--377.
Perala, D.A. and D.H. Alban. 1982. Biomass, nutrient distribution and litterfall in Populus, Pinus and Picea stands on two different soils in Minnesota. Plant Soil 64:177--192.
Running, S.W. and J.C. Coughlan. 1988. A general model of forest ecosystem processes for regional applications, I. Hydrologic bal-ance, canopy gas exchange and primary production processes. Ecol. Model. 42:125--154.
Running, S.W. and R.E. Hunt. 1993. Generalization of a forest ecosys-tem process model for other biomes, BIOME--BGC, and an appli-cation for global-scale models. In Scaling Physiologic Processes: Leaf to Globe. Eds. J.R. Ehleringer and C.B. Field. Academic Press, San Diego, CA, pp 141--158.
Running, S.W., R.R. Nemani and R.D. Hungerford. 1987. Extrapola-tion of synoptic meteorological data in mountainous terrain and its use for simulating forest evapotranspiration and photosynthesis. Can. J. For. Res. 17:472--483.
Ryan, M.G. 1991. The effect of climate change on plant respiration. Ecol. Appl. 1:157--167.
Ryan, M.G., D. Binkley and J.H. Fownes. 1997. Age-related decline in forest productivity: pattern and process. Adv. Ecol. Res. 27:214--261. Ryan, M.G. and M.B. Lavigne. 1997. Annual carbon cost of autotro-phic respiration in boreal forest ecosystems in relation to species and climate. J. Geophys. Res. In press.
Sellers, P., F. Hall, H. Margolis, B. Kelly, D. Baldocchi, G. den Hartog, J. Cihlar, M.G. Ryan, B. Goodison, P. Crill, K.J. Ranson, D. Letten-maier and D.E. Wickland. 1995. The boreal ecosystem--atmosphere study (BOREAS): an overview and early results from the 1994 field year. Bull. Am. Meteorol. Soc. 76:1549--1577.
Schulze, E.-D., F.M. Kelliher, C. Korner, J. Lloyd and R. Leuning. 1994. Relationships between maximum stomatal conductance, eco-system surface conductance, carbon assimilation and plant nitrogen nutrition: a global exercise. Annu. Rev. Ecol. Syst. 25:629--660. Sprugel, D.G., M.G. Ryan, J.R. Brooks, K.A. Vogt and T.A. Martin.
1995. Respiration from the organ level to the stand. In Resource Physiology of Conifers, Acquisition, Allocation and Utilization. Eds. W.K. Smith and T.M. Hinckley. Academic Press, San Diego, CA, pp 255--299.
Tans, P.P., I.Y. Fung and T. Takahashi. 1990. Observational constraints on the global atmospheric CO2 budget. Science 247:1431--1438.
Tetreault, J.P., B. Bernier and J.A. Fortin. 1978. Nitrogen fertilization and mycorrhizae of balsam fir seedlings in natural stands. Nat. Can. 105:461--466.
Vowinckel, T., W.C. Oechel and W.G. Boll. 1975. The effect of climate on the photosynthesis of Picea mariana at the subarctic tree line. 1. Field measurements. Can. J. Bot. 53:604--620.
Waring, R.H. and J.F. Franklin. 1979. The evergreen coniferous forests of the Pacific Northwest. Science 204:1380--1386.
Waring, R.H. and W.H. Schlesinger. 1985. Forest ecosystems concepts and management. Academic Press, San Diego, CA, 340 p. Wieder, R.K. and J.B. Yavitt. 1994. Peatlands and global climate
change: insights from comparative studies of sites situated along a latitudinal gradient. Wetlands 14:229--238.
Wofsy, S.C., M.L. Goulden, J.W. Munger, S.M. Fan, P.S. Bakwin, B.C. Daube, S.L. Bassow and F.A. Bazzaz. 1993. Net exchange of CO2
in a mid-latitude forest. Science 260:1314--1317.
Woodrow, I.E. and J.A. Berry. 1988. Enzymatic regulation of photo-synthetic CO2 fixation in C3 plants. Annu. Rev. Plant Physiol. Plant
Mol. Biol. 39:533--594.
Wullschleger, S.D. 1993. Biochemical limitations to carbon assimila-tion in C3 plants----a retrospective analysis of the A/Ci curves from
109 species. J. Exp. Bot. 44:907--920.