Summary To detect seasonal and long-term differences in growth and photosynthesis of loblolly pine (Pinus taeda L.) exposed to elevated CO2 under ambient conditions of precipi-tation, light, temperature and nutrient availability, seedlings were planted in soil representative of an early, abandoned agricultural field and maintained for 19 months in the field either in open-top chambers providing one of three atmos-pheric CO2 partial pressures (ambient, ambient +15 Pa, and ambient +30 Pa) or in unchambered control plots. An early and positive response to elevated CO2 substantially increased total plant biomass. Peak differences in relative biomass enhance-ment occurred after 11 months of CO2 treatment when biomass of plants grown at +15 and +30 Pa CO2 was 111 and 233% greater, respectively, than that of plants grown at ambient CO2. After 19 months, there was no significant difference in biomass between +15 Pa CO2-treated plants and ambient CO2-treated plants, whereas biomass of +30 Pa CO2-treated plants was 111% greater than that of ambient CO2-treated plants. En-hanced rates of leaf-level photosynthesis were maintained in plants in the elevated CO2 treatments throughout the 19-month exposure period despite reductions in both leaf N concentration and ribulose-1,5-bisphosphate carboxylase/oxygenase (Ru-bisco) activity during the first 11 months of CO2 exposure. Reductions in Rubisco activity indicated photosynthetic ad-justment to elevated CO2, but Rubisco-mediated control of photosynthesis was small. Seasonal shifts in sink strength affected photosynthetic rates, greatly magnifying the positive effects of elevated CO2 on photosynthesis during periods of rapid plant growth. Greater carbon assimilation by the whole plant accelerated plant development and thereby stimulated new sinks for carbon through increased plant biomass, secon-dary branching and new leaf production. We conclude that elevated CO2 will enhance photosynthesis and biomass accu-mulation in loblolly pine seedlings under high nutrient condi-tions; however, reductions over time in the relative biomass response of plants to elevated CO2 complicate predictions of the eventual magnitude of carbon storage in this species under future CO2 conditions.
Keywords: biomass, carbon assimilation, carbon dioxide en-richment, leaf N concentration, Rubisco.
Introduction
Forest trees account for 65--70% of terrestrial net primary production (Woodwell et al. 1978) and approximately 70% of terrestrial atmospheric carbon fixation (Waring and Schlesin-ger 1985). Trees are a substantial sink for CO2, despite a reduction in the global forested area as a result of tropical deforestation (Hall and Uhlig 1991), and tree response to rapidly increasing atmospheric CO2 may ultimately affect the rate of change in CO2 partial pressure in the atmosphere (Har-mon et al. 1990, Vitousek 1991). Thus, we need to determine the long-term effects of elevated CO2 on growth and photosyn-thesis in forest trees both to predict future global carbon budgets accurately and to manage forests for silviculture and conservation.
Under nonlimiting resource conditions, growth of tree seed-lings exposed to elevated CO2 is generally enhanced as a result of increased carbon fixation; however, the enhancement is often reduced when resources are limiting (see reviews by Eamus and Jarvis 1989, Musselman and Fox 1991, Mousseau and Saugier 1992, Ceulemans and Mousseau 1994). In short-term (< 6 months) studies of elevated CO2 and varying re-source availability, whole-plant biomass increased 38% for conifers (12 species) and 63% for deciduous trees (52 species) with increases in photosynthesis of 40% for conifers and 61% for deciduous trees (Ceulemans and Mousseau 1994). Short-term studies of loblolly pine (Pinus taeda L.) seedlings grown in greenhouses under nonlimiting nutrient conditions and ex-posed to twice ambient CO2 showed either no change in biomass (Tolley and Strain 1984a, 1984b) or approximately a 40% increase in biomass compared to plants grown in ambient CO2 (Sionit et al. 1985, Griffin et al. 1993); nutrient limitation significantly reduced the growth response to elevated CO2 (Griffin et al. 1993). Photosynthetic capacity of loblolly pine seedlings exposed to elevated CO2 was enhanced in plants provided nonlimiting water and nutrients, but there was no enhancement of photosynthesis in response to CO2 enrichment under limiting nutrient conditions (Thomas et al. 1994, Lewis et al. 1994).
Enhancement of photosynthetic capacity at elevated CO2 often decreases with time (Gunderson and Wullschleger 1994, Sage 1994), thereby potentially limiting the availability of carbon for growth. Reductions in photosynthetic capacity and
Growth and photosynthesis of loblolly pine (
Pinus taeda
) after
exposure to elevated CO
2
for 19 months in the field
D. T. TISSUE, R. B. THOMAS and B. R. STRAIN
Duke University, Department of Botany, Durham, NC 27708-0340, USA
Received March 2, 1995
the activity and content of ribulose-1,5-bisphosphate (RuBP) carboxylase/oxygenase (Rubisco), are common indicators of photosynthetic ‘‘acclimation’’ (Long and Drake 1991, Sage 1994). Reduced photosynthetic capacity may be the result of a low sink demand imposed by genetic or environmental limita-tions (Stitt 1991) and is regulated by the flux of photosynthate from the chloroplast to sink regions of the plant (Herold 1980). Plant sink strength is an important factor controlling photosyn-thetic response to elevated CO2 (Thomas and Strain 1991).
There have been few long-term studies of the response of loblolly pine to elevated CO2 (Fetcher et al. 1988, Tissue et al. 1993), and none have been conducted on plants grown in soil under field conditions. Loblolly pine is an early successional species that colonizes old fields, particularly following agri-cultural abandonment, and may grow on a wide variety of soils of differing fertility (Pritchett and Smith 1975). Nutrient avail-ability is often greatest in the early stages of colonization and declines thereafter (Allen et al. 1990). In this study, loblolly pine seedlings were planted in the field in soil representative of an early abandoned agricultural field and maintained in ambient atmospheric CO2, ambient +15 Pa CO2 (+15 Pa CO2), or ambient +30 Pa CO2 (+30 Pa CO2) partial pressures for 19 months. The objective of the study was to detect seasonal and long-term differences in growth and photosynthesis of loblolly pine exposed to elevated CO2 under ambient conditions of precipitation, light, temperature and nutrient availability. Changes in leaf-level physiology were determined by measur-ing photosynthesis and Rubisco content and activity every 2 months.
Methods
Growth conditions
Loblolly pine seeds were germinated in April 1992, and seed-lings were grown for 1 month in one of three greenhouses in the Duke University Phytotron with CO2 partial pressures that were automatically monitored and controlled at ambient CO2, +15 or +30 Pa CO2 (Hellmers and Giles 1979). After germina-tion, seedlings were inoculated with Pisolithus tinctorius (Pers.) Coker and Couch (Mycorr Tech Inc., Pittsburgh, PA), an ectomycorrhizal fungus commonly associated with loblolly pine (Marx 1977). In May 1992, 24 seedlings were trans-planted to each 3 m diameter × 3 m tall cylindrical open-top chamber (Rogers et al. 1983) in Duke Forest. There were three chambers for each of the three CO2 treatments and three unchambered plots (NC). The native soil in each plot was excavated to 1 m depth and replaced with a 1/1/1 (v/v) mix of native clay soil, topsoil and sand mixture representative of soil in a recently abandoned agricultural field. Soil mineral N concentrations at the beginning of the experiment were 8.44 ± 3.55 µg N g−1 soil (mean ± SE, n = 12), with 80% of N as NO
3 and 20% as NH4 (Reinhard and Richter, unpublished data). The CO2 treatments were applied 24 h per day for the entire experimental period. Mean CO2 partial pressures (± SE com-puted from monthly means, n = 18) during periods of photo-synthetic activity (0800--1700 h) were: NC (36.6 ± 0.2 Pa), ambient CO2 (36.6 ± 0.2 Pa), +15 Pa CO2 (51.6 ± 0.2 Pa) and
+30 Pa CO2 (66.6 ± 0.3 Pa). Tree seedlings were grown under ambient conditions of precipitation, light, temperature and nutrient availability. Air temperature was measured at 1 m above ground in the center of the plots with shielded thermo-couples (one per plot) and photosynthetic photon flux density (PPFD) was measured with one quantum sensor (Li-Cor Inc., Lincoln, NE) placed horizontally at 2.5 m in an open site. In addition to removing trees during harvest periods, an addi-tional four trees were removed from each plot in July 1993 to thin the stands.
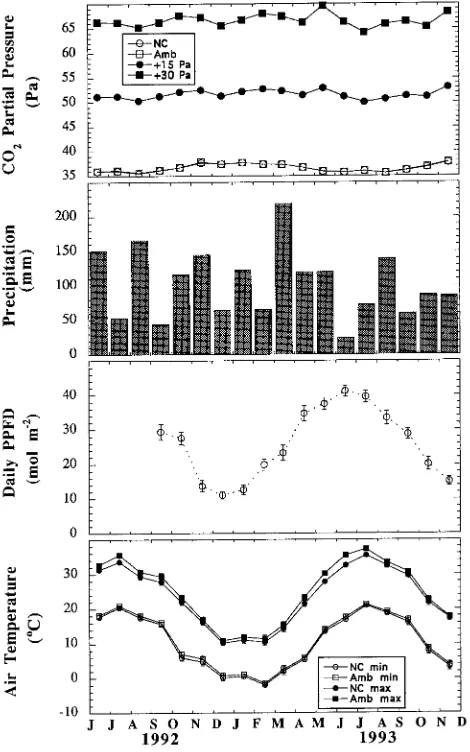
Mean monthly CO2 partial pressures fluctuated on a sea-sonal basis up to 4% from the yearly mean within a CO2 treatment with lower values occurring in the summer during periods of high photosynthetic activity (Figure 1). Precipita-tion occurred year-round with an unusually dry period in June
Figure 1. Environmental conditions in the open-top chamber and unchambered (NC) sites include CO2 partial pressure calculated as a
monthly mean based on daily CO2 averages from 0800--1700 h,
monthly precipitation, mean total daily light in an NC site, and mini-mum and maximini-mum daily air temperatures in chambered (ambient CO2) and NC sites. Values are presented as means ± SE for 28--31
observations per month. Note for the CO2 graph that NC data are
hidden by the ambient CO2 data and SEs are not larger than the
1993. Daily PPFD in an unchambered plot was nearly four times greater in the summer than in the winter; PPFD was not measured in chambered plots. Maximum air temperature was always higher in chambered plots than in unchambered plots, but the difference was usually less than 1.5 °C (Figure 1). The difference was greatest in summer with the maximum differ-ence averaged over the month (2.9 °C) occurring in June 1993.
Growth measurements
Two plants from each chamber (six plants per CO2 treatment) were selected at random at each of five harvests for determina-tion of biomass accumuladetermina-tion and other growth parameters. Aboveground biomass was harvested and separated into need-les and stems. Because entire root systems could not be exca-vated without damaging the remaining trees, belowground biomass was estimated by removing 15.7 dm3 of soil with a cylindrical root corer (20 cm diameter × 50 cm deep). The root cores included all of the tap root and varying amounts of lateral roots. Complete excavation of an entire root system after 19 months growth (November 1993) indicated that the root core technique captured 40--50% of total root biomass, including the entire tap root (John King, unpublished data). A greater percentage of total root biomass was probably obtained by the root core technique when plants were smaller and the lateral root system was less extensive. Root data presented in this study represent actual recovered root biomass. Needles, stems and roots were oven dried at 70 °C for 2 weeks before biomass was determined. Biomass allocation between plant parts and root to shoot ratios (RSR) were determined at each harvest. Total needle surface area per plant was determined by measur-ing projected needle area with an LI-3100 leaf area meter (Li-Cor Inc.) and calculating needle surface area (Thomas et al. 1994). Leaf area ratio (LAR) was calculated as the ratio of leaf area to total plant biomass (Kvet et al. 1971). Instantane-ous relative growth rate (RGR: change in biomass per unit biomass per unit time) and net assimilation rate (NAR: change in biomass per unit leaf area per unit time) were estimated by the regression method of Hunt (1990) that allows 95% confi-dence intervals to be determined. Tree height and number of branches were measured during harvest periods, and the num-ber of leaf flushes was measured by monitoring leaf production nondestructively every 2 weeks. These parameters were used to assess changes in plant morphology and phenology caused by the elevated CO2 treatments.
Photosynthesis and Rubisco measurements
Photosynthesis was measured periodically on needles of cur-rent-year shoots of three plants in each chamber (nine plants per CO2 treatment) in each of the four CO2 treatments with an LI-6200 portable photosynthesis system (Li-Cor Inc.). All photosynthesis measurements were conducted on clear days in the open-top chambers under nearly saturating conditions of PPFD (at least 1000 µmol m−2 s−1; Edwards 1989) and ambient temperature. Photosynthesis was measured at the growth CO2 partial pressure of each plant and photosynthesis was ex-pressed on a needle surface area basis. Because photosynthetic rates of needles were measured under nearly optimal PPFD,
which most needles experience for only a short period during the day because of shading effects, these rates generally reflect the maximum photosynthetic rate of needles at growth CO2 partial pressure rather than ambient net photosynthesis.
In addition, photosynthesis and Rubisco were measured concurrently every 2 months on needles from three plants in each chamber (nine plants per CO2 treatment) in each of two CO2 treatments (ambient and +30 Pa CO2). Initial Rubisco activity and total (fully activated) Rubisco activity were deter-mined spectrophotometrically (Tissue et al. 1993). The activa-tion state of Rubisco was calculated as the ratio of initial activity to total activity. Rubisco content was determined by a 14C-carboxyarabinitol bisphosphate binding assay (Sharkey et al. 1986). Rubisco N was calculated from the amount of Rubisco protein assuming 16.67% of Rubisco is N (Ridley et al. 1967, Steer et al. 1968).
Needle properties
Specific leaf mass (SLM) was calculated as the ratio of needle dry weight to needle surface area. Chlorophyll content was determined by grinding needles in liquid N, extracting needles twice with 80% acetone, centrifuging for 1 min, and measuring absorbance of the supernatant at 646.6 and 663.6 nm (Porra et al. 1989). Nitrogen was determined on needles dried at 70 °C, ground in a Wiley mill, digested according to a micro-Kjeldahl technique, and measured with a Technicon Traacs 800 autoanalyzer (Lowther 1980). Soluble sugar and starch content of needles were determined as described by Tissue and Wright (1995). Total nonstructural carbohydrate (TNC) was calcu-lated as the sum of soluble sugar and starch.
Statistical analyses
Data were tested for normality and were natural log trans-formed where necessary to normalize variances among CO2 treatments. Main effects of CO2 on measured parameters were tested by analysis of variance (ANOVA) models with the random chamber block term nested within CO2 treatment (Steel and Torrie 1980). Scheffe tests were used for mean separation of the dependent variables due to planned compari-sons among CO2 treatments (Data Desk Inc., Ithaca, NY). Treatment effects were considered significant if P < 0.05. Values of RGR and NAR were considered significantly differ-ent if 95% confidence intervals, generated by the Hunt (1990) model, of compared values did not overlap.
Results
Growth
(Fig-ure 3). After 19 months of expos(Fig-ure to elevated CO2, biomass of +30 Pa CO2-treated plants was 111% greater than that of ambient CO2-treated plants (Figure 3), whereas there were no significant differences in biomass between +15 Pa CO2-treated and ambient CO2-treated plants (P =0.152) although +15 Pa CO2-treated plants were still, on average, 111 gDW larger than ambient CO2-treated plants (Figure 3). There were no signifi-cant effects of chamber on leaf, stem, root or total biomass during the five harvest periods (Table 1, Figure 2).
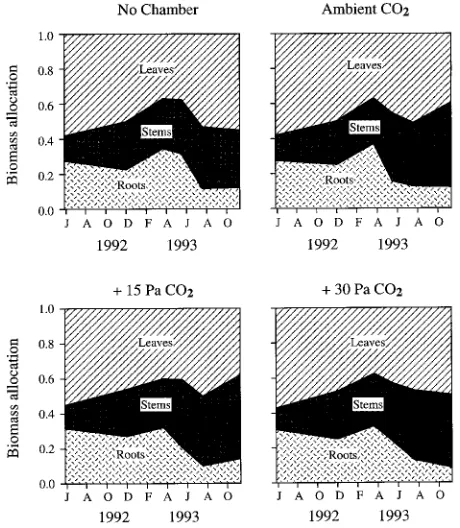
Biomass allocation between plant parts was similar for trees in all CO2 treatments at all harvests (Figure 4). In all CO2 treatments, the proportion of root biomass declined and stem biomass increased after 11 months. The RSR was greatest during the first 11 months and declined thereafter, but did not
Figure 2. Total biomass for plants in the four CO2 treatments at
different harvest periods. Values are means ± SE for individual plants in three chambers in each CO2 treatment.
Table 1. Biomass of loblolly pine at different harvest periods when grown at four CO2 conditions: no chamber (NC), ambient CO2 (Amb), ambient
plus 15 Pa CO2 (+15), and ambient plus 30 Pa CO2 (+30). Plants were exposed to elevated CO2 beginning April 1992. Duration of CO2 exposure
(months) is indicated below harvest dates. Values are means (standard errors) for individual plants in each of three chambers per CO2 treatment.
Different letters within a column and measurement indicate statistically different values at P < 0.05.
Measurement CO2 (Pa) 5/92 11/92 3/93 5/93 7/93 11/93
(1) (7) (11) (13) (15) (19)
Leaf biomass NC 0.036 (0.001) A 9 (2) A 13 (2) A 23 (4) A 79 (12) A 325 (76) A (gDW) Amb 0.036 (0.001) A 10 (1) A 10 (1) A 33 (6) A 88 (11) A 267 (64) A
+15 0.037 (0.001) A 17 (3) B 23 (3) B 48 (7) B 146 (20) B 298 (30) A +30 0.036 (0.001) A 21 (5) B 34 (7) B 80 (16) C 181 (22) B 703 (179) B Stem biomass NC 0.009 (0.002) A 5 (1) A 10 (2) A 19 (4) A 53 (7) A 195 (25) A (gDW) Amb 0.009 (0.002) A 5 (1) A 7 (1) A 28 (6) AB 63 (8) A 322 (76) A
+15 0.009 (0.003) A 10 (2) B 16 (2) B 46 (5) BC 118 (18) B 375 (34) AB +30 0.008 (0.001) A 12 (3) B 27 (6) C 62 (11) C 153 (20) B 592 (154) B Root biomass NC 0.017 (0.006) A 4 (1) A 12 (2) A 19 (7) AB 17 (2) A 70 (13) A (gDW) Amb 0.017 (0.006) A 5 (1) A 10 (1) A 11 (1) A 21 (3) A 80 (8) AB
+15 0.021 (0.008) A 10 (1) B 18 (1) B 24 (3) B 27 (1) B 108 (11) AB +30 0.019 (0.006) A 11 (2) B 29 (5) C 43 (9) C 50 (8) C 116 (23) B Root/shoot ratio NC 0.32 (0.05) A 0.35 (0.03) A 0.51 (0.02) A 0.51 (0.20) A 0.14 (0.01) A 0.15 (0.02) A
Amb 0.32 (0.05) A 0.38 (0.02) A 0.57 (0.03) A 0.19 (0.02) B 0.14 (0.01) A 0.16 (0.03) A +15 0.39 (0.07) A 0.38 (0.04) A 0.49 (0.07) A 0.26 (0.02) AB 0.11 (0.01) A 0.16 (0.01) A +30 0.40 (0.05) A 0.36 (0.03) A 0.49 (0.03) A 0.31 (0.05) AB 0.15 (0.01) A 0.10 (0.03) A Figure 3. The absolute difference in biomass (gDW) and the relative
differences (% change) in biomass, photosynthetic rate and Rubisco activity in plants grown and measured at elevated CO2 compared with
plants grown and measured at ambient CO2. Values are means for
differ among treatments except in May 1993 in the NC and ambient CO2-treated plants (Table 1). Reductions in RSR as-sociated with duration of CO2 exposure partly reflected a lower percentage of lateral roots recovered by the root core technique as plants became larger.
Both RGR and NAR were highest during the first 7 months in all CO2 treatments and were higher for plants in the elevated
CO2 treatments than for plants in the ambient CO2 treatment during the first 11 months and were generally lower or similar thereafter (Table 2). The LAR was similar for plants in all CO2 treatments within each harvest date, except for the harvest at 15 months (July 1993) when LAR was significantly higher in NC plants than in plants in the chamber treatments (Table 2). In all CO2 treatments, LAR declined as plants aged.
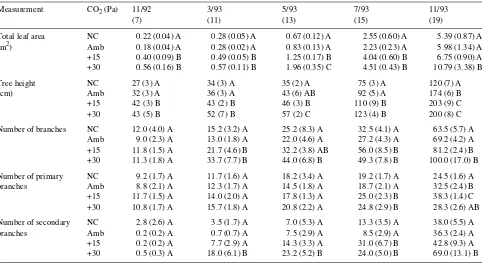
Total leaf area per plant was increased by elevated CO2 (P = 0.028), but differences between +15 Pa CO2-treated and ambi-ent CO2-treated plants disappeared after 19 months, at which time only +30 Pa CO2-treated plants had higher leaf areas than ambient CO2-treated plants (Table 3). Trees were taller when grown in elevated CO2 (P =0.047) compared with ambient CO2, although +15 Pa CO2-treated and +30 Pa CO2-treated plants were generally not significantly different from each other (Table 3). In response to elevated CO2, trees produced more secondary (P =0.012) and total branches (P =0.023), but not more primary branches (P =0.088); however, there were no significant differences in total number of branches between +15 Pa CO2-treated and +30 Pa CO2-treated trees (Table 3). Elevated CO2 increased the number of leaf flushes (P =0.035) after 203 days of treatment and this difference was maintained throughout the experiment (Figure 5). Ambient CO2-treated and NC plants had similar height, number of branches, total leaf area, and number of leaf flushes until the final harvest, when height (P =0.002) and number of primary branches (P = 0.042) were significantly greater in ambient CO2-treated plants than in NC plants (Table 3, Figure 5).
Photosynthesis and Rubisco
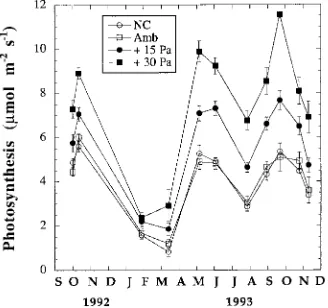
Plants grown in elevated CO2 had substantially higher photo-synthetic rates (P < 0.001) than plants grown in ambient CO2, with the greatest differences occurring during the active growth period (May--October, Figure 6). In general, +30 Pa CO2-treated plants had higher photosynthetic rates than +15 Pa CO-treated plants, and ambient CO2-treated and NC plants had
Figure 4. Biomass allocation between leaves, stems and roots for plants in the four CO2 treatments at different harvest periods. Values
are means for individual plants in three chambers in each CO2
treat-ment.
Table 2. Relative growth rate (RGR), net assimilation rate (NAR), and leaf area ratio (LAR) of loblolly pine at different harvest periods when grown at four CO2 conditions: no chamber (NC), ambient CO2 (Amb), ambient plus 15 Pa CO2 (+15), and ambient plus 30 Pa CO2 (+30). Duration
of CO2 exposure (months) is indicated below harvest dates. Values are means (standard errors for LAR, and 95% confidence intervals for RGR
and NAR) for individual plants in each of three chambers per CO2 treatment. Different letters within a column and measurement indicate
statistically different values at P < 0.05.
Measurement CO2 (Pa) 11/92 3/93 5/93 7/93 11/93
(7) (11) (13) (15) (19)
RGR NC 0.030 (0.001) A 0.003 (0.001) A 0.010 (0.003) A 0.015 (0.002) A 0.012 (0.001) A (g g−1 day−1) Amb 0.031 (0.001) A 0.003 (0.001) A 0.016 (0.002) B 0.014 (0.002) A 0.012 (0.001) A +15 0.034 (0.001) B 0.006 (0.001) B 0.013 (0.001) AB 0.014 (0.001) A 0.008 (0.002) B +30 0.035 (0.001) B 0.007 (0.001) B 0.013 (0.002) AB 0.012 (0.002) A 0.010 (0.001) AB NAR NC 2.92 (0.25) A 0.37 (0.05) A 1.14 (0.15) A 1.12 (0.10) A 0.90 (0.08) A (g m−2 day−1) Amb 2.97 (0.18) A 0.27 (0.08) A 1.94 (0.12) B 1.16 (0.12) A 1.14 (0.20) A
similar photosynthetic rates, indicating no chamber effect on photosynthesis.
When photosynthesis and Rubisco were measured concur-rently on plants grown in the ambient CO2 and +30 Pa CO2 treatments, photosynthesis was always higher in +30 Pa CO2 -treated plants, especially during periods of high light and temperature (Table 4, Figure 3). Rubisco activity was generally reduced in +30 Pa CO2-treated plants in the first year of CO2 treatment, but activities were similar to those of ambient CO2 plants thereafter (Table 4, Figure 3). Rubisco activation state (P =0.082) and Rubisco content (area basis, P =0.645) were not affected by elevated CO2 (Table 4). Elevated CO2 had no effect on Rubisco content expressed on a chlorophyll basis (P =0.218), used to estimate shifts in allocation between Rubisco and thylakoid components (Evans and Terashima 1987), or on Rubisco content expressed on an N basis (P =0.086), used to determine N allocation to Rubisco (Table 4).
Needle properties
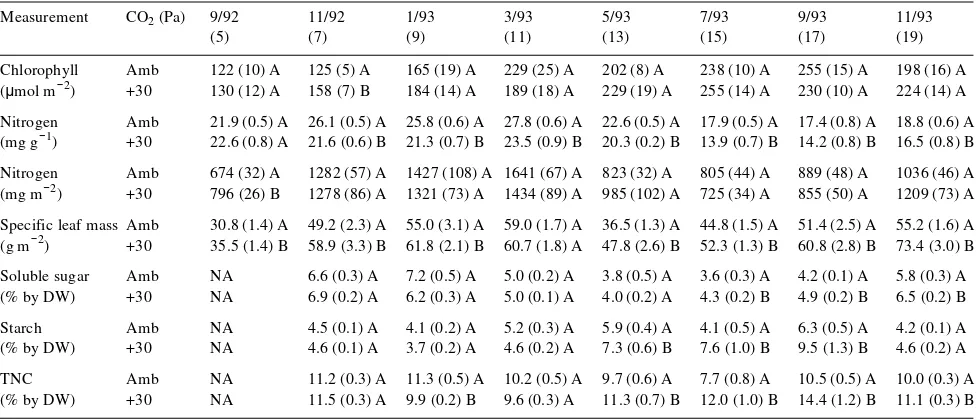
Chlorophyll content was unchanged by elevated CO2 (P = 0.428). Leaf N concentration (mg g−1) was reduced by elevated CO2 (P < 0.001), but leaf N content (mg m−2) was not signifi-cantly affected by elevated CO2 (P =0.839, Table 5). Reduced leaf N concentration in plants exposed to elevated CO2 may be a consequence of N dilution by greater starch (P =0.003) and TNC (P =0.002) concentrations in leaves resulting in leaves with greater SLM (P < 0.001). Soluble sugar (P =0.079) was not significantly affected by elevated CO2 (Table 5).
Discussion
Loblolly pine seedlings exhibited an early and positive biomass response to elevated CO2 that resulted in a rapid increase in total plant biomass. However, the relative biomass response peaked after 11 months of CO2 exposure, such that after 19 months there was no significant difference in biomass between +15 Pa CO2-treated and ambient CO2-treated plants. For +30 Pa CO2-treated plants, the relative enhancement of biomass compared with ambient CO2-treated plants declined from 233% at 11 months to 111% at 19 months. In studies with container-grown loblolly pine supplied with nonlimiting nutri-ents, the relative enhancement of biomass for plants in +30 Pa CO2 declined from 59% after 5 months of CO2 treatment (Thomas et al. 1994) to 33% after 17 months (Strain and Thomas 1992). Many studies on trees have demonstrated a large initial increase in biomass that was reduced after ex-tended exposure to CO2 (see Ceulemans and Mousseau 1994). However, some trees such as sour orange and Pinus eldarica L. attain maximal relative biomass enhancement after 16--18 months of elevated CO2 treatment and do not exhibit a sub-sequent reduction in the relative rate of growth (Idso and Kimball 1992, 1994). For loblolly pine, exposure to elevated CO2 increased plant biomass and subsequently increased carb-on storage. However, over time, reducticarb-ons in the relative biomass response of plants subjected to elevated CO2 compli-cate predictions of the eventual magnitude of carbon storage in this species.
Partitioning of biomass between plant parts was similar for
Table 3. Growth characteristics of loblolly pine at different harvest periods when grown at four CO2 conditions: no chamber (NC), ambient CO2
(Amb), ambient plus 15 Pa CO2 (+15), and ambient plus 30 Pa CO2 (+30). Duration of CO2 exposure (months) is indicated below harvest dates.
Values are means (standard errors) for individual plants in each of three chambers per CO2 treatment. Different letters within a column and
measurement indicate statistically different values at P < 0.05.
Measurement CO2 (Pa) 11/92 3/93 5/93 7/93 11/93
(7) (11) (13) (15) (19)
Total leaf area NC 0.22 (0.04) A 0.28 (0.05) A 0.67 (0.12) A 2.55 (0.60) A 5.39 (0.87) A (m2) Amb 0.18 (0.04) A 0.28 (0.02) A 0.83 (0.13) A 2.23 (0.23) A 5.98 (1.34) A +15 0.40 (0.09) B 0.49 (0.05) B 1.25 (0.17) B 4.04 (0.60) B 6.75 (0.90) A +30 0.56 (0.16) B 0.57 (0.11) B 1.96 (0.35) C 4.51 (0.43) B 10.79 (3.38) B Tree height NC 27 (3) A 34 (3) A 35 (2) A 75 (3) A 120 (7) A (cm) Amb 32 (3) A 36 (3) A 43 (6) AB 92 (5) A 174 (6) B +15 42 (3) B 43 (2) B 46 (3) B 110 (9) B 203 (9) C +30 43 (5) B 52 (7) B 57 (2) C 123 (4) B 200 (8) C Number of branches NC 12.0 (4.0) A 15.2 (3.2) A 25.2 (8.3) A 32.5 (4.1) A 63.5 (5.7) A
trees in all CO2 treatments regardless of differences in total biomass. Generally, plants grown in nutrient-poor soils and elevated CO2 allocate more carbon to belowground tissues than plants grown in ambient CO2, resulting in increased root mass and, in turn, increased uptake of nutrients (Norby et al.
1986, Bazzaz 1990, Rogers et al. 1992). The RSR of loblolly pine was not altered by the elevated CO2 treatments suggesting that investment of additional photosynthate into root growth for improved acquisition of nutrients is not necessary for elevated CO2-treated plants growing in nutrient-rich soil. Simi-lar results have been observed in Betula pendula Roth. (Pet-tersson et al. 1993) and six co-occurring trees in a northern temperate forest, including Pinus strobus L. (Bazzaz et al. 1990).
Differences in total plant biomass among CO2 treatments can generally be attributed to the effect of CO2 on NAR, which is an integrated value of whole-plant photosynthesis and respi-ration and reflects the efficiency with which leaves produce plant biomass. Higher RGR in elevated CO2-treated plants in the first 11 months and similar RGR in the last 8 months compared with ambient CO2-treated plants was a result of
Figure 6. Needle photosynthetic rates at the growth CO2 condition in
the field under nearly saturating conditions of PPFD (at least 1000
µmol m−2 s−1) and ambient temperature for plants in the four CO2
treatments. Values are means ± SE for individual plants in three chambers in each CO2 treatment.
Table 4. Net photosynthesis and properties of Rubisco for needles of loblolly pine grown at ambient CO2 (Amb) or ambient plus 30 Pa CO2 (+30).
Duration of CO2 exposure (months) is indicated below measurement dates. Values are means (standard errors) for individual plants in each of three
chambers per CO2 treatment. Different letters within a column and measurement indicate statistically different values at P < 0.05.
Measurement CO2 (Pa) 9/92 11/92 1/93 3/93 5/93 7/93 9/93 11/93
(5) (7) (9) (11) (13) (15) (17) (19)
Photosynthesis Amb 4.0 (0.2) A 3.7 (0.2) A 2.8 (0.1) A 3.3 (0.2) A 4.0 (0.3) A 3.3 (0.2) A 5.0 (0.5) A 4.4 (0.4) A (µmol m−2 s−1) +30 8.8 (0.4) B 4.7 (0.2) B 3.2 (0.2) B 4.4 (0.3) B 9.0 (0.5) B 7.0 (0.4) B 8.0 (0.2) B 8.4 (0.5) B Rubisco activity Amb 20.3 (0.9) A 15.5 (2.1) A 22.5 (1.3) A 24.2 (1.4) A 19.0 (1.4) A 12.9 (1.6) A 21.0 (1.7) A 11.8 (0.9) A (µmol m−2 s−1) +30 17.5 (0.7) B 16.7 (1.2) A 15.0 (1.5) B 17.9 (1.6) B 16.6 (2.5) A 10.1 (1.3) A 19.1 (2.0) A 12.8 (1.0) A Activation state Amb 80.5 (2.5) A 70.8 (4.6) A 86.1 (4.0) A 80.8 (5.2) A 72.8 (2.8) A 82.2 (5.8) A 87.7 (2.5) A 73.4 (2.2) A (%) +30 80.7 (2.8) A 89.6 (6.0) B 91.8 (3.0) A 88.9 (3.3) A 75.6 (4.4) A 83.9 (6.1) A 70.8 (4.5) B 68.8 (2.8) A
Rubisco content Amb 465 (24) A 388 (37) A 621 (53) A 614 (55) A 512 (69) A 365 (22) A 514 (42) A 290 (12) A (mg m−2) +30 422 (35) A 477 (59) A 414 (46) B 487 (49) B 472 (52) A 300 (47) A 522 (39) A 322 (11) A Rubisco content Amb 3.8 (0.4) A 3.1 (0.3) A 3.7 (0.8) A 2.7 (0.3) A 2.5 (0.4) A 1.5 (0.1) A 2.1 (0.2) A 1.4 (0.1) A (g mmol chl−1) +30 3.5 (0.6) A 3.1 (0.2) A 2.3 (0.5) B 2.6 (0.2) A 2.1 (0.4) A 1.2 (0.2) A 2.3 (0.2) A 1.5 (0.1) A Rubisco content Amb 11.8 (0.8) A 5.2 (0.7) A 7.9 (1.2) A 5.8 (0.5) A 9.6 (1.8) A 7.4 (0.7) A 10.3 (0.8) A 4.3 (0.3) A (% of leaf N) +30 7.8 (0.6) B 6.5 (0.8) A 5.6 (1.3) A 4.8 (0.6) A 7.1 (1.1) A 6.5 (1.2) A 10.4 (1.4) A 5.1 (0.3) A
Figure 5. Percentage of trees producing the indicated number of needle flushing events in the four CO2 treatments after 203 (December 1992),
359 (May 1993) and 526 days (November 1993) of CO2 treatment.
parallel changes in NAR. Despite maintenance of high leaf photosynthetic capacity, reductions in the elevated CO2 -in-duced enhancement of NAR during the last 6 months of the CO2 treatment occurred. This suggests that whole-plant carbon gain of elevated CO2-treated trees was reduced relative to that of ambient CO2-treated trees during this time period, thereby reducing the positive effect of elevated CO2 on biomass accu-mulation. Reductions in NAR may be due to increased whole-plant respiration as a result of more respiring, nonphoto-synthetic woody tissue or reduced whole-plant photosynthesis as a result of increased needle self-shading. In loblolly pine, there was no difference in LAR among CO2 treatments indicat-ing that there was no increase in the relative amount of woody tissue. Therefore, it seems likely that reductions in NAR of elevated CO2-treated plants were a result of reductions in whole-plant photosynthesis induced by needle self-shading. Norby and O’Neill (1991) found that Liriodendron tulipifera L. increased NAR and decreased LAR when exposed to in-creasing CO2 partial pressures.
Changes in plant architecture were detected in plants grown at +30 Pa CO2. In addition to increased tree height and greater leaf area, plants grown at +30 Pa CO2 exhibited greater branch production, especially of secondary branches. Increased leaf area per unit tree height and increased branch number per unit tree height changed the vertical structure of the canopy in +30 Pa CO2-treated plants, which may alter the red/far red ratio of understory tree seedlings, thereby affecting their pattern of growth (Arnone and Korner 1993). Leaf phenology was also altered by CO2 partial pressure as loblolly pine grown in elevated CO2 generally exhibited more flushes of new leaves, as has been observed in Fagus sylvatica L. (El Kohen et al. 1993) and Quercus petraea L. ex Liebl. (Ceulemans and Mousseau 1994). Greater carbon assimilation in response to
elevated CO2 often stimulates new sinks for carbon such as increased secondary branching (Idso et al. 1991a) and new leaf production.
The leaf-level photosynthetic response of loblolly pine seed-lings to elevated CO2 indicated a small and transient acclima-tion response to long-term exposure to elevated CO2 partial pressures. Photosynthetic acclimation often involves a reallo-cation of resources, particularly N, away from Rubisco to other limiting photosynthetic processes or to nonphotosynthetic processes resulting in optimal use of resources (Sage 1994). Complete photosynthetic acclimation to elevated CO2 would have occurred if loblolly pine grown and measured at elevated CO2 had similar photosynthetic rates, reduced Rubisco content and total Rubisco activity, and similar Rubisco activation states as plants grown and measured at ambient CO2 (Sage et al. 1989). However, we observed enhanced rates of photosyn-thesis in elevated CO2-treated plants throughout the 19 month exposure period, and only the reductions in total Rubisco activity, which occurred in the first year of CO2 exposure but disappeared in the second year, indicated the occurrence of photosynthetic acclimation in response to elevated CO2. In studies of loblolly pine grown in nonlimiting nutrient condi-tions, photosynthesis was enhanced and Rubisco activity re-duced after 4 months (Thomas et al. 1994) and 2 years (Tissue et al. 1993) of exposure to elevated CO2. Although the reduc-tions in Rubisco activity are involved in the acclimation re-sponse of loblolly pine to elevated CO2, the strength of Rubisco-mediated control of photosynthesis appears to be small. Similarly, Quick et al. (1991) found that Rubisco activ-ity of tobacco grown at elevated CO2 could be reduced 49% with only a 14% reduction in photosynthesis. These results suggest that, in the presence of elevated CO2, Rubisco capacity is excessive, perhaps because Rubisco also functions as a form
Table 5. Leaf characteristics of loblolly pine measured during photosynthesis and Rubisco measurements for plants grown at ambient CO2 (Amb)
or ambient plus 30 Pa CO2 (+30). Duration of CO2 exposure (months) is indicated below measurement dates. Values are means (standard errors)
for individual plants in each of three chambers per CO2 treatment. Different letters within a column and measurement indicate statistically different
values at P < 0.05.
Measurement CO2 (Pa) 9/92 11/92 1/93 3/93 5/93 7/93 9/93 11/93
(5) (7) (9) (11) (13) (15) (17) (19)
Chlorophyll Amb 122 (10) A 125 (5) A 165 (19) A 229 (25) A 202 (8) A 238 (10) A 255 (15) A 198 (16) A (µmol m−2) +30 130 (12) A 158 (7) B 184 (14) A 189 (18) A 229 (19) A 255 (14) A 230 (10) A 224 (14) A Nitrogen Amb 21.9 (0.5) A 26.1 (0.5) A 25.8 (0.6) A 27.8 (0.6) A 22.6 (0.5) A 17.9 (0.5) A 17.4 (0.8) A 18.8 (0.6) A (mg g−1) +30 22.6 (0.8) A 21.6 (0.6) B 21.3 (0.7) B 23.5 (0.9) B 20.3 (0.2) B 13.9 (0.7) B 14.2 (0.8) B 16.5 (0.8) B Nitrogen Amb 674 (32) A 1282 (57) A 1427 (108) A 1641 (67) A 823 (32) A 805 (44) A 889 (48) A 1036 (46) A (mg m−2) +30 796 (26) B 1278 (86) A 1321 (73) A 1434 (89) A 985 (102) A 725 (34) A 855 (50) A 1209 (73) A Specific leaf mass Amb 30.8 (1.4) A 49.2 (2.3) A 55.0 (3.1) A 59.0 (1.7) A 36.5 (1.3) A 44.8 (1.5) A 51.4 (2.5) A 55.2 (1.6) A (g m−2) +30 35.5 (1.4) B 58.9 (3.3) B 61.8 (2.1) B 60.7 (1.8) A 47.8 (2.6) B 52.3 (1.3) B 60.8 (2.8) B 73.4 (3.0) B Soluble sugar Amb NA 6.6 (0.3) A 7.2 (0.5) A 5.0 (0.2) A 3.8 (0.5) A 3.6 (0.3) A 4.2 (0.1) A 5.8 (0.3) A (% by DW) +30 NA 6.9 (0.2) A 6.2 (0.3) A 5.0 (0.1) A 4.0 (0.2) A 4.3 (0.2) B 4.9 (0.2) B 6.5 (0.2) B
Starch Amb NA 4.5 (0.1) A 4.1 (0.2) A 5.2 (0.3) A 5.9 (0.4) A 4.1 (0.5) A 6.3 (0.5) A 4.2 (0.1) A (% by DW) +30 NA 4.6 (0.1) A 3.7 (0.2) A 4.6 (0.2) A 7.3 (0.6) B 7.6 (1.0) B 9.5 (1.3) B 4.6 (0.2) A
of N storage (Millard 1988), and hence reductions in Rubisco may occur with little effect on photosynthesis. In general, photosynthesis is controlled by many factors, including Ru-bisco, stomatal regulation, RuBP regeneration, and end-prod-uct synthesis, and the degree to which each factor regulates photosynthesis depends on prevailing environmental condi-tions (Stitt 1991).
Enhanced photosynthetic rates have been observed in field-grown trees after 3 years of CO2 enrichment (Idso et al. 1991b, Gunderson et al. 1993), although in some studies, the initial increase in photosynthesis was not maintained during long-term exposure to elevated CO2 (Samuelson and Seiler 1992, Mousseau 1993). Differences in photosynthesis (source activ-ity) due to elevated CO2 are often dependent on carbon use (sink activity) in growth. If there are inadequate sinks for the additional carbon assimilated at elevated CO2, then photosyn-thesis may be reduced as a result of starch accumulation or biochemical down-regulation of Rubisco, or both (Stitt 1991). In this study, seasonal shifts in sink strength affected photosyn-thetic rates, especially in plants grown at elevated CO2. Root growth in loblolly pine occurs primarily in two peaks, one in late spring or early summer and one in late summer or early fall, whereas shoot growth occurs primarily in April through September (Wahlenberg 1960). Loblolly pine exhibited 60--125% increases in photosynthetic rate at elevated CO2 during periods of high sink activity, induced by favorable environ-mental conditions and rapid plant growth, and 14--33% in-creases in photosynthetic rate in the winter. Starch accumulation occurred during the period of peak photosynthe-sis and growth indicating some limitation in sink strength even during periods of maximum sink activity, but not sufficient to greatly affect photosynthesis. These seasonal differences in the magnitude of the photosynthetic response to elevated CO2, which were maintained over two growing seasons, indicate the importance of frequent and periodic measurements in accu-rately assessing long-term plant response to elevated CO2.
At the canopy level, total plant leaf area may increase as a result of accelerated ontogeny of the plant rather than as a specific response to CO2 (Tolley and Strain 1984a, Conroy et al. 1986, Berryman et al. 1993). If there were a specific leaf area response to elevated CO2, then a reduction in LAR may indicate a canopy-level adjustment in carbon assimilation that may not be accompanied by leaf-level adjustments in photo-synthesis at the biochemical level (Norby et al. 1992, Gunder-son and Wullschleger 1994). In loblolly pine, total plant leaf area increased in response to elevated CO2 but there was no change in LAR suggesting that canopy-level adjustment in carbon assimilation did not occur and that total plant leaf area increased as a result of accelerated ontogeny. Enhanced leaf-level photosynthesis coupled with increased total leaf area indicate that net carbon assimilation for the whole plant was greater in elevated CO2 than in ambient CO2. However, in some trees such as L. tulipifera and Maranthes corymbosa Blume, reductions in LAR at elevated CO2 without reductions in leaf-level photosynthesis demonstrate canopy-level reductions in carbon assimilation (Norby et al. 1992, Berryman et al. 1993).
In summary, an early and positive response to elevated CO2 rapidly and substantially increased total plant biomass. En-hanced rates of leaf-level photosynthesis were maintained in plants subjected to elevated CO2 over the 19-month treatment period despite reductions in Rubisco activity and leaf N con-centration. Reductions in Rubisco activity indicated photosyn-thetic adjustment to elevated CO2, but Rubisco-mediated control of photosynthesis was small. Seasonal shifts in sink strength affected photosynthetic rates, greatly magnifying the positive effects of elevated CO2 on photosynthesis during pe-riods of rapid plant growth. Greater carbon assimilation by the whole plant accelerated plant development and stimulated new sinks for carbon through increased plant biomass, secondary branching and new leaf production. We conclude that elevated CO2 will enhance photosynthesis and biomass accumulation in loblolly pine seedlings under high nutrient conditions, but reductions in the relative biomass response of elevated CO2 -treated plants over time complicate predictions of the eventual magnitude of carbon storage.
Acknowledgments
We thank Will Cook, Alex Hanafi, Heather Hemric, John King, Jim Lewis and Jeff Pippen for assistance in the field and in the lab. Renate Gebauer, John King, Jim Lewis and Joy Ward provided valuable comments on an earlier draft of this manuscript. This research was supported by the Department of Energy, CO2 Research Division,
contract DE-FGO5-87ER60575, the Electric Power Research Institute Forest Response to CO2 Program and by an NSF grant DEB-9112571
for support of the Duke University Phytotron.
References
Allen, H.L., P.M. Dougherty and R.G. Campbell. 1990. Manipulation of water and nutrients: practice and opportunity in southern US pine forests. For. Ecol. Manage. 30:437--453.
Arnone III, J.A. and C. Korner. 1993. Influence of elevated CO2 on
canopy development and red:far-red ratios in two-storied stands of
Ricinus communis. Oecologia 94:510--515.
Bazzaz, F.A. 1990. The response of natural ecosystems to the rising global CO2 levels. Annu. Rev. Ecol. Syst. 21:167--196.
Bazzaz, F.A., J.S. Coleman and S.R. Morse. 1990. Growth responses of major co-occurring tree species of the Northeastern United States to elevated CO2. Can. J. For. Res. 20:1479--1484.
Berryman, C.A., D. Eamus and G.A. Duff. 1993. The influence of CO2
enrichment on growth, nutrient content and biomass accumulation of Maranthes corymbosa. Aust. J. Bot. 41:195--209.
Ceulemans, R. and M. Mousseau. 1994. Effects of elevated atmos-pheric CO2 on woody plants. New Phytol. 127:425--446.
Conroy, J.P., R.M. Smillie, M. Küppers, D.I. Bevege and E.W.R. Barlow. 1986. Chlorophyll a fluorescence and photosynthetic and
growth responses of Pinus radiata to phosphorus deficiency, drought stress and high CO2. Plant Physiol. 81:423--429.
Eamus, D. and P.G. Jarvis. 1989. The direct effects of increase in the global atmospheric CO2 concentration on natural and commercial
temperate trees and forests. Adv. Ecol. Res. 19:1--55.
Edwards, N.T. 1989. Pine needle holders for use in gas exchange measurements. Tree Physiol. 5:507--509.
Evans, J.R. and I. Terashima. 1987. Effects of nitrogen nutrition on electron transport components and photosynthesis in spinach. Aust. J. Plant Physiol. 14:59--68.
Fetcher, N., C.H. Jaeger, B.R. Strain and N. Sionit. 1988. Long-term elevation of atmospheric CO2 concentration and the carbon
ex-change rates of saplings of Pinus taeda L. and Liquidambar styraci-flua L. Tree Physiol. 4:255--262.
Griffin, K.L., R.B. Thomas and B.R. Strain. 1993. Effects of nitrogen supply and elevated carbon dioxide on construction cost in leaves of Pinus taeda (L.) seedlings. Oecologia 95:575--580.
Gunderson, C.A., R.J. Norby and S.D. Wullschleger. 1993. Foliar gas exchange responses of two deciduous hardwoods during three years of growth at elevated CO2: no loss of photosynthetic enhancement.
Plant Cell Environ. 16:797--807.
Gunderson, C.A. and S.D. Wullschleger. 1994. Photosynthetic accli-mation in trees to rising atmospheric CO2: a broader perspective.
Photosynth. Res. 39:369--388.
Hall, C.A.S. and J. Uhlig. 1991. Refining estimates of carbon released from tropical land-use change. Can. J. For. Res. 21:118--131. Harmon, M.E., W.K. Ferrell and J.F. Franklin. 1990. Effects of carbon
storage on conversion of old-growth forests to young forests. Sci-ence 247:699--702.
Hellmers, H. and L.J. Giles. 1979. Carbon dioxide: critique I. In
Controlled Environment Guidelines for Plant Research. Eds. T.W. Tibbitts and T.T. Kozlowski. Academic Press, New York, pp 229--234.
Herold, A. 1980. Regulation of photosynthesis by sink activity: the missing link. New Phytol. 86:131--144.
Hunt, R. 1990. Basic growth analysis. Unwin Hyman, London, U.K., 112 p.
Idso, S.B. and B.A. Kimball. 1992. Effects of atmospheric CO2
en-richment on photosynthesis, respiration and growth of sour orange trees. Plant Physiol. 99:341--343.
Idso, S.B. and B.A. Kimball. 1994. Effects of atmospheric CO2
en-richment on biomass accumulation and distribution in Eldarica pine trees. J. Exp. Bot. 45:1669--1672.
Idso, S.B., B.A. Kimball and S.G. Allen. 1991a. CO2 enrichment of
sour orange trees: 2.5 years into a long-term experiment. Plant Cell Environ. 14:351--353.
Idso, S.B., B.A. Kimball and S.G. Allen. 1991b. Net photosynthesis of sour orange trees maintained in atmospheres of ambient and ele-vated CO2 concentration. Agric. For. Meteorol. 54:95--101.
Kvet, J., J.P. Ondok, J. Necas and P.G. Jarvis. 1971. Methods of growth analysis. In Plant Photosynthetic Production: Manual of Methods.
Eds. Z. Šesták, J. Èatsky and P.G. Jarvis. Junk, The Hague, pp 343--391.
Lewis, J.D., K.L. Griffin, R.B. Thomas and B.R. Strain. 1994. Phos-phorus supply affects the photosynthetic capacity of loblolly pine grown in elevated carbon dioxide. Tree Physiol. 14:1229--1244. Long, S. and B. Drake. 1991. Effect of long-term elevation of CO2
concentration in the field on quantum yield of photosynthesis of the C3 sedge, Scirpus olneyi. Plant Physiol. 96:221--226.
Lowther, J.R. 1980. Use of a single sulphuric acid-hydrogen peroxide digest for the analysis of Pinus radiata needles. Comm. Soil Sci. Plant Anal. 11:175--188.
Marx, D. 1977. Tree host range and world distribution of the ectomy-corrhizal fungus Pisolithus tinctorius. Can. J. Microbiol.
23:217--223.
Millard, P. 1988. The accumulation and storage of nitrogen by herba-ceous plants. Plant Cell Environ. 11:1--8.
Mousseau, M. 1993. Effects of elevated CO2 on growth,
photosynthe-sis and respiration of sweet chestnut (Castanea sativa Mill.).
Vege-tatio 104/105:413--419.
Mousseau, M. and B. Saugier. 1992. The direct effect of increased CO2
on gas exchange and growth of forest tree species. J. Exp. Bot. 43:1121--1130.
Musselman, R.C. and D.G. Fox. 1991. A review of the role of temper-ate forests in the global CO2 balance. J. Air Waste Manage. Assoc.
41:798--807.
Norby, R.J., E.G. O’Neill and R.J. Luxmoore. 1986. Effects of atmos-pheric CO2 enrichment on the growth and mineral nutrition of
Quercus alba seedlings in nutrient poor soil. Plant Physiol.
82:83--89.
Norby, R.J. and E.G. O’Neill. 1991. Leaf area compensation and nutrient interactions in CO2 enriched seedlings of yellow poplar
(Liriodendron tulipifera L.). New Phytol. 117:515--528.
Norby, R.J., C.A. Gunderson, S.D. Wullschleger, E.G. O’Neill and M.K. McCracken. 1992. Productivity and compensatory responses of yellow-poplar trees in elevated CO2. Nature 357:322--324.
Pettersson, R., A.J.S. McDonald and I. Stadenberg. 1993. Response of small birch plants (Betula pendula Roth.) to elevated CO2 and
nitrogen supply. Plant Cell Environ. 16:1115--1121.
Porra, R.J., W.A. Thompson and P.E. Kriedemann. 1989. Determina-tion of accurate extincDetermina-tion coefficients and simultaneous equaDetermina-tions for assaying chlorophylls a and b extracted with four different
solvents: verification of the concentration of chlorophyll standards by atomic absorption spectroscopy. Biochim. Biophys. Acta 975:384--394.
Pritchett, W.L. and W.H. Smith. 1975. Forest fertilization in the U.S. southeast. In Forest Soils and Forest Land Management. Eds. B.
Bernier and C.H. Winget. Laval University Press, Quebec, pp 467--476.
Quick, W.P., U. Schurr, R. Scheibe, E.-D. Schulze, S.R. Rodermel, L. Bogorad and M. Stitt. 1991. Decreased ribulose-1,5-bisphosphate carboxylase-oxygenase in transgenic tobacco transformed with ‘an-tisense’ rbcS. Planta 183:542--554.
Ridley, S.M., J.P. Thornber and J.L. Bailey. 1967. A study of the water soluble proteins of spinach beet chloroplasts with particular refer-ence to fraction I protein. Biochim. Biophys. Acta 140:62--79. Rogers, H.H., W.W. Heck and A.S. Heagle. 1983. A field technique for
the study of plant responses to elevated carbon dioxide concentra-tion. J. Air Pollut. Control Assoc. 33:42--44.
Rogers, H.H., C.M. Peterson, J.N. McCrimmon and J.D. Cure. 1992. Response of plant roots to elevated atmospheric carbon dioxide. Plant Cell Environ. 15:749--752.
Sage, R.F. 1994. Acclimation of photosynthesis to increasing atmos-pheric CO2: the gas exchange perspective. Photosynth. Res.
39:351--368.
Sage, R.F., T.D. Sharkey and J.R. Seemann. 1989. Acclimation of photosynthesis to elevated CO2 in five C3 species. Plant Physiol.
89:590--596.
Samuelson, L.J. and J.R. Seiler. 1992. Fraser fir seedling gas exchange and growth in response to elevated CO2. Environ. Exp. Bot.
32:351--356.
Sharkey, T.D., J.R. Seemann and J.A. Berry. 1986. Regulation of ribulose-1,5-bisphosphate carboxylase in response to changing par-tial pressure of O2 and light in Phaseolus vulgaris. Plant Physiol. 81:788--791.
Sionit, N., B.R. Strain, H. Hellmers, G.H. Reichers and C.H. Jaeger. 1985. Long-term atmospheric CO2 enrichment affects growth and
development of Liquidambar styraciflua and Pinus taeda seedlings. Can. J. For. Res. 15:468--471.
Steer, M.W., B.E.S. Gunning, T.A. Graham and D.J. Carr. 1968. Isolation, properties, and structure of fraction I protein from Avena sativa L. Planta 79:254--267.
Stitt, M. 1991. Rising CO2 levels and their potential significance for
carbon flow in photosynthetic cells. Plant Cell Environ. 14:741--762.
Strain, B.R. and R.B. Thomas. 1992. Field measurements of CO2
enhancement and climate change in natural vegetation. Water Air Soil Pollut. 64:45--60.
Thomas, R.B. and B.R. Strain. 1991. Root restriction as a factor in photosynthetic acclimation of cotton seedlings grown in elevated carbon dioxide. Plant Physiol. 96:627--634.
Thomas, R.B., J.D. Lewis and B.R. Strain. 1994. Effects of leaf nutrient status on photosynthetic capacity in loblolly pine (Pinus taeda L.) seedlings grown in elevated atmospheric CO2. Tree
Physiol. 14:947--960.
Tissue, D.T., R.B. Thomas and B.R. Strain. 1993. Long-term effects of elevated CO2 and nutrients on photosynthesis and Rubisco in
loblolly pine seedlings. Plant Cell Environ. 16:859--865.
Tissue, D.T. and S.J. Wright. 1995. Effect of seasonal water availabil-ity on phenology and the annual shoot carbohydrate cycle of tropi-cal forest shrubs. Funct. Ecol. 9:518--527.
Tolley, L.C. and B.R. Strain. 1984a. Effects of CO2 enrichment on
growth of Liquidambar styraciflua and Pinus taeda seedlings under
different irradiance levels. Can. J. For. Res. 14:343--350. Tolley, L.C. and B.R. Strain. 1984b. Effects of CO2 enrichment and
water stress on growth of Liquidambar styraciflua and Pinus taeda
seedlings. Can. J. Bot. 62:2135--2139.
Vitousek, P.M. 1991. Can planted forests counteract increasing atmos-pheric carbon dioxide? J. Environ. Qual. 20:348--354.
Wahlenberg, W.G. 1960. Loblolly pine. Duke University Press, Dur-ham, NC, 603 p.
Waring, R.H. and W.H. Schlesinger. 1985. Forest ecosystems: con-cepts and management. Academic Press Inc., Orlando, FL, 340 p. Woodwell, G.M., R.H. Whittaker, W.A. Reiners, G.E. Likens, C.C.