Application of Alternate Healthy Eating Index to Assess Diet Quality
in Male Workers
Pramita Ariawati Putri1*, Dodik Briawan1, Ikeu Ekayanti1
1Department of Community Nutrition, Faculty of Human Ecology, Bogor Agricultural University, Bogor 16680, Indonesia
ABSTRACT
This study aimed to analyze diet quality of male workers. Study design was cross-sectional, involving 101 male workers of PT. Semen Indonesia Tuban, East Java aged 25-55 years old. Subjects were chosen using purposive sampling based on inclusion criterias. US adapted Alternate Healthy Index (AHEI)
was used to assess diet quality that consists of 11 components. Components and portions were modified
based on Indonesian Dietary Guidelines 2014. The result showed that grains and alcohol components had good score (10) and the lowest score was in sweetened beverages component (1.4). AHEI-score range from 45.1 to 95.7 and the mean was 69.5. More than half of workers (75.2%) diet quality was in need of improvement category (AHEI scores <76.2). Education level and working unit were correlated with diet quality (p<0.05). Workers diet quality in PT. Semen Indonesia Tuban needs to be improved.
Keywords: alternate healthy eating index, diet quality, male workers
ISSN 1978-1059 EISSN 2407-0920
INTRODUCTION
Globalization encourages nutrition transi-tion around the world, including Indonesia.
Con-sumption of low fat and high fiber diet converted into high fat, high sugar and low fiber (Popkin
2006). Changes in dietary pattern has resulted in increasing obesity problem. Obesity prevalence of adult in Indonesia according to the result of Basic Health Research (Riskesdas) in 2013 is quite high, at 29.8% (Indonesia Ministry of Health 2014b). Obesity is one of the risk factors for non-communicable disease (NCD) such as type 2 diabetes mellitus, cardiovascular disease, and cancer. NCD contributed to more than half of the mortalitiy rate in Indonesia (Kemenkes RI 2014b). Food consumption is an important factor in preventing NCD. Unfortunately, consumption of food which is good for health such as vegeta-bles and fruits in Indonesia were still low. In con-trast, consumption of foods and beverages which are high in sugar, salt, and fat were quite high (Kemenkes RI 2014b). Kemenkes RI in 2014 es-tablished the Indonesian Dietary Guidelines (Pe-doman Gizi Seimbang 2014), which is expected to be used as a guideline for healthy diet and also to maintain a normal weight for Indonesian popu-lation (Kemenkes RI 2014b).
Diet quality is defined as how well food
consumption of a person compared to existing recommendations (Alkerwi 2014). Healthy Eat-ing Index (HEI) is an instrument used in the
Unit-ed States to assess diet quality. The instrument was arranged based on the Dietary Guidelines for Americans a guidelines for daily dietary intake in United States (Kennedy 1995). Alternate Healthy
Eating Index (AHEI) is an instrument modifica -tion from HEI in which the index was arranged based on food group and nutrients that poses risk for NCD. Increase in AHEI has a strong asso-ciation with low risk in the incidence of cardio-vasclar disease and type 2 diabetes mellitus (De Koning et al. 2011). Other studies have suggested
that AHEI 2010, anothers modification of AHEI
which includes omega 3, trans fat, Poly Unsatu-rated Fatty-Acid (PUFA) component, had shown strong association with risk of NCD such as type 2 diabetes mellitus and coronary heart disease (Chiuve et al. 2012).
us-ing US adapted AHEI has never been done in Indonesia. Thus, the objective of this study is to analyze diet quality in male workers using AHEI adjusted to Indonesian Dietary Guidelines 2014.
METHODS
Design, location, and time
The study design was cross sectional. Re-search took place in PT. Semen Indonesia Tuban, East Java Province from January-March 2017. Ethical approval was obtained from the Ethic Committee of Health Research, Faculty of Medi-cine, University of Indonesia No. 1055/UN2.F2/ ETIK/2016.
Sampling
Subjects in this study were male workers in PT. Semen Indonesia that had their co
medi-cal check-up in February-March 2017. The work
units included were the production units (produc-tion of raw materials, cement, slag I and II, K3) and non-production (communication and public
facilities, commercial and financial). Subjects se-lected purposively to meet sampling quota of 101 male workers included 10% drop out anticipation used formulation by Ariawan (1998). The inclu-sion criterias for the subjects were as follow: was aged 25-55 years old, workers at PT. Semen Indo-nesia in Tuban, not taking any medicine that low-ers blood glucose, blood pressure and cholesterol level, not in certain diet and signed the informed consent. Exclusion criteria in this research were subjects’ resignation and incomplete data.
Data collection
Data were obtained through interview be-tween researcher and subjects using structured questionnaire and anthropometry assessment. Data of subjects characteristics are age, education level, working duration in the company, working unit, marital status was obtained through inter-view using structured questionnaire while nutri-tional status was gathered using anthropometry assessment (body weight measured using digital scale brand "Cambria" with 0.1 kg precision and height measurement using microtoise with 0.1 cm accuracy). Food consumption data were acquired from Semi-Quantitative Food Frequency Ques-tionnaire (SQ-FFQ) for the previous 7 days.
Data analysis
Data on subject characteristics (age, edu-cation level, working duration in the company,
working unit, marital status, and nutritional sta-tus) was categorized and presented in percent-ages. Nutritional status determined by body mass index (BMI) and categorized as normal (BMI 18.5-22.9), overweight (BMI 23-24.9), and obese
(BMI ≥25) (WHO 2000).
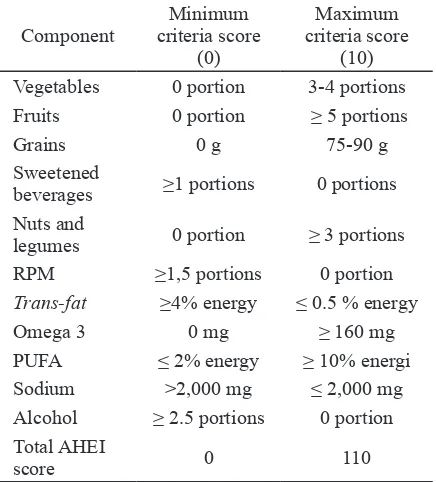
Diet quality. Food consumption data were processed to determine the diet quality of sub-jects based on adapted AHEI that consisted of 11 components developed by Chiuve et al. (2012). AHEI used in this study has been adjusted in components and portions to Indonesian Dietary Guidelines 2014 issued by the Indonesia Ministry of Health. These adjustments were the maximum, minimum and portion criteria for vegetables, fruits, nuts, omega 3 and sodium component, and whole grains component converted into grains.
AHEI used in this study had α-Cronbach value
of 0.61. Maximum score of each component reached was 10 (Table 1).
Component
Minimum criteria score
(0)
Maximum criteria score
(10) Vegetables 0 portion 3-4 portions Fruits 0 portion ≥ 5 portions
Grains 0 g 75-90 g
Sweetened
beverages ≥1 portions 0 portions Nuts and
legumes 0 portion ≥ 3 portions
RPM ≥1,5 portions 0 portion
Trans-fat ≥4% energy ≤ 0.5 % energy
Omega 3 0 mg ≥ 160 mg
PUFA ≤ 2% energy ≥ 10% energi
Sodium >2,000 mg ≤ 2,000 mg Alcohol ≥ 2.5 portions 0 portion Total AHEI
score 0 110
Tabel 1. Modified AHEI Indonesia
was aqquired from the Indonesian Food Compo-sition List (DKBM) while the nutrient content of foods which were not found in DKBM (omega 3, PUFA, trans-fat and sodium) were obtained from Nutrisurvey, Thailand Food Composition Table (Thai-FCT) (Judprasong et al. 2015) or Austra-lian FCT (AUSNUT 2016). Score of each com-ponent was summed to obtain total AHEI score. The total AHEI scores were categorized into two categories according to the highest quartile on the AHEI score of workers (Chiuve et al. 2012). Re-sulted in the need improvement category cut off
in total HEI score of <76.2 and good if ≥76.2.
Table 1 presents the components, maximum and
minimum scores criteria on the modified AHEI.
For example, if within one day the worker con-sumed 2 portions of vegetables, then the calcu-lation of the vegetable component score was 2 divided by 3 (maximum criteria of the vegetable component) and multiplied by 10. The vegetable component score for the worker is 6.7.
Mean adequacy ratio. Mean Adequacy
Ratio (MAR) calculated from the average ad-equacy level of energy and other nutrients. The maximum nutritional adequacy rate is 100 (Gib-son 2005). There are 4 nutrients included in the MAR calculation in this study, ie energy, protein, fat, and carbohydrate.
Data analysis included univariate analysis (descriptive analysis) and bivariate analysis. Bi-variate analysis used were chi-square test to see the relationship between the characteristics of the subject and diet quality and pearson correlation
test to determine the relationship between the level of adequacy of energy, protein, fat, carbo-hydrates, MAR and diet quality.
RESULTS AND DISCUSSION
Subject characteristics
Subjects were male workers and mostly in the age of 40-55 years (79.2%). The educa-tion level was high school and vocaeduca-tional
edu-cation (71.3%), worked in the company for ≥10
years (90.1%). Most of the subjects worked in the production unit (62.4%), had income > Rp 10,000,000 (55.2%), were married (95.0%). Most
of the subjects were classified as overweight /
obese category (86.1%).
Diet quality
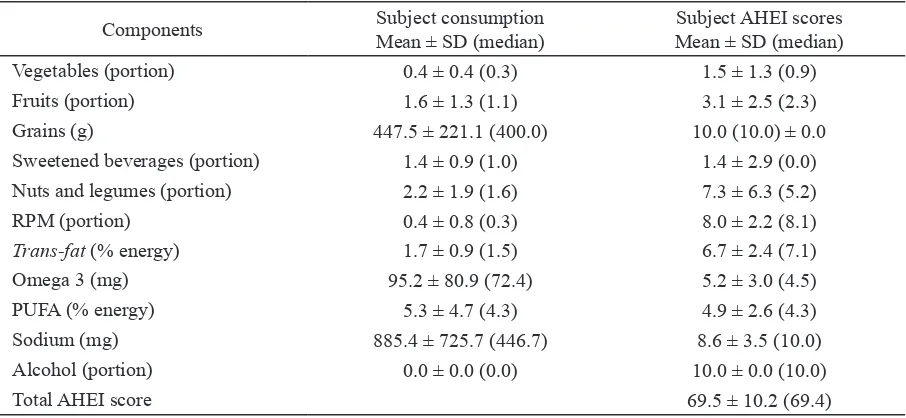
Table 2 shows subjects’ consumption and HEI score. The total AHEI score of the subjects ranged from 45.1 to 95.7 and the mean AHEI score was 69.5. This score is higher compared to research by Chiuve et al. (2012) which found a
mean score of 52.4. Diet quality was classified into two categories, “good” if the score was ≥76.2
and “need improvement” if the score was <76.2. There were 75.2% subjects in “need improve-ment” diet quality category while only 24.8% of subjects in “good” category. In agreement with research on Thai workers using the Thailand Healthy Eating Index (THEI) that 69.0% of sub-jects had poor dietary quality (Taechangam et al.
Components Subject consumption
Mean ± SD (median)
Subject AHEI scores Mean ± SD (median)
Vegetables (portion) 0.4 ± 0.4 (0.3) 1.5 ± 1.3 (0.9)
Fruits (portion) 1.6 ± 1.3 (1.1) 3.1 ± 2.5 (2.3)
Grains (g) 447.5 ± 221.1 (400.0) 10.0 (10.0) ± 0.0
Sweetened beverages (portion) 1.4 ± 0.9 (1.0) 1.4 ± 2.9 (0.0)
Nuts and legumes (portion) 2.2 ± 1.9 (1.6) 7.3 ± 6.3 (5.2)
RPM (portion) 0.4 ± 0.8 (0.3) 8.0 ± 2.2 (8.1)
Trans-fat (% energy) 1.7 ± 0.9 (1.5) 6.7 ± 2.4 (7.1)
Omega 3 (mg) 95.2 ± 80.9 (72.4) 5.2 ± 3.0 (4.5)
PUFA (% energy) 5.3 ± 4.7 (4.3) 4.9 ± 2.6 (4.3)
Sodium (mg) 885.4 ± 725.7 (446.7) 8.6 ± 3.5 (10.0)
Alcohol (portion) 0.0 ± 0.0 (0.0) 10.0 ± 0.0 (10.0)
Total AHEI score 69.5 ± 10.2 (69.4)
2008). Amrin et al. (2013) showed similar results that adult males in Indonesia had low quality of food consumption compared with the standard Balanced Diet Guideline (PUGS) in 2011 using the data from Basic Health Research in 2010.
Research by Assmann et al. (2014), found that men with lower diet quality was associated with greater 6-year weight gain as compared to the high diet quality group. Someone with low diet quality had higher risk to experience NCD. Research by Akbaraly et al. (2011) in adult age 39-63 in the UK pointed that a person with low diet quality had higher risk of developing coro-nary heart disease (CHD) compared to those with good diet quality. A cohort study of adult men in the United States showed that good diet quality reduced the risk of developing type 2 diabetes mellitus, but any increase of 1 SD from AHEI score reduced the risk of type 2 diabetes mellitus by 9-13%. (De Koning et al. 2011).
The low diet quality of male workers in this study was due to low consumption of vege-tables and high consumption of sweetened beve-rages shown by low score of 1.5 and 1.4. Con-sumption of grains and alcohol component of the subject were good, marked by the mean score of that components. The mean score of RPM and sodium were close to a maximum which were 8.0 and 8.6. Components of fruits, nuts, trans-fat, omega-3 and PUFA consumptions need to be in-creased as the were mean score ranged from 5.2 to 6.8.
Vegetables. The mean consumption of
vegetables in the subjects is low with only 0.4 portions in one day (Table 2). Vegetables
con-sumption of the subject had not fulfilled the rec -ommendation of Indonesian Dietary Guidelines 2014 that is 3-4 portions in one day and relatively low compared to vegetable consumption propor-tion in Tuban. The typical consumppropor-tion in Tuban district was equal to 1.5 portion and vegetable consumption in men in East Java Province that was 1.4 (Indonesia Ministry of Health 2014c). The low consumption of vegetables in subjects was suspected because subjects perceived that vegetables are just complementary to the rice and animal protein so that vegetables consump-tions are unable to be maximized. Vegetable is rich in vitamins and minerals that have a positive impact on health. Research by Esmaillzadeh et al. (2006) mentioned that high consumption of vegetables can prevent the occurrence of meta-bolic syndrome.
Fruits. Subjects fruit consumption was 1.6 portionss. Consumption of fruit had not
reached the recommendation of Indonesian Di-etary Guidelines 2014 which amounted to 5 por-tions. However, the mean of fruit consumption in this study was higher than the proportion of fruit consumption in Tuban (0.6 portions) and the proportion of fruit consumption in males in East Java (0.5 portions) (Kemenkes RI 2014c). Lack of fruit consumption can lead to obesity and PTM such as diabetes, hypertension, and heart and blood vessel disease (Slavin & Lloyd 2012).
Grains. Foods included in the grain group in this study were rice, brown rice, cereal or oat-meal. Grains is needed by the body because of the high carbohydrate which was served as a source of energy (Kemenkes RI 2014b). Table 2 shows that the mean of grains consumption in subjects was 447.5 g and met the maximum score criteria. In line with research from Waloya et al. (2013) conducted in the city and district of Bogor that the consumption of grains in men per day was 455.5 g. White rice was the grains consumed by all subjects, while other grains included in this component were very rarely consumed. A switch to healthier grain is suggested to improve diet quality and health Consumption of grains besides white rice such as brown rice, cereal or oatmeal
alternately in everyday has shown benefit for the body because it was rich in fiber that helps con -trol blood cholesterol. Complex carbohydrates contained in the food can also prevent high blood glucose because it is more slowly converted into blood sugar (Kemenkes RI 2014b).
Sweetened beverages. The mean
con-sumption of sweetened beverage amongst sub-jects were 1.4 portions, a very low mean score (1.4) (Table 2). Data from Basic Health Research in 2013 showed that in East Java province where the district of Tuban is located that the proportion of people who consumed beverages with
sweet-ener ≥1 times per day were higher than those who consumed 1-6 times per week or ≤3 times
per month (Kemenkes RI 2014c). Sweetened beverages such as tea or coffee added with sugar,
other instant beverages are difficult to separate
from the food consumption pattern of today’s so-ciety. Meta-analysis study by Malik et al. (2010) showed that a person who consumed sweetener 1-2 times a day had 26% higher risk of develop-ing type 2 diabetes mellitus.
Nuts and legumes. According to Indone-sian dietary guidelines 2014, good consumption
of nuts and legumes defined as 3-4 portions/day.
Indone-sian dietary guidelines 2014. Nuts and legumes also processed to be tofu and tempeh which are sources for plant based protein. In addition nuts contain potassium that can lower high blood pressure. Nuts also contain antioxidants and have no cholesterol content. Consumption of tempeh and soybean can increase insulin sensitivity and lower blood sugar level (Kemenkes RI 2014b). Systematic review conducted by Demersay et al. (2017) highlighted that the intake of vegetable protein has an inverse relationship with both sys-tolic and diassys-tolic blood pressures. Other stud-ies suggested that increased intake of vegetable protein was not associated with increased risk of type 2 diabetes mellitus (Van-Nielen et al. 2014).
RPM. Food included in RPM was red meat such as beef and mutton and processed meat such as meatball, corned beef, and sausage which are sources of animal protein for the body. The mean consumption of RPM in this study was 0.6 por-tions, which was higher than the maximum (0 portion) score criteria. In line with the research from Waloya et al. (2013) conducted in Bogor that male meat consumption was 23.13 g or 0.67 portions of beef. Animal protein has advantages over plant based protein due to more complete amino acids and better nutrient quality because they are more readily absorbed by the body. On
the flip side, red meat has higher cholesterol and
saturated fat content thus the consumption needs to be limited in adult (Indonesia Ministry of Health 2014b). The consumption of animal pro-tein belonging to the RPM group can be replaced by animal protein present in low-fat groups such
as fish or poultry. RPM consumption associ -ated with higher risk of metabolic syndrome, compared to other animal protein consumption (Becerra et al. 2016).
Trans-fat. Table 2 shows that mean con-tribution of trans-fats to energy is 1.7%, which means that it had not met the maximum score
cri-teria (≤ 0.5% of the total energy intake). The high
mean consumption of trans-fat can be caused by frying cooking process of daily food such as fried chicken, fried tempeh and bakwan (vegetables fritters). Trans-fat is the result of hydrogenation of unsaturated fatty acids. Unsaturated fatty acids possess highly heat-sensitive properties, deep-frying can form long-chain saturated fatty acids and trans fatty acids. Hydrogenation in commer-cial products has a purpose to reduce the rate of oxidation reaction so that the resulting product is denser, more durable and stable in the presence of oxidation. Trans-fat consumption has
nega-tive impact on the body because it can increase LDL cholesterol and lowering HDL cholesterol (Sartika 2008). Trans-fat consumption should be limited because it is associated with insulin resis-tance and metabolic syndrome, 2% of trans-fat consumption from total energy intake associated with increased incidence of CHD (Micha & Mo-zaffarian 2009).
Omega 3. The mean omega 3
consump-tion were 95.2 mg (Table 2) and had not reached the maximum score which is > 160 mg. The low consumption of omega 3 was thought to be due to a lack of consumption of omega 3 sources
such as fish, fish oil and nuts. Omega 3 is one
type of unsaturated fatty acids with double bonds that is important for immune system as well as heart and blood vessels (Oken & Belfort 2010). Another study by Wallin et al. (2017) stated that
fish consumption of more than 3 times/week
lowered the risk of myocardial infarction com-pared to consumption less than 3 times/month.
PUFA. PUFA is fatty acids that have two or more double bonds. PUFA is mostly found
in fish and vegetable oils also in nuts and seeds
such as omega 3 and omega 6. Mean percent-age of PUFA contribution amongst subject had
not fulfilled the maximum criteria (≥10% total
energy) (Table 2). PUFA consumption was not maximized because of the consumption of nuts and consumption of omega 3 sources were also not maximal. PUFAs (arachidonic fatty acids,
linoleic and linolenic acids) have good benefits
for the body because they function in fat trans-port and metabolism such as clearing plasma from VLDL and decreasing triglyceride produc-tion in the liver (Sartika 2008).
blood pressure and had an inverse relationship with the occurrence of metabolic syndrome (Sar-no et al. 2009).
Alcohol. None of subjects consumed alco-hol either in the form of beverages or in food, this may be due to a largely religious factor that did not permitted alcohol consumption. Based on these results, the entire subject can reach the maximum criteria in the components of alcohol (Table 2). Alcohol consumption may posed nega-tive impact on the body, research by Baik and Shin (2008) suggested frequent consumption of alcohol had strong relationship with the inci-dence of metabolic syndrome.
Association between MAR and diet quality There was an association between ad-equacy level of energy, protein, fat and MAR and diet quality (r=0.3-0.5; p<0.01) and there was association between carbohydrate adequacy level and diet quality (r = 0.022; p <0.05). MAR can be used as a gold-standard to determine the diet quality of food consumption (Amrin et al. 2013; Perdana et al. 2014). Significant associa -tion between MAR and diet quality suggests that
diet quality obtained from AHEI may reflects the
nutritional quality of food consumption of the workers.
Association between subjects characteristics and diet quality
There was no association between age, duration of work, income, marital status and nu-tritional status with diet quality (p>0.05). Work-ers with high school and vocational education
were significantly associated with 73.8%
decre-ase risk in diet quality “need improvement” cat-egory than workers with recent college education (OR=0.262; 95%CI:0.07-0.95). Based on re-search conducted in Ireland, most of the workers who have higher education levels were not ac-companied by good nutritional knowledge. Thus nutrition knowledge explained the better diet rather than the educational level (Geaney et al. 2015)
Workers in production unit were signifi -cantly associated with 67.7% risk reduction in
diet quality as classified in “need improvement”
category than workers in non-production units (OR=0.323; 95%CI:0.11-0.95). Workers in pro-duction unit only consume food at break time, in contrast to workers in non-production units who are allowed to eat or drink while working. Frequent consumption of snack foods with high
trans-fat content or consumption of sweetened beverages contributed to the lowering of the diet quality in workers. This result is in line with Croce et al. (2007) that diet quality in workers in production unit was better than in non-production unit.
CONCLUSION
A third of male workers had diet quality in the category of need improvement. The low diet quality was due to very low vegetable consump-tion and high consumpconsump-tion of sweetened bever-ages. The consumption of grains and alcohol in male workers were good. Consumption of sodi-um, RPM, and trans-fat needs to be limited, while consumption of fruits, nuts, omega 3, and PUFA should be increased. There was an association be-tween educational level and work unit with diet quality.
Food management in accordance with the Indonesia Dietary Guidelines 2014 can be done by companies to improve the diet quality of workers either for workers in production unit or non-production unit. Nutritional knowledge vari-ables can be added in subsequent research. Cut-off point development in categorizing diet qual-ity in Indonesia also needs to be done in future research.
REFERENCES
Alkerwi A. 2014. Diet quality concept. Nutrition 30(6):613-618.
Akbaraly TN, Ferrie JE, Berr C, Brunner EJ, Head J, Marmot MG, Singh-Manoux A, Ritchie K, Shipley MJ, Kivimaki M. 2011. Alternative Healthy Eating Index and mor-tality over 18 y of follow-up: Results from the Whitehall II cohort. Am J Clin Nutr 94(1):247-253.
Amrin AP, Hardinsyah, Cesilia MD. 2013. Alter-natif indeks gizi seimbang untuk penilaian mutu gizi konsumsi pangan pria dewasa Indonesia. J Gizi Pangan 8(3):167-174. Ariawan I. 1998. Besar dan Metode Sampel pada
Penelitian Kesehatan. Jakarta: Universitas Indonesia.
[AUSNUT] Australian Food, Supplement and Nutrient Database 2011-2013. 2016. Aus-tralia: Food Standards Australia New Zea-land.
6-year anthropometric changes in a sample of French middle-aged overweight and obese adults. Plos One 9(2):87083.
Baik I, Shin C. 2008. Prospective study of alco-hol consumption and metabolic syndrome. Am J Clin Nutr 87(5):1455-63.
Becerra TN, Babio N, Martínez GMÁ, Corella D, Estruch R, Ros E, Fitó M, Serra Majem L, Salaverria I, Lamuela RMR, Lapetra J, Gómez EG, Fiol M, Toledo E, Sorlí JV, Pe-dret LMR, Salas-Salvadó J. 2016. Repla-cing red meat and processed red meat for
white meat, fish, legumes or eggs is asso -ciated with lower risk of incidence of me-tabolic syndrome. Clin Nutr 35(6):1442-1449.
Chiuve SE, Fung TT, Rimm EB, Hu FB, Mc-Cullough ML, Wang M, Stampfer MJ, Willett WC. 2012. Alternative dietary in-dices both strongly predict risk of chronic disease. J Nutr 142(6):1009-1018.
Croce N, Bracci M, Ceccarelli G, Barbadoro P, Prospero E, Santarellia L. 2007. Body mass index in shift workers: relation to diet and physical activity. G Ital Med Lav Er-gon 29(3 Suppl):488-489.
De Koning L, Chiuve SE, Fung TT, Willett WC, Rimm EB, Hu FB. 2011. Diet quality scores and the risk of type 2 diabetes in men. Diabetes Care 34(5):1150-1156. Demersay TC, Marniche DA, Arfsten J, Egli L,
Gaudichon C, Karagounis LG, Tome D. 2017. A systematic review of the effects of plant compared with animal protein sourc-es on featursourc-es of metabolic syndrome. J Nutr 147(3):281-292.
Esmaillzadeh A, Kimiager M, Mehrabi Y, Aza-dbakht L, Hu FB, Willet WC. 2006. Fruit and vegetable intakes, C-reactive protein, and the metabolic syndrome. Am J Clin Nutr 84(6):1489-1497.
Geaney F, Fitzgerald S, Harrington JM, Kelly C, Greiner BA, Perry IJ. 2015. Nutrition knowledge, diet quality and hyperten-sion in a working population. Prev Med Rep 2(1):105-113.
Gibson RS. 2005. Principles of Nutritional As-sessment 2nd ed. Oxford University Press, New York.
Judprasong K, Puwastien P, Nitithamyong A, Sridonpai P, Somjai A. 2015. Institute of Nutrition, Mahidol University. Thai Food Composition Database. http://www.inmu. mahidol.ac.th/thaifcd
[Kemenkes RI] Kementrian Kesehatan Republik Indonesia. 2010. Laporan Riset Kesehatan Dasar Tahun 2010. Jakarta: Kemenkes RI. [Kemenkes RI] Kementrian Kesehatan Republik
Indonesia. 2014a. Laporan Riset Kesehat-an Dasar 2013. Jakarta: Kemenkes RI. [Kemenkes RI] Kementrian Kesehatan Republik
Indonesia. 2014b. Pedoman Gizi Seim- bang. Jakarta: Kemenkes RI.
[Kemenkes RI] Kementrian Kesehatan Republik Indonesia. 2014c. Riskesdas dalam Angka Provinsi Jawa Timur 2013. Jakarta: Ke-menkes RI.
Kennedy ET, Ohls J, Carlson S, Fleming K. 1995. The Healthy Eating Index: design and ap-plications. J Am Diet Assoc 95(10):1103-1108.
Malik VS, Popkin BM, Bray GA, Després JP, Wil-lett WC, Hu FB. 2010. Sugar-sweetened beverages and risk of metabolic syndrome and type 2 diabetes a meta-analysis. Dia-betes Care 33(11):2477-2483.
Micha R, Mozaffarian D. 2009. Trans fatty ac-ids: effects on metabolic syndrome, heart disease and diabetes. Nat Rev Endocrinol 5(6):335-344.
Nurjanah F, Roosita K. 2015. Gaya hidup dan ke-jadian sindrom metabolik pada karyawan laki-laki berstatus gizi obes di PT. Indoce-ment Citeureup. J Gizi Pangan 10(1):17-24.
Oken E, Belfort MB. 2010. Fish, fish oil, and
pregnancy. JAMA 304(15):1717-1718. Perdana SM, Hardinsyah, Damayanthi E. 2014.
Alternatif indeks gizi seimbang untuk pe-nilaian mutu gizi konsumsi pangan wanita dewasa Indonesia. J Gizi Pangan 9(1):43-50.
Popkin BM. 2006. Global nutrition dynamics: the world is shifting rapidly toward a diet linked with noncommunicable diseases. Am J Clin Nutr 84(2):289-98.
Rossaa CEB, Caramoria PRA, Manfroia WC. 2012. Metabolic syndrome in workers in a university hospital. Rev Port Cardiol 31(10):629-636.
Sarno F, Jaime PC, Ferreira SRG, Monteiro CA. 2009. Sodium intake and metabolic syn-drome : a systematic review. Arq Bras En-docrinol Metabol 53(5): 608-616.
Sartika RAD. 2008. Pengaruh asam lemak jenuh, tidak jenuh dan asam lemak trans terhadap kesehatan. KESMAS 2(4):154-160.
Slavin JL, Lloyd B. 2012. Health benefits of fruits
Taechangam S, Pinitchun U, Pachotikarn C. 2008. Development of nutrition educa-tion tool: healthy eating index in Thailand. Asia Pac J Clin Nutr 17(1):365-367. Takase H, Sugiura T, Kimura G, Ohte N, Dohi
Y. 2015. Dietary sodium consumption pre-dicts future blood pressure and incident hypertension in the Japanese normotensive general population. JAHA 4(8):1-7. Van-Nielen M, Feskens EJ, Mensink M, Sluijs I,
Molina E, Amiano P, Ardanaz E, Balkau B, Beulens JW, Boeing H. 2014. Dietary protein intake and incidence of type 2 dia-betes in Europe: the EPIC InterAct Case-Cohort Study. Diabetes Care 37(7):1854-1862.
Wallin A, Orsini N, Forouhi NG, Wolk A. 2017. Fish consumption in relation to myocar-dial infarction, stroke and mortality among women and men with type 2 diabetes: A prospective cohort study. Clin Nutr 12(1):1-7.
Waloya T, Rimbawan, Andarwulan N. 2013. Hubungan antara konsumsi pangan dan
aktivitas fisik dengan kadar kolesterol
darah pria dan wanita dewasa di Bogor. J Gizi Pangan 8(1): 9-16.
[WHO] World Health Organization. 2000. WHO/
IOASO/IOTF: The Asia Pasific perspec