208 Vol. 3 No. 3, 2017; pp. 208-213 p-ISSN: 2442-3750; e-ISSN: 2527-6204 http://ejournal.umm.ac.id/index.php/jpbi
Received: 12/10/2017 Revised: 25/11/2017 Accepted: 29/11/2017
JURNAL PENDIDIKAN BIOLOGI INDONESIA [Indonesian Journal of Biology Education]
Citation: Ardiansyah, R.. & Diella, D. (2017). The ability of quantitative literacy of pre-service biology students. Jurnal Pendidikan Biologi Indonesia, 3(3), 208-213.
THE ABILITY OF QUANTITATIVE LITERACY OF PRE-SERVICE BIOLOGY
STUDENTS
Ryan Ardiansyah* and Dea Diella
Biology Education Department, Faculty of Teacher Training and Education, Siliwangi University *corresponding e-mail: [email protected]
ABSTRACT
This research have purpose to know and describe quantitative literacy of pre-service biology students based on six indicators of quantitative literacy. Methods used is descriptive with study survey. This research carried out at Siliwangi University with the subject as many as 30 pre-service biology students who take plant anatomy course. Based on the analysis of test and interview obtained that of 30 students, 4 students (13.3%) in high category, 10 students (33.3%) in medium category, and 16 students (53.3%) in low category. Overall, indicator of interpretation have succeeded owned by students, but other five indicators have not been owned. Lack of quantitative literacy of pre-service biology students is caused by course characteristics that tends to qualitative teaching materials that is not based on quantitative literacy, and inadequate facility to gain and analyzed quantitative data.
Keywords: pre-service biology students, plant anatomy, quantitative indicators, quantitative literacy
© 2017 Department of Biology Education, FTTE, University of Muhammadiyah Malang, Indonesia
INTRODUCTION
The 21st century is the era of mathematics and technology, where supposed all science disciplines to start directed to those aspects (Ricchezza & Vacher, 2015). Biology is expected to developed toward quanitative science (Ardiansyah, 2014). This numerical ability is called quantitative literacy, in which not merely mathematical competence but also as habits of mind in operating/processing numerical data (Rhodes & Finley, 2013). The fact in Indonesia seems that quantitative literacy is still not owned by pre-service biology students. It can be seen from test result of quantitative literacy conducted by Organisation for Economic Co-Operation and Development (OECD) shows that as many as 70 participants in 20 – 25 years old still can’t solve problem related to quantitative data, so Indonesia is only ranked 64 of 65 countries who follow the test (Stacey, 2015). It shows that the quantitative literacy ability is still low. But the results from OECD did not explain what quantitative aspect which has controlled students, and it wasn’t known quantitative aspeck from OECD using quantitative test related to biology or general quantitative (Hubert & Lewis, 2014). Because of that, it needs to be research to know the quantitative
literacy pre-service biology students in Siliwangi University based on indicators of literacy quantitative from Association of American College and Universities (AAC&U, 2011).
Quantitative literacy ability to be observed from pre-service biology students is on anatomy plant material based on six indicators of rubric assessment quantitative, namely interpretation, representation, calculation, analysing, assumssion, and communication. These sixth indicators also phase of the ability of quantitative literacy from lowest ability i.e. interpretation and higher ability i.e communication (Best, 2008).
Interpretation is ability to explain an information in mathematic form (graph, diagram, table, shape, etc). Representation is ability to change information into another mathematic form (equation, text to diagram, etc).
Calculation is ability to used formula in mathematic to solve a problem. Analyze is ability to make a good analyzing and create a conclusion based on quantitative data.
Assumption is ability to create and evaluate some assumptions in modeling and data anlyze.
Ardiansyah & Diella / Jurnal Pendidikan Biologi Indonesia / 3 (3) (2017) pp. 208-213
Plant anatomy material is one course in biology education department which having a great potential to developed into one course that can be supported development of quantitative literacy of pre-service biology students (Survani, Ardiansyah, & Nurqalbi, 2014).
Generally pre-service biology students already skilled in doing representation of making observation table and image modelling from microscope observation results (Lusardi & Wallace, 2013). But, based on initial study result by using questionnaire given to biology students who had taken plant anatomy show that 93% aspect that often assessd is qualitative literacy like a function of cell, characteristic of cell, etc, 98% students stated that it is possible to gather a quantitative data in plant anatomy material and 76% biology students feel difficult in making charts or read a graphic as quantitative skill. So, this problem need to solve. This research was conducted to improve the quality of learning especially in plant anatomy course with quantitative literacy.
All description above proven that quantitative literacy of pre-service biology students is in low category, so this research can be used as a background to find efforts as a form of improvements in next learning process to increase the ability of quantitative literacy for pre-service biology students in future.
METHOD
This research used descriptive methods with survey study. Population subject of this research is 30 undergraduated pre-service biology students who took plant anatomy course in Siliwangi University. This focus research is quantitative literacy based on six quantitative literacy indicators from AAC&U. AAC&U is the leading national association concerned with the quality, vitality, and public standing of undergraduate liberal education and they developed a value rubric for quantitative literacy. AAC&U is stands for Association of American College and Universities. The data collection used written test and interviews technic related with general quantitative literacy. Items test created based on six indicators of quantitative literacy from AAC&U and aiming for measuring and describing the ability of quantitative literacy in pre-service biology students based on its score for each competence measured. There are six item of test after been validated by 3 experts they are professor of
mathematics lecturer, doctorate of plant anatomy lecturer and professor of assessment & evaluation lecturer and all of them are from Universitas Pendidikan Indonesia, Bandung. Then conducted trials item test at the Galuh University, Ciamis for measuring validity and reliability item test. Validity of item number 1 is categorized into very high (0.830), and item number 2 and 3 are categorized into high (0.677 and 0.758), and item number 4, 5 and 6 is categorized into medium (0.591, 0.591 and 0.577. test reliability is categorized into hight with a coefficient of 0.71. the sixth item tes reffered to six indicators of quantitative literacy, namely interpretation, representation, calculation, analyse, assumptions and communication. While the interview is a non-structured as information to futher about quantitative literacy that is not gain by test.
The results test that done by students is given a score and feedback, made into table form, and classified into criteria, i.e : 1) high, if score
≥
𝐗
̅ + 𝑺𝑫;
2) while medium, if score𝑿̅ −
𝑺𝑫 ≤ 𝒔𝒌𝒐𝒓 < 𝑿̅ + 𝑺𝑫;
dan 3) low if score< 𝑿̅ − 𝑺𝑫.
explanation :𝑿̅
= average, dan SD= Deviation Standar (Cokely, et al 2012). The data interview was conducted to all pre-service biology students who have higher, medium, and lower category of quantitative literacy. This data is secondary data to support what things that higher, medium, and lower students can and can’t do related to quantitative ability which is not gain by test.
RESULTS AND DISCUSSION
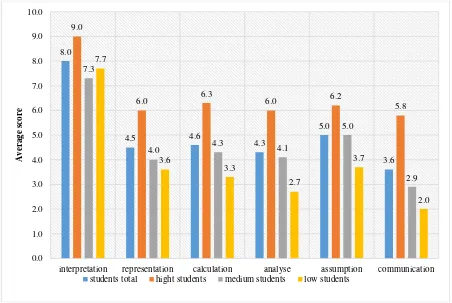
Based on quantitative literacy test result obtained data that the average score for all students is 30 with deviation standard is 22.03. then conducted the category of quantitative literacy to high, medium and low category have score 7.97 < skor < 50.03, and students in low category are students who have score below 7.97.
Ardiansyah & Diella / Jurnal Pendidikan Biologi Indonesia / 3 (3) (2017) pp. 208-213
medium and low category has not reached the maximum score, except for interpretation indicators, while in other idicators are still weak. This is a challenge for educator to improve quantitative literacy in every indicators.
Next step after data analyzed in quantitative, then the data analyzed in qualitative, especially on written test. Then presented analyze the results of answer of a written test. In
interpretation indicators, generally students in high, medium and low category can still answer the test, for example related with geometric, distinguish cell plant shape, know the formula calibration, etc. indicator in this ability still basic, so students still feeling easily when the test were given. Students in low category, generally has not been able to complete test which demands students to find best solutions to do abstraction measurement and explain mathematical information when must create different measure. In calculation, representation,
asumssion, and analyse indicators are only some students in high, medium and low category who have same ability to resolve test. Most students have accustomed to create table result of observation in qualitative and quantitative and have same representation. In calculation
indicator, some students can finish the test because they familiar to count proportion formula, and geometric volume when they took mathematic course. In representation indicator is only some students who able to create math model and in assumption and analyse indicator is only some student who able to analysing the correlation of two variable and numerical reasoning. While in communication indicators is only some students in both high, medium, and low category who able to finish test. In communication item test, students are required to provide conclusion and draw ideas based on observation and mathematical calculations result.
Figure 1. Average of achievement score in six indicators of quantitative literacy from AAC&U.
Analysis of interview was conducted to all pre-service biology students. It obtained information as follows: 1) students in high category are able to answered a questions of interview for representation indicator such as “if you have two different shapes from 2D like this
(show a picture), what kind of 3D images that you can create from it?” the higher students can use quantitative data to solve this problem and can create the 3D images from 2D images in randomly. They also can presents mathematical data, perform mathematical operation. The 8.0
4.5 4.6
4.3
5.0
3.6 9.0
6.0 6.3 6.0 6.2
5.8 7.3
4.0 4.3 4.1
5.0
2.9 7.7
3.6
3.3
2.7
3.7
2.0
0.0 1.0 2.0 3.0 4.0 5.0 6.0 7.0 8.0 9.0 10.0
interpretation representation calculation analyse assumption communication
Av
er
a
g
e
sc
o
re
Ardiansyah & Diella / Jurnal Pendidikan Biologi Indonesia / 3 (3) (2017) pp. 208-213
students are able to analysing and reasoning on numerical information appropriately. In the end they can explain process of problem solving with arguments and correct reasons, 2) students in medium category are only able to finish some test which used to solve problems, and this has an impacts on analysis to information becomes not maximum and even assumption tend to be irrelevant. It happened because some ideas and clues in test are ignored by students because they feel unnecessary. It can be seen when the answered a question of interview for assumption indicators such as “look at this table of different ratio ergastic and cell size in different plant, can you guess which plant is older and explain why?” students can guess the plant but the explanation is not related with data in table. They ignored the quantitative data presented, 3) Students in low category tend to often make mistakes, specifically specify irrelevant informations with problem solving. So, overall the problem solving process is improper. They reasoned that the sentence in item test is too complicated and too long, this making them lazy to read and finnaly can not understand the problem in that item test. They explain in detail but none of the explanations are connected with quantitative data and often not according to interview question, for example when the question of interview for analyse indicators such as “can you explain with quantitative data how you differentiate between xerophyte and hydrophyte plant stem?” they answered only because xerophyte has a warm temperature in stem more than 300C and hydrophyte has a cold temperature In stem less than 00C. It’s not related with the plant anatomy material and the quantitative data was wrong.
Based on result of research, the lack of quantitative literacy of pre-service biology students can happen because of some reason there are course characteristic in plant anatomy is not tend to quantitative literacy, teaching material of plant anatomy is tend to quantitative literacy, and lack of adequate facilities to train students to able to have quantitative literacy ability. It is aligned with other result conducted for students in other universities who stated that one of factors that causing low quantitative literacy is from characteristic of subjects and the lack of adequate facilities (Nuraeni, et al, 2010)
Plant anatomy course tend to lead to qualitative materials, so it is not possible for students to collect data and analyse quantitative data. Whereas all discipline should have led to
quantitative science in 21st century because the demans of students to have numerical and technology skills have to be introduce in learning process (Ricchezza & Vacher, 2017). Another reason where lack of quantitative literacy of students is the absence of teaching materials that lead to quantitative data. It should be teaching material of plant anatomy should be directed to theories, students’ worksheet that are integrated with quantitative questions and problems. This result is related with McCright (2012) that other research that teaching materials which created based on the needs of curriculum demands will help students to achieve curriculum goals.
Another factors that can help pre-service biology students to gain quantitative literacy ability is the existence of adequate facilities to obtain data, pocess data, and analyse numerical data based on student’s activities. The facility can be scaled ocular lens, stage micrometer and other tools, because the learning facilities are adjusted to the need students practical work activities related processing numeric data will make students easily to be able to draw the expected conclusuion (Mhakure, 2014).
CONCLUSION
Based on result of data analysis and interviews are found that 30 pre-service biology students, as many as 4 students (13.3%) in high category, 10 students (33.3%) in medium category, and 16 students (53.3%) in low category. Most students do not have enough quantitative literacy, this is seen from ability of each student in solve proble related with six quantitative indicators namely interpretation, representation, calculation, analyze, assumption, and communication. In spesific, the conclusion of this study is to improve the quantitatve literacy ability of pre-service biology students. Weh need to develop teaching materials which directed to quantitative literacy, and subject that need to direct to quantitative science and appropriate facility to collect and process quantitative data.
Ardiansyah & Diella / Jurnal Pendidikan Biologi Indonesia / 3 (3) (2017) pp. 208-213
REFERENCES
AAC&U. (2011). Quantitative literacy value rubric. Hawaii: Association of American Colleges and Universities. Retrieved from https://www.google.co.id/url?sa=t&rct=j&q tumbuhan untuk menunjang literasi kuantitatif mahasiswa biologi. Prosiding Mathematics and Sciences Forum 2014, 411– 416. Retrieved from http://prosiding.upgri smg.ac.id
Best, J. (2008). Beyond calculation: Quantitative literacy and critical thinking about public issues. (B. L. Madison & L. A. Steen, Eds.), The Mathematical Association of America (incorporated). United States of America: Mathematical Association of America. https://doi.org/http://dx.doi.org/ 10.5038/1936-4660.2.2.6
Cokely, E. T., Galesic, M., Schulz, E., Ghazal, S., & Garcia-Retamero, R. (2012). Measuring risk literacy: The berlin numeracy test.
Judgment and Decision Making, 7(1), 25–47. Retrieved from http://journal.sjdm.org/11/ 11808/jdm11808.html
Hubert, D. a, & Lewis, K. J. (2014). A framework for general education assessment: assessing information literacy and quantitative literacy with eportfolios.
International Journal of ePortfolio, 4(1), 61– 71. Retrieved from https://www. literacy and quantitative reasoning in the high school and college classroom. Scholar Commons University of South Florida, 6(2), 1. https://doi.org/10.5038/1936-4660.6.2.1 McCright, A. M. (2012). Enhancing students’
scientific and quantitative literacies through an inquiry-based learning project on climate change. Journal of the Scholarship of Teaching and Learning, 12(4), 86–101.
Retrieved from http://search.proquest.com/ docview/1314328364?accountid=13042 Mhakure, D. (2014). The contribution of course
materials to a social justice agenda: Lessons from a quantitative literacy course for undergraduate social science students.
Mediterranean Journal of Social Sciences,
5(23), 1190–1197. https://doi.org/10.59 01/mjss.2014.v5n23p1190
Nuraeni, E., Redjeki, S., & Rahmat, A. (2010). Perkembangan literasi kuantitatif mahasiswa biologi dalam perkuliahan anatomi tumbuhan berbasis dimensi belajar. Jurnal Ilmu Pendidikan, 21(2), 127–135. http://dx.
value rubrics for improvement of learning and authentic assessment case study: University of north carolina wilmington use of aac&u value rubrics. (T. L. Rhoeds & A. Finley, Eds.). Washington DC: Association of American Colleges and Universities. Retrieved from https://www.eou.edu/ctl/ files/2012/10/E-VALRUBR2.pdf
Ricchezza, V. J., & Vacher, H. L. (2015). Review of developing quantitative literacy skills in history and the social sciences: A
Quantitative literacy in the affective domain: Computational geology students’ reactions to devlin’s the math instinct. Scholar Commons University of South Florida, 10(2), 1–18. https://doi.org/ht tp://doi.org/10.5038/1936-4660.10.2.11
Stacey, K. (2015). The international Assessment of mathematical literacy: PISA 2012 framework and items. In S. J. Cho (Ed.),
Ardiansyah & Diella / Jurnal Pendidikan Biologi Indonesia / 3 (3) (2017) pp. 208-213
Survani, R., Ardiansyah, R., & Nurqalbi, N. (2014). Kemampuan analisis informasi versus usaha mental mahasiswa dalam perkuliahan anatomi tumbuhan untuk menunjang literasi kuantitatif. Prosiding