57
This chapter discussed the result of study. It consisted of the data finding
and discussion. In data finding the research display the data which was found in
the field and in discussion the researcher explained the result of the data by using
correlation Pearson product moment formula whether there is correlation or there
is no correlation between two variables.
A. DATA FINDINGS
1. The Result from Part One of the Questionnaire
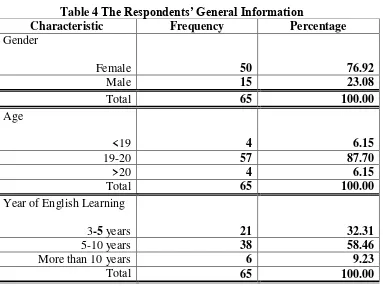
Table 4 The Respondents’ General Information
Characteristic Frequency Percentage
Gender
Female 50 76.92
Male 15 23.08
Total 65 100.00
Age
<19 4 6.15
19-20 57 87.70
>20 4 6.15
Total 65 100.00
Year of English Learning
3-5 years 21 32.31
5-10 years 38 58.46
More than 10 years 6 9.23
From Table 4.1, approximately 76.92 percent of the respondents are female.
More than half of the students are 19-20 years of age (87.70%). The majority of
students (58.46%) have studied English 5-10 years.
2. The Six Categories of Strategies
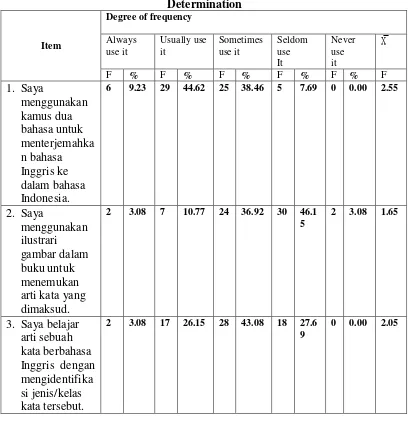
Table 4.1 Descriptive Statistics of Strategy Use in Individual Item of Determination
Item
Degree of frequency
Always arti kata yang dimaksud.
2 3.08 7 10.77 24 36.92 30 46.1 5
2 3.08 1.65
According to determination strategies, the results show that respondents
most frequently use the strategy item 1; “I use a bilingual dictionary to help me
translate into Thai language.” to find the meaning of new words (X̅ = 2.55).
Meanwhile, the least use strategy was item 2; “I use pictures illustrated in the
textbook to find the word meanings” (X̅ = 1.65).
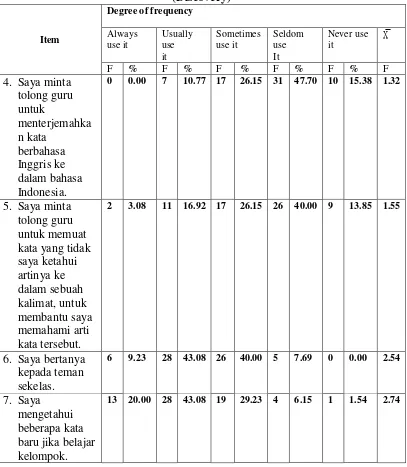
Table 4.2 Descriptive Statistics Use in Individual Item of Social Strategies (Discovery)
Item
Degree of frequency
Always kata yang tidak saya ketahui
6. Saya bertanya kepada teman baru jika belajar kelompok.
According to the frequency of social strategies for discovery, the results
show that to interact with other people in vocabulary learning, the strategy, which
the student use most frequently was item 7; “I know some new words when
working in group works .” (X̅ = 2.74). While the least used strategy was item 4; “I
ask the teacher to translate the words into Indonesian.” (X̅ = 1.32).
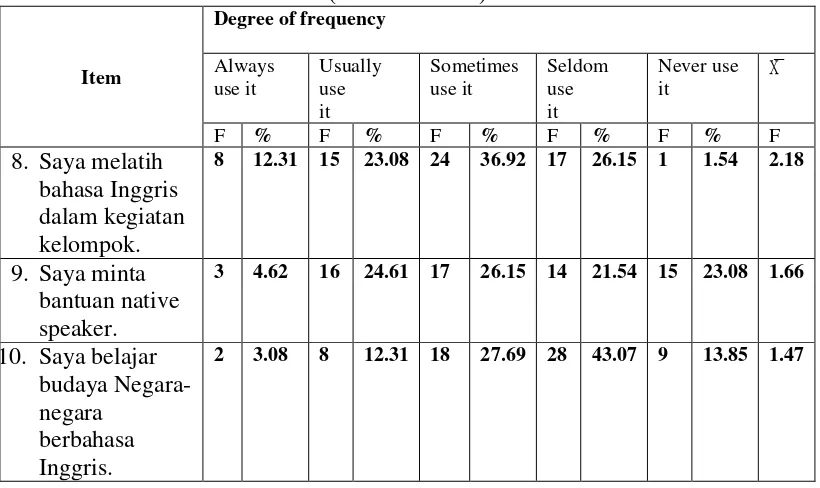
Table 4.3 Descriptive Statistics of Strategy Use in Individual Item of Social (Consolidation)
Item
Degree of frequency
Always
8. Saya melatih bahasa Inggris
10. Saya belajar budaya Negara-negara
berbahasa Inggris.
2 3.08 8 12.31 18 27.69 28 43.07 9 13.85 1.47
To promote vocabulary acquisition, the respondents use the Social
strategies for consolidation most frequently, by the item 8; “I practice English in
group work activities.” which had the highest mean score of 2.18. The strategy
which the respondents use least frequently was item 10; “I learn words about the
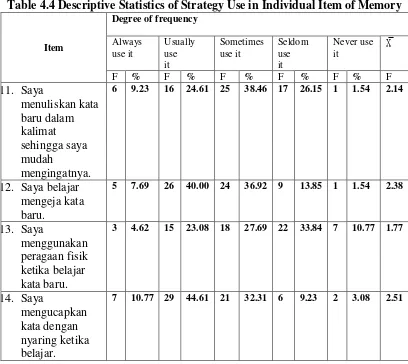
Table 4.4 Descriptive Statistics of Strategy Use in Individual Item of Memory
Item
Degree of frequency
Always
12. Saya belajar mengeja kata
respondents most frequently use for storing and retrieving new information was
item 14; “I speak words out loud when studying.” (X̅ = 2.51). Meanwhile the least
use strategy by the respondents was item 13; “I use physical actions when
Table 4.5 Descriptive Statistics of Strategy Use in Individual Item of Cognitive
Item
Degree of frequency
Always
15. Saya berulang kali melatih kata baru.
7 10.77 37 56.92 18 27.69 3 4.62 0 0.00 2.74
16. Saya menulis kata baru dalam sebuah flash card agar saya bisa
mengingatnya.
4 6.15 16 24.61 5 7.69 18 27.69 12 18.46 1.42
17. Saya belajar vocabulary
18. Saya mencatat vocabulary dari
19. Ketika saya mencoba untuk
Table 4.5 shows that to develop automatic vocabulary retrieval, the
Cognitive strategy that the students use most frequently, was item 15; “I
repeatedly practice new words.” (X̅ =2.74), while the strategy “I make vocabulary
cards and take them with me wherever I go.” was least used (X̅ = 1.29).
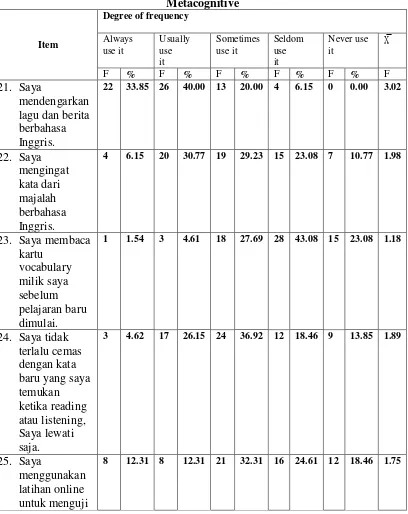
Table 4.6 Descriptive Statistics of Strategy Use in Individual Item of Metacognitive
Item
Degree of frequency
Always lagu dan berita berbahasa
pengetahuan vocabulary saya.
Table 4.6 shows the results of the most frequently use strategy of
Metacognitive was the item 21; “I listen to English songs and news.” by the
respondents (X̅ =3.02), while the item 23; “I review my own English vocabulary
cards for reviewing before the next lesson starts.” was least used (X̅ =1.18).
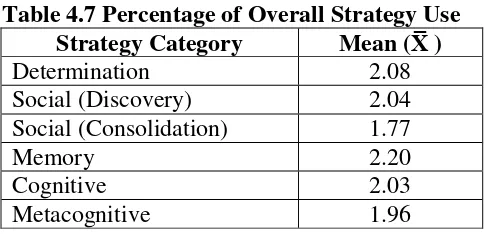
3. The Result of Vocabulary Learning Strategies
The findings show that in six categories, the respondents most frequently
use Memory at the highest mean score (2.20). Meanwhile the least use strategies
are Social (Consolidation) strategies with the lowest mean score (1.77).
Table 4.7 Percentage of Overall Strategy Use Strategy Category Mean (X̅ )
Determination 2.08
Social (Discovery) 2.04
Social (Consolidation) 1.77
Memory 2.20
Cognitive 2.03
Metacognitive 1.96
B. Data Description
As mentioned in the research methodology, to get the data, the writer
conducted a research by giving a questionnaire about students’ vocabulary
learning strategies to 65 students as a sample. After the data were collected, the
researcher analyzed them to know what are the vocabulary learning strategies
used by the students mostly. Second, to get the data about students’ vocabulary
test score, the researcher gave the students’ vocabulary test. Finally, after the
strategies and students’ vocabulary size by applying the formula of Pearson
Product Moment Correlation.
1) Students’ VLS Score
The findings show that in six categories, the respondents most frequently
use Memory at the highest mean score (2.20). Meanwhile the least use strategies
are Social (Consolidation) strategies with the lowest mean score (1.77).
Based on the calculation of variable Y was found ΣY=3305 and
ΣX2=175153.
2) Students’ Vocabulary Test Score
After the researcher has done the vocabulary test, the writer score to each
student by using the formula:
S = 𝑛
𝑁 x 100
Where:
S = students’ score
n = number of true answer
N = number of test items.
Based on the calculation of variable Y was found ΣY=4462 and
3) To find out the average score of the students’ vocabulary learning
Strategies, the writer will use the formula as bellow:
𝑀 = 𝑥
𝑁
Where:
M = mean
X = the Sun of Score
N = number of the students.
It is known that:
M = mean
X = 3305
N = 65
So, it can be counted as bellow:
𝑀 = 𝑥
𝑁
𝑀 =3305 65
𝑀 = 50.85
So, the average score of the students, mastery of English vocabulary was
50.85.
So, based on the valuation scale used in Islamic State Institute of Palangka
Raya, the average score of the students’ vocabulary learning strategies of English
4) To find out the average score of the students’ vocabulary size, the writer
will use the formula as bellow:
𝑀 = 𝑥
𝑁
Where:
M = mean
X = the Sun of Score
N = number of the students.
It is known that:
M = mean
X = 4462
N = 65
So, it can be counted as bellow:
𝑀 = 𝑥
𝑁
𝑀 =4462 65
𝑀 = 68.65
So, the average score of the students, mastery of English vocabulary was
68.65.
So, based on the valuation scale used in Islamic State Institute of Palangka
Raya, the average score of the students’ vocabulary size of English Department
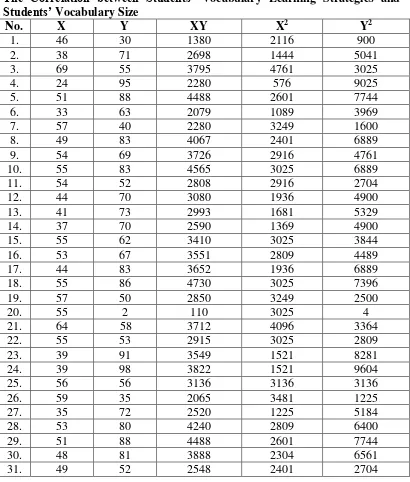
Below are the result of questionnaire about students’ vocabulary learning
strategies and their vocabulary size test score:
Table 4.8
The Students’ Vocabulary Learning Strategies and Their Vocabulary size test Score
No.
Student’s Name Questionnaire Result (X)
21. Ferrantika Mutiara
Riduan 34. Muhammad
Takdir 59 79
35. Nana Apriliana 43 84
36. Nida Soraya 50 38
37. Niny Ayu Dyah 75 89
38. Nor Hidayatullah 71 68
39. Novita Sari 50 81
40. Nur Halifah 61 68
41. Putri Rafa Salihah 62 81
42. Rahmalia 54 50
43. Ratih Heriyati 46 91
44. Raudatul Janah 44 66
45. Rifan Nuari 51 94
46. Rima Amelia
Agustin 38 56
47. Rini Andriani 61 86
48. Riska Hariyanti 43 61
49. Rizka kartika
Utami 48 70
50. Rizki Rahma 38 80
51. Rusmaya Nurlinda 45 57
52. Sauti 47 77
53. Siti Fatimah 46 31
54. Siti Hadijah 35 79
55. Siti Patimah 72 52
56. Sri Tumika 40 91
57. Sukirman 34 89
58. Susi Munawaroh 59 76
59. Susi
Widianingsing 52 62
60. Teguh irwansyah 44 84
61. Tities Tri Wuryani 64 63
62. Umratul Janah 50 80
63. Winda Normilani 67 71
64. Yoyi Sanusita
Susanti 66 44
65. Yulianti 65 67
5) The Correlation between Students’ Vocabulary Learning Strategies and
Students’ Vocabulary Size
In this case, both the students’ vocabulary learning strategies and students’
size are related by using Pearson Product moment formula. The data are described
on the following table:
Table 4.9
The Correlation between Students’ Vocabulary Learning Strategies and Students’ Vocabulary Size
32. 59 81 4779 3481 6561
From the calculation of variable X and Y, It was known that: ΣX=3305
Based on the calculation of correlation between variable X and variable Y
above, it can be known of each variable. Based on the product moment will be
found the product of
r
xy, as follow:r
xy=
N XY-( X)( Y)
(N X2-( X)2 N Y2-( Y)2
r
xy=65 𝑥 223728− 3305 (5562 )
{(65 𝑥 175153−(3305)2}{(65 𝑥 328326−(4462 )2}
r
xy=14542320−14746910
11384945−10923025 (21341190−19909444 )
r
xy=− 204590
461920 (1431746 )
r
xy=− 204590 661352112320
r
xy=− 204590 813235 ,5823007255
r
xy= − 0.25df = N – nr
= 65 – 2
From the calculation above, it was known that rxy = − 0.25 and df = 63; if
we compare with table of “r” values at the degree significance of 5% and 1%, this
indicates weak negative correlation between students’ vocabulary learning
strategies and their vocabulary size (rxy : rt = − 0.25 < 0.254 ; rxy : rt = − 0.25 <
0.330).
To summarize the result of the correlation is listed below:
“r” value of product
moment
Interpretation
0.00 – 0.20 Considered as no correlation
0.20 – 0.40 Low Correlation
0.40 – 0.60 Medium Correlation
0.60 – 0.80 Strong Correlation
0.80 – 1.00 Very strong/perfect Correlation
Based on the table above it can be seen that the correlation index (rxy = −
0.25) is in the interval of (-0.20) – (-0.40), this means that the correlation belongs
to “low correlation”. In other words, there is no correlation between variable X
and variable Y. As mentioned before, from the result of calculation, the value of
rxy is − 0.25; df is 63. If it is compared with the rt at the degree of significance
5% (0.254) and 1% (0.330), the correlation between students’ vocabulary
strategies and students’ vocabulary size score is nothing correlation (rxy : rt = −
0.25 < 0.254 ; rxy : rt = − 0.25 < 0.330). So, the null hypothesis (H0) of the
research is accepted and alternative hypothesis (Hα) is rejected. The meaning of
this statement is the students’ vocabulary strategies did not has relationship or
And then to know the contribution of the variable X to the variable Y is used
the formula as below:
KP = r2 x 100 %
Where:
KP = Nilai Koefisien Determinan (determinant coefficient score)
r = Nilai koefisien korelasi (correlation coefficient score)
KP = - 0.252 x 100 %
KP = 0.0625 x 100 %
KP = 0.004 %
So, it means that the variable X (vocabulary learning strategies) gives the
contribution to the students’ vocabulary size for the English Department students
on Academic years 2013 was 0.004 % and 99.996 % is influenced by the other
aspects.
To know the value of tvalue is used the formula:
tvalue= 𝑟 𝑛−2 𝑛−𝑟2
Where:
tvalue = nilai t (value t)
r = the score of coefficient correlation and
n = the number of sample.
The criteria of the test:
If tvalue ≥ ttable so refused Ho, it means it is significant and
So that by the formula above it was known that:
𝑟= −0.25
𝑛 = 65
tvalue= 𝑟 𝑛−2 𝑛−𝑟2
tvalue= −0.25 65−2
65−(−0.25)2
tvalue= −1.9843135
8.0583807
tvalue= −0.25
Based on the calculation above, α = 0.05 and n = 65 so, df = n - 2 = 65 – 2 =
63 and ttable was 1.671.
So, it can be seen than tvalue ≤ ttable, so that the result was the Ho is
accepted and Ha is refused. In this case that variable X vocabulary learning
strategies does not have relationship or influence to students’ vocabulary size, and
many others aspect can influence the students’ vocabulary size and help the
students to enrich their vocabulary size.
C. Discussion
From the description of the data, this indicates no correlation between
students’ vocabulary learning strategies and their vocabulary size. It means that
the higher various in vocabulary learning strategies, did not guaranty the better
This means that students who have the higher various in vocabulary learning
strategies try to pursue knowledge more than those who have the low one. They
enjoy their learning. They always feel happy and ready to do any task given by the
teacher. They do not only learn speaking in school but also out of the school.
They try to practice what they learn at school to the outside of the school.
There is a common tendency to think that correlation between variables
means that one causes or influences the change in the other one. However,
correlation does not imply causation. There may be an unknown factor that