NUTRIENT ADEQUACY
OF EXCLUSIVE
BREASTFEEDING
FOR THE TERM INFANT
DURING THE FIRST
through its extensive programme of publications.
The Organization seeks through its publications to support national health strategies and address the most pressing public health concerns of populations around the world. To respond to the needs of Member States at all levels of development, WHO publishes practical manuals, handbooks and training material for specific categories of health workers; internationally applicable guidelines and standards; reviews and analyses of health policies, programmes and research; and state-of-the-art consensus reports that offer technical advice and recommendations for decision-makers. These books are closely tied to the Organization’s priority activities, encompassing disease prevention and control, the development of equitable health systems based on primary health care, and health promotion for individuals and communities. Progress towards better health for all also demands the global dissemination and exchange of information that draws on the knowledge and experience of all WHO’s Member countries and the collaboration of world leaders in public health and the biomedical sciences.
NUTRIENT ADEQUACY OF
EXCLUSIVE BREASTFEEDING FOR
THE TERM INFANT DURING THE
FIRST SIX MONTHS OF LIFE
NANCY F. BUTTE, PHD
USDA/ARS Children’s Nutrition Research Center, Department of Pediatrics,
Baylor College of Medicine, Houston, TX, USA
MARDIA G. LOPEZ-ALARCON, MD, PHD
Nutrition Investigation Unit, Pediatric Hospital, CMN, Mexico City, Mexico
CUTBERTO GARZA, MD, PHD
Butte, Nancy F.
Nutrient adequacy of exclusive breastfeeding for the term infant during the first six months of life / Nancy F. Butte, Mardia G. Lopez-Alarcon, Cutberto Garza.
1.Breastfeeding 2.Milk, Human – chemistry 3.Nutritive value 4.Nutritional requirements 5.Infant I.Lopez-Alarcon, Mardia G. II.Garza, Cutberto III.Expert Consultation on the Optimal Duration of Exclusive Breastfeeding (2001 : Geneva, Switzerland) IV.Title.
ISBN 92 4 156211 0 (NLM Classification: WS 125)
© World Health Organization 2002
All rights reserved. Publications of the World Health Organization can be obtained from Marketing and Dissemination, World Health Organization, 20 Avenue Appia, 1211 Geneva 27, Switzerland (tel: +41 22 791 2476; fax: +41 22 791 4857; email: [email protected]). Requests for permission to reproduce or translate WHO publications – whether for sale or for non-commercial distribution – should be addressed to Publications, at the above address (fax: +41 22 791 4806; email: [email protected]).
The designations employed and the presentation of the material in this publication do not imply the expression of any opinion whatsoever on the part of the World Health Organization concerning the legal status of any country, territory, city or area or of its authorities, or concerning the delimitation of its frontiers or boundaries. Dotted lines on maps represent approximate border lines for which there may not yet be full agreement.
The mention of specific companies or of certain manufacturers’ products does not imply that they are endorsed or recommended by the World Health Organization in preference to others of a similar nature that are not mentioned. Errors and omissions excepted, the names of proprietary products are distinguished by initial capital letters.
The World Health Organization does not warrant that the information contained in this publication is complete and correct and shall not be liable for any damages incurred as a result of its use.
The named authors alone are responsible for the views expressed in this publication.
Contents
R E F E R E N C E SAbbreviations & acronyms v
Foreword vii
Executive summary 1
1. Conceptual framework 3
1.1 Introduction 3
1.2 Using ad libitum intakes to assess adequate nutrient levels 3
1.3 Factorial approaches 4
1.4 Balance methods 5
1.5 Other issues 6
1.5.1 Morbidity patterns 6
1.5.2 Non-continuous growth 6
1.5.3 Estimating the proportion of a group at risk for specific nutrient deficiencies 6
1.5.4 Summary 7
2. Human-milk intake during exclusive breastfeeding in the first year of life 8
2.1 Human-milk intakes 8
2.2 Nutrient intakes of exclusively breastfed infants 8
2.3 Duration of exclusive breastfeeding 8
2.4 Summary 14
3. Energy and specific nutrients 15
3.1 Energy 15
3.1.1 Energy content of human milk 15
3.1.2 Estimates of energy requirements 15
3.1.3 Summary 15
3.2 Proteins 16
3.2.1 Dietary proteins 16
3.3 Vitamin A 22
3.3.1 Introduction 22
3.3.2 Vitamin A in human milk 22
3.3.3 Estimates of vitamin A requirements 23
3.3.4 Plasma retinol 23
3.3.5 Functional end-points 24
3.3.6 Summary 26
3.4 Vitamin D 26
3.4.1 Introduction 26
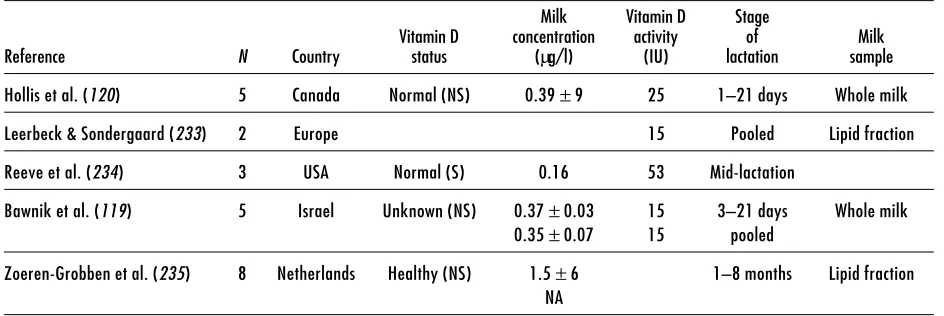
3.4.2 Factors influencing the vitamin D content of human milk 26
3.4.3 Estimates of vitamin D requirements 27
3.4.4 Vitamin D status and rickets 29
3.4.5 Vitamin D and growth in young infants 29
3.4.6 Vitamin D and growth in older infants 30
3.4.7 Summary 30
3.5 Vitamin B6 30
3.5.1 Introduction 30
3.5.2 Vitamin B6 content in human milk 30
3.5.3 Approaches used to estimate vitamin B6 requirements 31
3.5.4 Estimates of requirements 31
3.5.5 Vitamin B6 status of breastfed infants and lactating women 31
3.5.6 Growth of breastfed infants in relation to vitamin B6 status 32
3.5.7 Summary 32
3.6 Calcium 32
3.6.1 Human milk composition 32
3.6.2 Estimates of calcium requirements 32
3.6.3 Summary 33
3.7 Iron 34
3.7.1 Human milk composition 34
3.7.2 Estimates of iron requirements 34
3.7.3 Summary 35
3.8 Zinc 35
3.8.1 Human milk composition 35
3.8.2 Estimates of zinc requirements 35
3.8.3 Summary 37
R E F E R E N C E S
Abbreviations & acronyms
AI Adequate intake
BMD Bone mineral density
BMC Bone mineral content
CDC Centers for Disease Control and Prevention (USA)
DPT Triple vaccine against diphtheria, pertussis and tetanus
DXA Dual-energy X-ray absorptiometry
EAR Estimated average requirement
EAST Erythrocyte aspartate transaminase
EPLP Erythrocyte pyridoxal phosphate
ESPGAN European Society of Paediatric Gastroenterology
FAO Food and Agriculture Organization of the United Nations
IDECG International Dietary Energy Consultative Group
IU International units
NCHS National Center for Health Statistics (USA)
NPN Non-protein nitrogen
PLP Pyridoxal phosphate
PMP Pyridoxamine phosphate
PNP Pyridoxine phosphate
PTH Parathyroid hormone
RE Retinol equivalents
SD Standard deviation
SDS Standard deviation score
UNICEF United Nations Children’s Fund
UNU United Nations University
Foreword
This review, which was prepared as part of the back-ground documentation for a WHO expert consultation,1 evaluates the nutrient adequacy of exclusive breast-feeding for term infants during the first 6 months of life. Nutrient intakes provided by human milk are compared with infant nutrient requirements. To avoid circular arguments, biochemical and physiological methods, independent of human milk, are used to define these requirements.
The review focuses on human-milk nutrients, which may become growth limiting, and on nutrients for which there is a high prevalence of maternal dietary deficiency in some parts of the world; it assesses the adequacy of energy, protein, calcium, iron, zinc, and vitamins A, B6, and D. This task is confounded by the fact that the physiological needs for vitamins A and D, iron, zinc – and possibly other nutrients – are met by the combined availability of nutrients in human milk and endogenous nutrient stores.
In evaluating the nutrient adequacy of exclusive breast-feeding, infant nutrient requirements are assessed in terms of relevant functional outcomes. Nutrient
adequacy is most commonly evaluated in terms of growth, but other functional outcomes, e.g. immune response and neurodevelopment, are also considered to the extent that available data permit.
This review is limited to the nutrient needs of infants. It does not evaluate functional outcomes that depend on other bioactive factors in human milk, or behaviours and practices that are inseparable from breastfeeding, nor does it consider consequences for mothers. In determining the optimal duration of exclusive breast-feeding in specific contexts, it is important that func-tional outcomes, e.g. infant morbidity and mortality, also are taken into consideration.
The authors would like to thank the World Health Organization for the opportunity to participate in the expert consultation;1 and Nancy Krebs, Kim Michaelson, Sean Lynch, Donald McCormick, Paul Pencharz, Mary Frances Picciano, Ann Prentice, Bonny Specker and Barbara Underwood for reviewing the draft manuscript. They also express special appreciation for the financial support provided by the United Nations University.
1 Expert consultation on the optimal duration of exclusive
Executive summary
The dual dependency on exogenous dietary sources and endogenous stores to meet requirements needs to be borne in mind particularly when assessing the adequacy of iron and zinc in human milk. Human milk, which is a poor source of iron and zinc, cannot be altered by maternal supplementation with these two nutrients. It is clear that the estimated iron requirements of infants cannot be met by human milk alone at any stage of infancy. The iron endowment at birth meets the iron needs of the breastfed infant in the first half of infancy, i.e. 0 to 6 months. If an exogenous source of iron is not provided, exclusively breastfed infants are at risk of becoming iron deficient during the second half of infancy. Net zinc absorption from human milk falls short of zinc needs, which appear to be subsidized by prenatal stores.
In the absence of studies specifically designed to evaluate the time at which prenatal stores become depleted, circumstantial evidence has to be used. Available evidence suggests that the older the exclusively breastfed infant the greater the risk of specific nutrient deficiencies.
The inability to estimate the proportion of exclusively breastfed infants at risk of specific deficiencies is a major drawback in terms of developing appropriate public health policies. Conventional methodologies require that a nutrient’s average dietary requirement and its distribution are known along with the mean and distribution of intakes and endogenous stores.
Moreover, exclusive breastfeeding at 6 months is not a common practice in developed countries, and it is rarer still in developing countries. There is a serious lack of measurement, which impedes evaluation, of the human-milk intakes of 6-month-old exclusively breastfed
E X E C U T I V E S U M M A R Y
In this review nutrient adequacy of exclusive breastfeeding is most commonly evaluated in terms of growth. Other functional outcomes, e.g. immune response and neurodevelopment, are considered when data are available. The dual dependency on exogenous dietary sources and endogenous stores for meeting requirements is also considered in evaluating human milk’s nutrient adequacy. When evaluating the nutrient adequacy of human milk, it is essential to recognize the incomplete knowledge of infant nutrient requirements in terms of relevant functional outcomes. Particularly evident is the inadequacy of crucial data for evaluating the nutrient adequacy of exclusive breastfeeding for the first 4 to 6 months.
Mean intakes of human milk provide sufficient energy and protein to meet mean requirements during the first 6 months of infancy. Since infant growth potential drives milk production, the distribution of intakes likely matches the distribution of energy and protein requirements.
The adequacy of vitamin A and vitamin B6 in human milk is highly dependent upon maternal diet and nutritional status. In well-nourished populations the amounts of vitamins A and B6 in human milk are adequate to meet the requirements for infants during the first 6 months of life. In populations deficient in vitamins A and B6, the amount of these vitamins in human milk will be sub-optimal and corrective measures are called for, either through maternal and/or infant supplementation, or complementary feeding for infants.
cultural factors influencing the timing of supplemen-tation of the breastfed infant’s diet is an important part of advocating a globally uniform infant-feeding policy that accurately weighs both this policy’s benefits and possible negative outcomes.
It is important to recognize that this review is limited to the nutrient needs of infants. No attempt has been made to evaluate functional outcomes that depend on other bioactive factors in human milk, or behaviours and practices that are inseparable from breastfeeding. Neither have the consequences, positive or negative,
for mothers been considered. It is important that functional outcomes, e.g. infant morbidity and mortality, be taken carefully into account in determining the optimal duration of exclusive breastfeeding in specific environments.
This review was prepared parallel to, but separate from, a systematic review of the scientific literature on the optimal duration of exclusive breastfeeding.1 These assessments served as the basis for discussion during an expert consultation (Geneva, 28–30 March 2001), whose report is found elsewhere.2
1 Kramer MS, Kakuma R. The optimal duration of exclusive
breastfeeding: a systematic review. Geneva, World Health Organization, document WHO/NHD/01.08–WHO/FCH/CAH/ 01.23, 2001.
2 The optimal duration of exclusive breastfeeding: report of an expert
1. Conceptual framework
A and D, and zinc). It is becoming increasingly clear that this is likely the case for iron, zinc and possibly calcium. Calcium is included because the physiological significance of the transient lower bone mineral content observed in breastfed infants, compared to their formula-fed counterparts, is not understood. Assessing nutrient needs without acknowledging this dual dependency likely leads to faulty conclusions.
To make matters yet more complicated, it is clear that there is a range between clear deficiency and “optimal” adequacy within which humans adapt. The closer one is to deficiency within that range, the more vulnerable one is to common stresses (e.g. infections) and the less one is able to meet increased physiological demands (e.g. growth spurts). Perhaps the best examples of the conceptual difficulties that arise due to the capacity of humans to “adapt” to a range of intakes are debates that swirl around the “small is beautiful” proposition and the “adaptation to lower energy intakes” viewpoint. The former has been discredited fairly conclusively while the latter has been abandoned in recent estimates of energy needs; this is in recognition of the fact that humans can adapt to a range of energy intakes, but at a cost whenever there are sustained deviations from requirement levels (2, 3). Thus, energy requirements are estimated on the basis of multiples of basal metabolic rate to ensure that needs are met for both maintenance and socially acceptable and necessary levels of physical activity (3).
1.2
Using ad libitum intakes to assess
adequate nutrient levels
The paucity of available functional measures of optimal
1 . C O N C E P T U A L F R A M E W O R K
1.1
Introduction
Dietary surveys of presumably healthy populations, factorial approaches (summing needs imposed by growth and maintenance requirements), and balance techniques (measuring “inputs and outputs”) are the methods used most often to estimate nutrient requirements. None are particularly satisfactory because they seldom adequately address growing concerns that nutrient intakes support long-term health and optimal functional capacities rather than just avoid acute deficiency states. These concerns are most evident when considering the nutrient needs of infants because of the paucity of data for estimating most nutrient requirements and the limited number of functionally relevant outcome measures for this age group. As these limitations apply to nearly all the sections that follow, they will not be repeated.
assumed. Data on day-to-day variability for either measure are available for only a few studies. The most notable exceptions to these generalities are require-ment estimates for energy (4), protein (5) and iron (6). Factorial approaches are used most commonly to estimate average requirements for energy and these two nutrients.
Generally speaking, estimates of nutrient requirements for the first year of life are based on measured intakes of human milk during the first 6 months. Estimated needs during the second 6 months are sometimes determined by extrapolating from these intake measures. The reasons for selecting the first 6 months appear arbitrary. One can offer physiological milestones as a reason for selecting this age, e.g. changes in growth velocities, stability in nutrient concentrations in human milk, disappearance of the extrusion reflex, teething, and enhanced chewing capabilities. However, the variability in the ages at which these milestones are reached is far greater than the specificity that the cut-off suggests.
As noted above, growth may be used to justify selecting the first 6 months as a basis for estimating nutrient requirements, although its use this way has severe limitations. Waterlow & Thomson (7), for example, concluded that exclusive breastfeeding sustained normal growth for only approximately 3 months. WHO and others have questioned the present international reference used to reach this and other conclusions related to the maintenance of adequate growth (8). At present, there is no universally accepted reference or standard that is used for assessing the normality of either attained growth or growth velocity in infants. In the absence of such a reference or standard, rationales used in this review that rely on growth are based on WHO data (8) for attained growth and growth velocity.
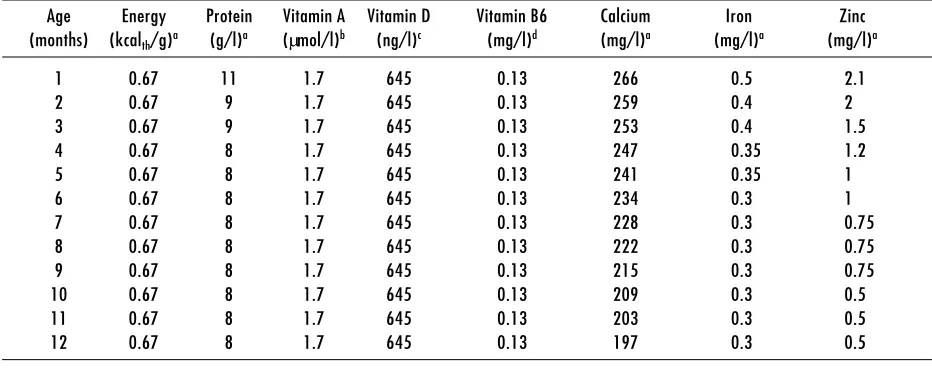
The composition of human milk changes dramatically in the postpartum period as secretions evolve from colostrum to mature milk. The stages of lactation correspond roughly to the following times postpartum: colostrum (0–5 days), transitional milk (6–14 days), and mature milk (15–30 days). Changes in human-milk composition are summarized in Table 1. The first 3 to 4 months of lactation appear to be the period of most rapid change in the concentrations of most nutrients. After that period nutrient concentrations appear to be fairly stable as long as mammary gland involution has not begun (9, 10). However, few studies assess the dietary and physiological factors that determine either the rate of change in nutrient concentrations or inter-individual variability. Intake data appearing in subsequent sections are presented in monthly intervals.
All intake estimates are derived from nutrient concentrations and human-milk volumes obtained in studies of self-selected or opportunistic populations. In no case are randomly representative data available for these types of assessments. When data are available, variability of milk volume and composition are estimated by pooled weighted variances of specific studies cited for each nutrient. Unless otherwise stated only studies of “exclusively” or “predominantly” breastfed infants were used to make these estimates.
To the extent possible no cross-sectional data of milk volumes and milk composition have been used in subsequent sections in order to minimize self-selection biases that such data present (11). However, it should be noted that most longitudinally designed studies have significant attrition rates as lactation progresses. Thus, these data also present special problems that are difficult to overcome.
1.3
Factorial approaches
Factorial approaches are generally based on estimates of maintenance needs, nutrient accretion that accompanies growth, measures of digestibility and/or absorption (bioavailability), and utilization efficiency. The sum of maintenance needs and accretion could be used to estimate requirement levels if dietary nutrients were absorbed and utilized with 100% efficiency. Since this does not occur, however, the sum is corrected to account for absorption rates and utilization efficiency.
Generally speaking, with the exception of protein, only maintenance, bioavailability and accretion rates will be of concern in the application of factorial approaches that target nutrient needs of exclusively human-milk fed infants. Thus, again with the exception of protein, in the sections that follow the efficiency of utilization of absorbed nutrients will be assumed to be 100%. The utilization of absorbed nutrients is determined by the nutrient’s biological value, which relates to the efficiency with which a target nutrient (e.g. protein) is assimilated or converted to some functionally active form (e.g. efficiency of use of β-carotene compared to retinol).
measure of energy maintenance needs. There are no unassailable estimates of protein maintenance needs of infants, whether or not breastfed, nor, for that matter, are there reliable estimates for any other nutrient. In adults, endogenous losses are estimated from data collected under conditions that limit the target nutrient’s content in the diet to approximately zero.
Accretion rates are related to nutrient accumulations that accompany growth. In infancy, these rates are estimated from measured growth velocities and estimates of the composition of tissues gained as part of growth.
Bioavailability generally relates to the availability of nutrients for intestinal absorption (e.g. of ferric versus ferrous iron and the various forms of calcium commonly found in foodstuffs). The determinants of absorption are too nutrient-specific to be considered in this general introduction. Generally, the host’s physiological state and the physical characteristics of nutrients as consumed are among the principal determinants of absorption.
iron absorption rates are affected by the status of iron stores. For iron and other minerals, endogenous or unavoidable losses and the bioavailability of dietary sources are measurable simultaneously by multiple-tracer stable-isotope methods. Because these measurements are made at nutrient intakes above zero, estimates of bioavailability and endogenous losses include the unavoidable inefficiencies in both absorption and utilization that are incurred as intakes rise.
1.4
Balance methods
Balance methodologies also have been used to estimate nutrient needs and utilization. The general strengths and weaknesses of balance methods have been reviewed extensively and thus will not be repeated (12). For present purposes it is sufficient to acknowledge two characteristics of balance methods. The first is that their interpretation often relies heavily on estimates derived by factorial approaches, that is the appropriateness of retained quantities of target nutrients is determined by
1 . C O N C E P T U A L F R A M E W O R K
Table 1. Human milk composition
Age Energy Protein Vitamin A Vitamin D Vitamin B6 Calcium Iron Zinc (months) (kcalth/g)a (g/l)a (µmol/l)b (ng/l)c (mg/l)d (mg/l)a (mg/l)a (mg/l)a
1 0.67 11 1.7 645 0.13 266 0.5 2.1
2 0.67 9 1.7 645 0.13 259 0.4 2
3 0.67 9 1.7 645 0.13 253 0.4 1.5
4 0.67 8 1.7 645 0.13 247 0.35 1.2
5 0.67 8 1.7 645 0.13 241 0.35 1
6 0.67 8 1.7 645 0.13 234 0.3 1
7 0.67 8 1.7 645 0.13 228 0.3 0.75
8 0.67 8 1.7 645 0.13 222 0.3 0.75
9 0.67 8 1.7 645 0.13 215 0.3 0.75
10 0.67 8 1.7 645 0.13 209 0.3 0.5
11 0.67 8 1.7 645 0.13 203 0.3 0.5
12 0.67 8 1.7 645 0.13 197 0.3 0.5
underestimating losses is much likelier than estimating them (i.e. it is easier to under- than to over-collect urine, faeces and skin losses).
1.5
Other issues
1.5.1 Morbidity patterns
Three other issues should also be considered, the first of which is the estimation of common morbidity patterns. Although estimates of nutrient requirements reflect needs during health, it is increasingly recognized that accumulated deficits resulting from infections – due to decreased intakes and increased metabolic needs and losses – must be replenished during convalescence. Thus, it is generally important to consider safety margins in estimating nutrient needs. In the case of exclusive breastfeeding, the estimates presented below assume that infants will demand additional milk to redress accumulated energy deficits, that the nursing mother is able to respond to these increased demands, and that the increased micronutrient and protein intakes accompanying transient increases in total milk intake correct shortfalls accumulated during periods of illness. These assumptions are based on the generally recognized well-being of successfully breastfed infants, who experience occasional infections and live under favourable conditions. We recognize that no direct data are available to evaluate these assumptions under less favourable circumstances and that not enough is known to estimate the effects of possible constraints on maternal abilities to respond to transient increased demands by infants or constraints imposed by inadequate nutrient stores.
1.5.2 Non-continuous growth
The second issue is the possibility of non-continuous growth evaluated by Lampl, Veldhuis & Johnson (13). Estimates of nutrient needs based on factorial approaches assume steady, continuous growth. The literature reports observations in support of the possibility that growth occurs in spurts during infancy. Non-continuous growth’s potential demands on nutrient stores and/or exogenous intakes have not been examined sufficiently, and thus no allowance for “non-continuous” growth needs is made in these assessments.
1.5.3 Estimating the proportion of a group at risk for
specific nutrient deficiencies
The third issue relates to the challenges of estimating the proportion of exclusively breastfed infants at risk of specific nutrient deficiencies using either the “probability approach” (14) or the simplified estimated average requirement (EAR) cut-point method described by Beaton (15). The probability approach estimates the proportion of a target group at risk for a specific nutrient deficiency/inadequacy based on the distributions of the target group’s average estimated nutrient requirement and the group’s ad libitum intake of the nutrient of interest. To use this approach, intakes and requirements should not be correlated and the distributions of requirements and intakes should be known. The EAR cut-point method is a simplified application of the probability approach; it can be used to estimate the proportion of a population at risk when ad libitum intakes and requirements are not correlated, inter-individual variation in the EAR is symmetrically distributed around the mean, and variance of intakes is substantially greater than the variance of the EAR. The dependence of both approaches on a lack of correlation between intakes and requirements presents some difficulties to the extent that the energy intakes, nutrient requirements and ad libitum milk intakes of exclusively breastfed infants are related to each other. This difficulty arises because milk production is driven by the infant’s energy demands and by maternal abilities to meet them. Thus, as energy requirements rise, so should the intakes of all human-milk constituents.
The nature of the expected correlation can be illustrated by interrelationships between milk composition and energy and protein requirements imposed by growth. The protein-to-energy ratio of mature human milk is approximately 0.013 g protein/kcalth (16).1 The energy cost of growth is approximately 19 kcalth/kg, 12 kcalth/ kg, 9 kcalth/kg and 5 kcalth/kg for the age intervals 3–4 months, 4–5 months, 5–6 months and 6–9 months, respectively (4). To the degree that increased energy requirements imposed by growth drive increased human-milk consumption, the corresponding increase in protein intakes will be, respectively, 0.25, 0.15, 0.12 and 0.06 g protein/kg for the four above-mentioned age intervals. These values will increase to the extent that non-protein nitrogen (NPN) in human milk is utilizable (see section 3.2.3). The protein deposited per kg of body weight appears fairly stable, approximately 0.24 g/kg from 4 to 9 months of age (4). If we assume a net absorption rate of 0.85 for human-milk protein and an efficiency of dietary protein utilization of 0.73, the mean dietary protein requirement for growth is approximately
1 1000 kcal
0.39 g protein/kg (see section 3.2.3). Thus, although increased energy needs imposed by growth should simultaneously drive protein intakes upward, human milk becomes less likely to meet the infant’s need for protein unless energy requirements for activity increase in a manner that corrects the asynchrony described above. In the absence of such an adjustment, as long as human milk remains the only source of protein the growing infant becomes increasingly dependent upon stable or enhanced efficiencies in protein utilization. These types of correlations can be dealt with, in part, by suitable statistical techniques, as was demonstrated in the report of the International Dietary Energy Consultative Group (IDECG) evaluating protein and energy requirements (4, 5).
However, the challenges presented by relationships among milk intakes and micronutrient requirements and intakes are more problematic. Theoretically, the same type of relationship exists among energy and micronutrient intakes and requirements as described above for protein but with an added complication. As will be evident in the sections that follow, it is clear that physiological needs for vitamin A, vitamin D, iron, zinc and possibly other nutrients are met by the combined availability of nutrients from human milk and nutrient stores transferred from mother to infant during late gestation. Thus, dietary nutrient requirements vary with the adequacy of those stores. As a consequence there is inadequate information to estimate “true” physiological requirements (i.e. the optimal amounts of a nutrient that should be derived from human milk and from stores accumulated during gestation). We therefore have inadequate information to estimate what the dietary EAR is for any of the nutrients for which
there is a co-dependency on stores and an exogenous supply to meet physiological needs. Arriving at an EAR for specific nutrients based on the intakes of healthy breastfed infants assumes, by definition, “optimal” nutrient stores. However, this assumption grows progressively more precarious as the nutritional status of pregnant women becomes increasingly questionable.
1.5.4 Summary
None of the available methods for assessing the nutrient needs of infants are entirely satisfactory because they address only short-term outcomes rather than short- and longer-term consequences for health. Of particular concern is the heavy dependence of most methods on growth in the absence of acceptable references/standards of normal attained growth and velocity, and their normal variability. A similar observation can be made regarding the paucity of information on the causes of the high attrition occurring in nearly all longitudinal studies of exclusive breastfeeding in the period of interest, i.e. beyond the first 4 months of life. Similarly, poor understanding of the determinants of inter-individual variability in the nutrient content of human milk creates significant problems in assessing key questions related to the assessment of present methods for estimating nutrient requirements in the first year of life. The infant’s co-dependence on nutrient stores acquired during gestation and nutrients from human milk further complicates estimation of nutrient requirements. This is particularly vexing in applying methods for assessing population rates of inadequacy that require estimates of average nutrient requirements.
2. Human-milk intake during exclusive
breastfeeding in the first year of life
2.3
Duration of exclusive breastfeeding
Although reasons for supplementation are not always discernible from the literature, evidence to date clearly indicates that few women exclusively breastfeed beyond 4 months. Numerous socioeconomic and cultural factors influence the decision to supplement human milk, including medical advice, maternal work demands, family pressures and commercial advertising. Biological factors including infant size, sex, development, interest/ desire, growth rate, appetite, physical activity and maternal lactational capacity also determine the need and timing of complementary feeding. However, neither socioeconomic nor cultural nor biological factors have received adequate systematic attention.
In a longitudinal study in the USA, human-milk intake of infants was measured from 4 to 9 months through the transitional feeding period (26). Complementary feeding was started at the discretion of the mother in consultation with the child’s paediatrician. Forty-two per cent (19/45) of the infants were exclusively breastfed until 5 months of age, 40% (18/45) until 6 months, and 18% (8/45) until 7 months.
In a Finnish study (25), 198 women intended to breastfeed for 10 months. The number of exclusively breastfed infants was 116 (58%) at 6 months, 71 (36%) at 7.5 months, 36 (18%) at 9 months, and 7 (4%) at 12 months. The reason given for introducing complemen-tary feeding before the age of 4 to 6 months was the infant’s demand appeared greater than the supply of human milk. This was decided by the mother in 77 cases and by the investigators in 7 cases. Complementary feeding reversed the progressive decline in the standard deviation score (SDS) for length from −0.52 to −0.32 (p=0.07) during the 6 to 9-month period. These authors concluded that, although some infants can thrive on exclusive breastfeeding until 9 to 12 months of age, on a population level prolonged exclusive breastfeeding carries a risk of nutritional deficiency even in privileged populations.
In a study in the USA of growth and intakes of energy and zinc in infants fed human milk, despite intentions to exclusively breastfeed for 5 months, 23% of mothers added solids to their infant’s diet at 4.5 months; 55%
2.1
Human-milk intakes
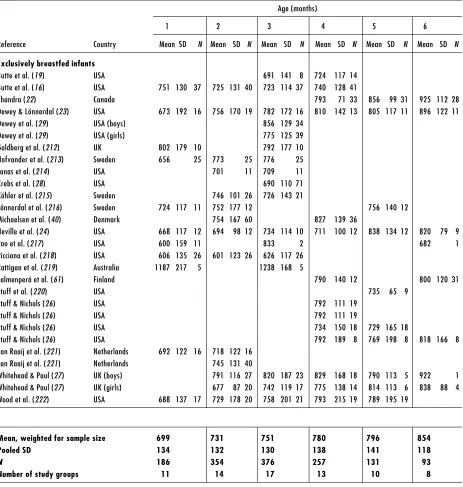
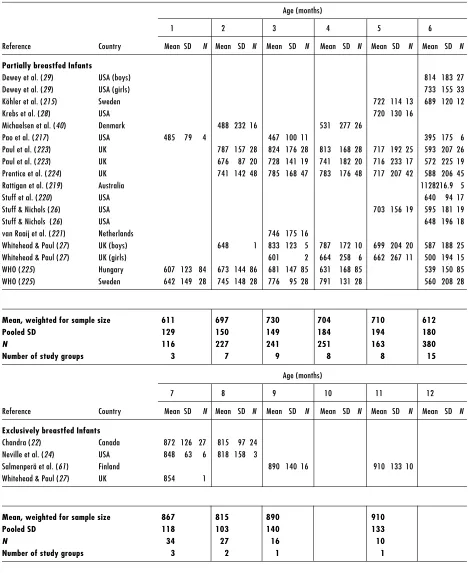
Human-milk intakes of exclusively and partially breastfed infants during the first year of life in developed and developing countries are presented in Table 2 and Table 3, respectively. Studies conducted in presumably well-nourished populations from developed countries and in under-privileged populations from developing countries in the 1980s–1990s were compiled. In most of these studies, human-milk intake was assessed using the 24-hour test-weighing method. However, the 12-hour test-weighing method (17, 18) and the deuterium dilution method (19–21) were also used in a few cases. If details were not provided in the publication regarding the exclusivity of feeding, partial breastfeeding was assumed. The overall mean human-milk intakes were weighted for sample sizes and a pooled standard deviation (SD) was calculated across studies.
Mean human milk intake of exclusively breastfed infants, reared under favourable environmental conditions, increases gradually throughout infancy from 699 g/day at 1 month, to 854 g/day at 6 months and to 910 g/day at 11 months of age. The mean coefficient of variation across all ages was 16% in exclusively breastfed infants compared to 34% in partially breastfed infants. Milk intakes among the partially breastfed hovered around 675 g/day in the first 6 months of life and 530 g/ day in the second 6 months.
There is a notable decrease in sample size in studies encompassing the transitional period from exclusive breastfeeding to partial breastfeeding (22–27).
2.2
Nutrient intakes of exclusively breastfed
infants
2 . H U M A N - M I L K I N T A K E D U R I N G E X C L U S I V E B R E A S T F E E D I N G I N T H E F I R S T Y E A R O F L I F E
Table 2. Human-milk intake of infants from developed countries
Age (months)
1 2 3 4 5 6
Reference Country Mean SD N Mean SD N Mean SD N Mean SD N Mean SD N Mean SD N
Exclusively breastfed infants
Butte et al. (19) USA 691 141 8 724 117 14 Butte et al. (16) USA 751 130 37 725 131 40 723 114 37 740 128 41
Chandra (22) Canada 793 71 33 856 99 31 925 112 28 Dewey & Lönnerdal (23) USA 673 192 16 756 170 19 782 172 16 810 142 13 805 117 11 896 122 11 Dewey et al. (29) USA (boys) 856 129 34
Dewey et al. (29) USA (girls) 775 125 39 Goldberg et al. (212) UK 802 179 10 792 177 10 Hofvander et al. (213) Sweden 656 25 773 25 776 25 Janas et al. (214) USA 701 11 709 11 Krebs et al. (28) USA 690 110 71 Köhler et al. (215) Sweden 746 101 26 726 143 21
Lönnerdal et al. (216) Sweden 724 117 11 752 177 12 756 140 12 Michaelsen et al. (40) Denmark 754 167 60 827 139 36
Neville et al. (24) USA 668 117 12 694 98 12 734 114 10 711 100 12 838 134 12 820 79 9
Pao et al. (217) USA 600 159 11 833 2 682 1
Picciano et al. (218) USA 606 135 26 601 123 26 626 117 26 Rattigan et al. (219) Australia 1187 217 5 1238 168 5
Salmenperä et al. (61) Finland 790 140 12 800 120 31
Stuff et al. (220) USA 735 65 9
Stuff & Nichols (26) USA 792 111 19 Stuff & Nichols (26) USA 792 111 19
Stuff & Nichols (26) USA 734 150 18 729 165 18
Stuff & Nichols (26) USA 792 189 8 769 198 8 818 166 8 van Raaij et al. (221) Netherlands 692 122 16 718 122 16
van Raaij et al. (221) Netherlands 745 131 40
Whitehead & Paul (27) UK (boys) 791 116 27 820 187 23 829 168 18 790 113 5 922 1 Whitehead & Paul (27) UK (girls) 677 87 20 742 119 17 775 138 14 814 113 6 838 88 4 Wood et al. (222) USA 688 137 17 729 178 20 758 201 21 793 215 19 789 195 19
Mean, weighted for sample size 699 731 751 780 796 854
Pooled SD 134 132 130 138 141 118
N 186 354 376 257 131 93
Table 2. Human-milk intake of infants from developed countries (continued)
Age (months)
1 2 3 4 5 6
Reference Country Mean SD N Mean SD N Mean SD N Mean SD N Mean SD N Mean SD N
Partially breastfed Infants
Dewey et al. (29) USA (boys) 814 183 27
Dewey et al. (29) USA (girls) 733 155 33
Köhler et al. (215) Sweden 722 114 13 689 120 12
Krebs et al. (28) USA 720 130 16
Michaelsen et al. (40) Denmark 488 232 16 531 277 26
Pao et al. (217) USA 485 79 4 467 100 11 395 175 6 Paul et al. (223) UK 787 157 28 824 176 28 813 168 28 717 192 25 593 207 26 Paul et al. (223) UK 676 87 20 728 141 19 741 182 20 716 233 17 572 225 19 Prentice et al. (224) UK 741 142 48 785 168 47 783 176 48 717 207 42 588 206 45
Rattigan et al. (219) Australia 1128216.9 5
Stuff et al. (220) USA 640 94 17
Stuff & Nichols (26) USA 703 156 19 595 181 19
Stuff & Nichols (26) USA 648 196 18
van Raaij et al. (221) Netherlands 746 175 16
Whitehead & Paul (27) UK (boys) 648 1 833 123 5 787 172 10 699 204 20 587 188 25 Whitehead & Paul (27) UK (girls) 601 2 664 258 6 662 267 11 500 194 15 WHO (225) Hungary 607 123 84 673 144 86 681 147 85 631 168 85 539 150 85 WHO (225) Sweden 642 149 28 745 148 28 776 95 28 791 131 28 560 208 28
Mean, weighted for sample size 611 697 730 704 710 612
Pooled SD 129 150 149 184 194 180
N 116 227 241 251 163 380
Number of study groups 3 7 9 8 8 15
Age (months)
7 8 9 10 11 12
Reference Country Mean SD N Mean SD N Mean SD N Mean SD N Mean SD N Mean SD N
Exclusively breastfed Infants
Chandra (22) Canada 872 126 27 815 97 24 Neville et al. (24) USA 848 63 6 818 158 3
Salmenperä et al. (61) Finland 890 140 16 910 133 10 Whitehead & Paul (27) UK 854 1
Mean, weighted for sample size 867 815 890 910
Pooled SD 118 103 140 133
N 34 27 16 10
2 . H U M A N - M I L K I N T A K E D U R I N G E X C L U S I V E B R E A S T F E E D I N G I N T H E F I R S T Y E A R O F L I F E
Table 2. Human-milk intake of infants from developed countries (continued)
Age (months)
7 8 9 10 11 12
Reference Country Mean SD N Mean SD N Mean SD N Mean SD N Mean SD N Mean SD N
Partially breastfed Infants
Dewey et al. (43) USA 875 142 8 834 99 7 774 180 5 691 233 5 516 215 6 759 28 2 Dewey et al. (29) USA (boys) 687 233 25 499 270 20 Dewey et al. (29) USA (girls) 605 197 25 402 228 22 Krebs et al. (28) USA 640 150 71
Michaelsen et al. (40) Denmark 318 201 18
Pao et al. (217) USA 554 3
Paul et al. (223) UK 484 182 21 340 206 18 251 274 12 Paul et al. (223) UK 506 255 16 367 266 12 443 319 7 Prentice et al. (224) UK 493 216 38 342 228 31 328 292 19
Rattigan et al. (219) Australia 884 252 4 880 74 4 Stuff & Nichols (26) USA 551 142 19
Stuff & Nichols (26) USA 602 186 18 522 246 18
Stuff & Nichols (26) USA 677 242 8 645 250 8 565 164 8 van Raaij et al. (221) Netherlands 573 187 16
Whitehead & Paul (27) UK (boys) 484 181 21 342 203 18 Whitehead & Paul (27) UK (girls) 481 246 15 329 242 11
WHO (225) Sweden 452 301 28
Mean, weighted for sample size 569 417 497 691 516 497
Pooled SD 188 226 249 233 215 238
N 251 123 154 5 6 48
Number of study groups 11 8 11 1 1 4
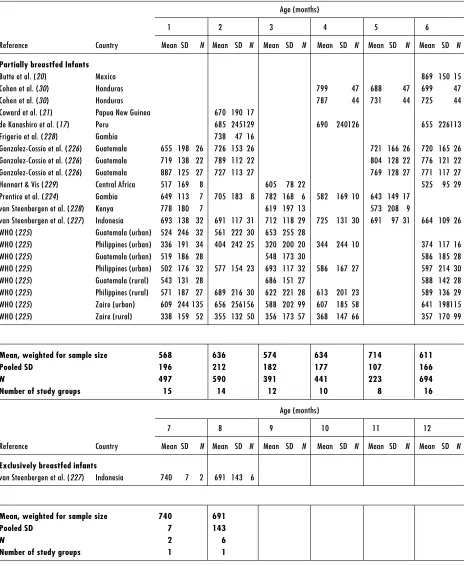
Table 3. Human-milk intake of infants from developing countries
Age (months)
1 2 3 4 5 6
Reference Country Mean SD N Mean SD N Mean SD N Mean SD N Mean SD N Mean SD N
Exclusively breastfed infants
Butte et al. (20) Mexico 885 146 15
Cohen et al. (30) Honduras 806 50 824 50 823 50 Gonzalez-Cossio et al. (226) Guatemala 661 135 27 749 143 27 776 153 27
Table 3. Human-milk intake of infants from developing countries (continued)
Age (months)
1 2 3 4 5 6
Reference Country Mean SD N Mean SD N Mean SD N Mean SD N Mean SD N Mean SD N
Partially breastfed Infants
Butte et al. (20) Mexico 869 150 15
Cohen et al. (30) Honduras 799 47 688 47 699 47 Cohen et al. (30) Honduras 787 44 731 44 725 44 Coward et al. (21) Papua New Guinea 670 190 17
de Kanashiro et al. (17) Peru 685 245129 690 240126 655 226113 Frigerio et al. (228) Gambia 738 47 16
Gonzalez-Cossio et al. (226) Guatemala 655 198 26 726 153 26 721 166 26 720 165 26 Gonzalez-Cossio et al. (226) Guatemala 719 138 22 789 112 22 804 128 22 776 121 22 Gonzalez-Cossio et al. (226) Guatemala 887 125 27 727 113 27 769 128 27 771 117 27 Hennart & Vis (229) Central Africa 517 169 8 605 78 22 525 95 29 Prentice et al. (224) Gambia 649 113 7 705 183 8 782 168 6 582 169 10 643 149 17
van Steenbergen et al. (228) Kenya 778 180 7 619 197 13 573 208 9
van Steenbergen et al. (227) Indonesia 693 138 32 691 117 31 712 118 29 725 131 30 691 97 31 664 109 26 WHO (225) Guatemala (urban) 524 246 32 561 222 30 653 255 28
WHO (225) Philippines (urban) 336 191 34 404 242 25 320 200 20 344 244 10 374 117 16 WHO (225) Guatemala (urban) 519 186 28 548 173 30 586 185 28 WHO (225) Philippines (urban) 502 176 32 577 154 23 693 117 32 586 167 27 597 214 30 WHO (225) Guatemala (rural) 543 131 28 686 151 27 588 142 28 WHO (225) Philippines (rural) 571 187 27 689 216 30 622 221 28 613 201 23 589 136 29 WHO (225) Zaire (urban) 609 244 135 656 256156 588 202 99 607 185 58 641 198115 WHO (225) Zaire (rural) 338 159 52 355 132 50 356 173 57 368 147 66 357 170 99
Mean, weighted for sample size 568 636 574 634 714 611
Pooled SD 196 212 182 177 107 166
N 497 590 391 441 223 694
Number of study groups 15 14 12 10 8 16
Age (months)
7 8 9 10 11 12
Reference Country Mean SD N Mean SD N Mean SD N Mean SD N Mean SD N Mean SD N
Exclusively breastfed infants
van Steenbergen et al. (227) Indonesia 740 7 2 691 143 6
Mean, weighted for sample size 740 691
Pooled SD 7 143
N 2 6
2 . H U M A N - M I L K I N T A K E D U R I N G E X C L U S I V E B R E A S T F E E D I N G I N T H E F I R S T Y E A R O F L I F E
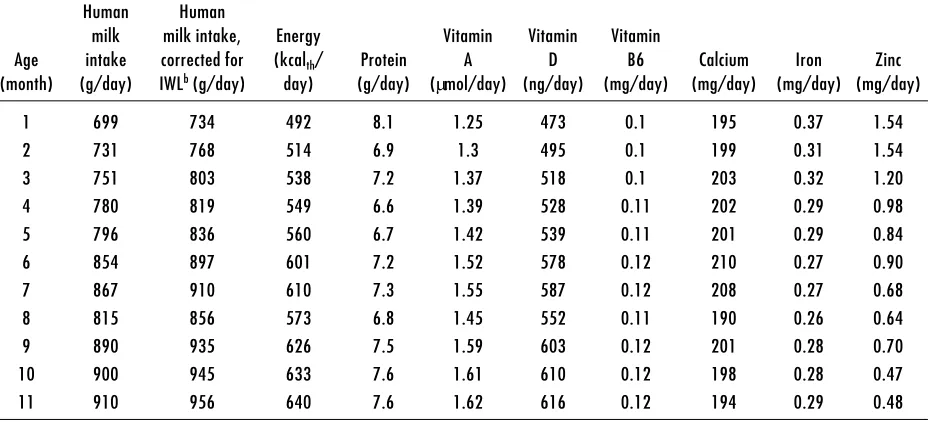
Table 4. Nutrient intakes derived from human milka
Human Human
milk milk intake, Energy Vitamin Vitamin Vitamin
Age intake corrected for (kcalth/ Protein A D B6 Calcium Iron Zinc
(month) (g/day) IWLb (g/day) day) (g/day) (µmol/day) (ng/day) (mg/day) (mg/day) (mg/day) (mg/day)
1 699 734 492 8.1 1.25 473 0.1 195 0.37 1.54
2 731 768 514 6.9 1.3 495 0.1 199 0.31 1.54
3 751 803 538 7.2 1.37 518 0.1 203 0.32 1.20
4 780 819 549 6.6 1.39 528 0.11 202 0.29 0.98
5 796 836 560 6.7 1.42 539 0.11 201 0.29 0.84
6 854 897 601 7.2 1.52 578 0.12 210 0.27 0.90
7 867 910 610 7.3 1.55 587 0.12 208 0.27 0.68
8 815 856 573 6.8 1.45 552 0.11 190 0.26 0.64
9 890 935 626 7.5 1.59 603 0.12 201 0.28 0.70
10 900 945 633 7.6 1.61 610 0.12 198 0.28 0.47
Table 3. Human-milk intake of infants from developing countries (continued)
Age (months)
7 8 9 10 11 12
Reference Country Mean SD N Mean SD N Mean SD N Mean SD N Mean SD N Mean SD N
Partially breastfed Infants
Coward et al. (21) Papua New Guinea 936 173 8
de Kanashiro et al. (17) Peru 624 219 110 565 208 100
Hennart & Vis (229) Central Africa 580 73 39 582 55 43 van Steenbergen et al. (227) Indonesia 617 80 28 635 149 23
WHO (225) Philippines (urban) 321 156 16
WHO (225) Philippines (urban) 558 183 31 548 158 29 WHO (225) Guatemala (urban) 587 186 28
WHO (225) Zaire (urban) 613 193 72 593 192 60 WHO (225) Guatemala (rural) 602 187 28
WHO (225) Philippines (rural) 534 176 32 502 185 26 WHO (225) Zaire (rural) 378 153 91 407 174 85
Mean, weighted for sample size 688 635 516 565 511
Pooled SD 106 149 167 208 164
N 36 23 337 100 243
added solids at 6 months and 93% added solids at 7 months (28).
In a Canadian study, the growth performance of 36 exclusively breastfed infants was monitored (22). The number (percent) of children displaying growth faltering – defined as below the NCHS 10th weight-for-age percentile – increased from 3 (8.3%) at 4 months to 5 (13.6%) at 5 months, 8 (22.2%) at 6 months, 9 (25%) at 7 months, and 12 (33.3%) at 8 months. Even in well-nourished women, exclusive breastfeeding did not sustain growth beyond 4 months of age according to the 1977 growth curves; furthermore, growth faltering was associated with higher rates of infectious morbidity.
Breastfed boys consistently consumed more human milk than breastfed girls did (29, 27). Girls tended to be exclusively breastfed longer than boys were; comp-lementary foods were offered to boys at 4.1 months and to girls at 4.9 months (27). In the same study, after 4 months only 20% of the boys and 35% of the girls were exclusively breastfed. Complementary feeding resulted in some increase in total energy intake in boys but not in girls.
Since exclusive breastfeeding is rare in developing countries, the number of observational studies on human-milk intakes of exclusively breastfed infants is limited. An intervention study was conducted in Honduras where one group (n=50) was required to breastfeed exclusively for 6 months (30). Although this is an important study, it may not be totally represen-tative of all mothers and infants in that community. Sixty-four women were ineligible to participate because they did not maintain exclusive breastfeeding through 16 weeks for the following reasons: insufficient milk (n=26), personal choice (n=16), maternal health (n=12), and family pressure not to breastfeed exclusively (n=10). Weight gain (1092±356 g) in the exclusively breastfed group was similar to the supplemented groups; however, the SD (±409 g) of weight gain of exclusively breastfed infants of mothers with low BMI was greater than the supplemented infants in both groups. It is unclear whether all infants were growing satisfactorily. Based on this limited number of studies, intakes of exclusively breastfed infants were, on average, similar to those of infants between 4 and 6 months of age from developed countries.
More recently, encouraging results have accrued from community-based breastfeeding promotion programmes in developing countries. For example, an intervention conducted in Mexico to promote exclusive breastfeeding succeeded in increasing rates of predominant breast-feeding above controls at 3 months postpartum from
12% in controls to 50% and 67% in the experimental groups (31). Rates of exclusive breastfeeding were 12% in controls and 38–50% in experimental groups. Although the programme succeeded in promoting exclusive breastfeeding, it did not approach the goal of exclusive breastfeeding for 6 months.
Meanwhile, in Dhaka, Bangladesh, counsellors – local mothers who received 10 days’ training – paid 15 home-based counselling visits (2 in the last trimester of pregnancy, 3 early postpartum, and fortnightly until infants were 5months old) in the intervention group (32). For the primary outcome, the prevalence of exclusive breastfeeding at 5 months was 202/228 (70%) for the intervention group and 17/285 (6%) for the control group. For the secondary outcomes, mothers in the intervention group initiated breastfeeding earlier than control mothers and were less likely to give prelacteal and postlacteal foods. At day 4, significantly more mothers in the intervention group breastfed exclusively than controls.
2.4
Summary
Longitudinal studies conducted among well-nourished women indicate that, during exclusive breastfeeding, human-milk production rates gradually increase from ~700 g/day to 850 g/day at 6 months. Because of the high attrition rates in these studies, the corresponding milk-production rates represent only a select group of women and thus do not reflect the population variability in milk production and infant nutrient requirements.
Exclusive breastfeeding at 6 months is not a common practice in developed countries and appears to be rarer still in developing countries. Moreover, there is a serious lack of documentation and evaluation of human-milk intakes of 6-month-old exclusively breastfed infants from developing countries. A limitation to the uniform recommendation of exclusive breastfeeding for the first 6 months of life is the lack of understanding of reasons for the marked attrition rates in exclusive breastfeeding, even among highly motivated women, in the lactation period of interest.
3. Energy and specific nutrients
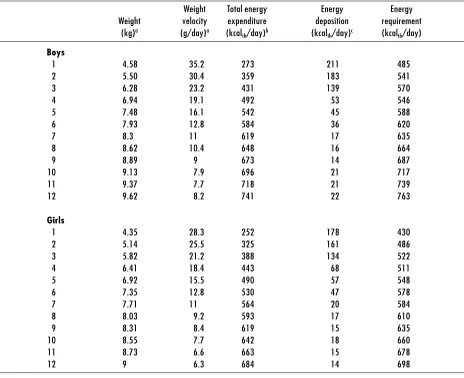
Total energy requirements of breastfed infants (Table 5) were estimated using weight at the 50th percentile of the WHO pooled breastfed data set (8). An allowance for growth was derived from the weight gains at the 50th percentile of the WHO pooled breastfed data set (8), the rates of fat and protein accretion, and the energy equivalents of protein and fat deposition taken as 5.65 kcalth/g and 9.25 kcalth/g, respectively (37). The TEE of breastfed infants (36) was predicted at monthly intervals using the equation TEE (kcalth/day) = 92.8 * Weight (kg) – 151.7.
Energy intakes based on the mean milk intakes of exclusively breastfed infants appeared to meet mean energy requirements during the first 6 months of life. Since infant size and growth potential drive energy intake, it is reasonable to assume a positive relationship between energy intake and energy requirements. Positive correlations between energy intake and infant weight, and energy intake and weight gain, have been reported (37–39). The matching of intake to require-ments for energy is unique in this regard. Thus, it is likely that infant energy needs can be met for 6 months, and possibly longer, by women wishing to breastfeed exclusively this long. The major shortcoming appears to be the marked attrition rates in exclusive breast-feeding, even among women who seem to be highly motivated and who have presumably good support networks. There is a major gap in our understanding of the role – and the relative positive or negative contribution – of biological and social determinants of observed attrition rates.
3.1.3 Summary
3 . E N E R G Y A N D S P E C I F I C N U T R I E N T S3.1
Energy
3.1.1 Energy content of human milk
Proteins, carbohydrates and lipids are the major contributors to the energy content of human milk (33). Protein and carbohydrate concentrations change with duration of lactation, but they are relatively invariable between women at any given stage of lactation. In contrast, lipid concentrations vary significantly between both individual women and populations, which accounts for the variation observed in the energy content of human milk.
Differences in milk sampling and analytical methods also contribute to the variation in milk energy (34, 35). Within-day, within-feeding, and between-breast variations in milk composition; interference with milk “let-down”; and individual feeding patterns affect the energy content of human milk. In the present context, two milk-sampling approaches have been used to estimate the energy content of human milk – expression of the entire contents of one or both breasts at a specific time or for a 24-hour period, and collection of small aliquots of milk at different intervals during a feed. Human milk’s energy content was determined directly from its heat of combustion measured in an adiabatic calorimeter, or indirectly from the application of physiological fuel values to the proximate analysis of milk protein, lactose and fat.
The mean energy content of human milk ranges from 0.62 kcalth/g to 0.80 kcalth/g (33). For present purposes, a value of 0.67 kcalth/g has been assumed.
wish to breastfeed exclusively can meet their infants’ energy needs for 6 months.
3.2 Proteins
3.2.1 Dietary proteins
Dietary proteins provide approximately 8% of the exclusively breastfed infant’s energy requirements and the essential amino acids necessary for protein synthesis. Thus, the quantity and quality of proteins are both important. Because protein may serve as a source of energy, failure to meet energy needs decreases the efficiency of protein utilization for tissue accretion and other metabolic functions. Protein undernutrition produces long-term negative effects on growth and neurodevelopment.
3.2.2 Protein composition of human milk
The protein content of mature human milk is approx-imately 8–10 g/l (33). The concentration of protein changes as lactation progresses. By the second week postpartum, when the transition from colostrum to mature milk is nearly complete, the concentration of protein is approximately 12.7 g/l (40). This value drops to 9 g/l by the second month, and to 8 g/l by the fourth month where it appears to remain until well into the weaning process when milk volumes fall substantially. At this point protein concentrations increase as involution of the mammary gland progresses. The inter-individual variation of the protein content of human milk, whose basis is unknown (41), is approximately 15%.
Several methods have been used to analyse the protein content of human milk and each has yielded different results with implications for the physiology and
Table 5. Energy requirements of breastfed Infants
Weight Total energy Energy Energy
Weight velocity expenditure deposition requirement (kg)a (g/day)a (kcal
th/day)b (kcalth/day)c (kcalth/day)
Boys
1 4.58 35.2 273 211 485
2 5.50 30.4 359 183 541
3 6.28 23.2 431 139 570
4 6.94 19.1 492 53 546
5 7.48 16.1 542 45 588
6 7.93 12.8 584 36 620
7 8.3 11 619 17 635
8 8.62 10.4 648 16 664
9 8.89 9 673 14 687
10 9.13 7.9 696 21 717
11 9.37 7.7 718 21 739
12 9.62 8.2 741 22 763
Girls
1 4.35 28.3 252 178 430
2 5.14 25.5 325 161 486
3 5.82 21.2 388 134 522
4 6.41 18.4 443 68 511
5 6.92 15.5 490 57 548
6 7.35 12.8 530 47 578
7 7.71 11 564 20 584
8 8.03 9.2 593 17 610
9 8.31 8.4 619 15 635
10 8.55 7.7 642 18 660
11 8.73 6.6 663 15 678
12 9 6.3 684 14 698
nutrition of the breastfed infant (42). Direct analyses include the determination of total nitrogen by the Kjeldahl method and total amino-acid analysis. To derive the protein nitrogen content by the Kjeldahl method, the NPN fraction is separated by acid precipitation. Indirect analyses based on the protein molecule’s characteristics include the Biuret method (peptide bond), Coomassie-Blue/BioRad, BCA method (dye-binding sites) and the Lowry method (tyrosine and phenylalanine content). The Biuret method, whose results conflict with the BCA method, is not recommended for use in human milk because of high background interference. The Lowry method, although efficient, is subject to technical difficulties (e.g. spectrophotometric interference by lipids and cells, differential reaction of proteins in human milk with the colour reagent, and appropriate protein standard representative of complex, changing mixture). The protein content of mature human milk is approximately 9 g/l by the Kjeldahl method (33), and approximately 12–14 g/l by the Lowry and BCA methods (43, 23, 44). The 25% higher values obtained by the Lowry method have been attributed to using bovine serum albumin (BSA), which has fewer aromatic amino acids than human milk, as the standard. As a result, some investi-gators have adjusted milk-protein concentrations determined by the Lowry method (45).
Although it is known that the stage of lactation influences the content and relative amounts of protein in human milk, the physiological mechanisms that regulate their levels have not been identified nor has the role of diet been well defined. Based on field studies, human milk’s total protein concentration does not appear to differ among populations at distinct levels of nutritional risk. However, difficulties arise in interpreting published data because total protein content often has been estimated from measurements of total nitrogen. This presents problems because in well-nourished populations approximately 25% of nitrogen is not bound to protein. However, in contrast to conclusions reached in field studies, when dietary protein was increased from 8 to 20% of energy
consensus in the literature as to whether low-protein diets result in reduced milk volumes, and therefore in reduced protein outputs (47, 46, 48). Longer-term studies are needed in diverse populations to help resolve these gaps in knowledge.
3.2.3 Total nitrogen content of human milk
Human milk’s total nitrogen content, which appears to depend on the stage of lactation and dietary intakes, ranges from 1700 to 3700 mg/l. Eighteen to 30% of the total nitrogen in milk is non-protein nitrogen (NPN). Approximately 30% of NPN are amino acids (5, 49) and thus should be fully available to the infant. As much as 50% of NPN may be bound to urea (5, 49) and the remaining approximately 20% is found in a wide range of compounds such as nitrogen-containing carbo-hydrates, choline, nucleotides and creatinine (50). Changes in the relative composition of non-protein nitrogen, as lactation progresses, are not well described. From the limited information available, NPN appears to decrease by approximately 30% over the first 3 months of lactation (51). If this nitrogen fraction behaves similarly to protein, it should remain stable thereafter until possibly weaning is well under way.
3.2.4 Approaches used to estimate protein
requirements
Several approaches have been used to estimate protein requirements for infants and children. At present the protein intake of breastfed infants from 0 to 6 months of age is considered the standard for reasons reviewed by the 1994 IDECG report on protein and energy requirements (5). However, two other approaches also have been used to assess the protein requirements of infants – balance methods and factorial estimations.
The 1985 FAO/WHO/UNU Report on Energy and Protein Requirements (52) states the rationale for using the protein intakes of exclusively breastfed infants from 0 to 6 months of age to estimate requirements: “The protein needs of an infant will be met if its energy needs
Table 6), but changes in energy and protein requirements for growth do not appear to be proportionately synchronous. Evolutionary arguments presented for or against the adequacy of exclusive breastfeeding are equally unconvincing because of their basic teleological character. As will be evident below, the absence of sounder physiological data makes the use of human milk intakes during this age interval the best available choice.
The 1996 IDECG report on energy and protein requirements (5) reviewed the flaws in the 1985 FAO/ WHO/UNU protein requirement estimates for infants (52). These are the assumption that at 1 month of lactation protein concentrations in milk are sustained (indeed, as discussed above, they fall); possible underestimation of milk-intake volumes (because some investigators decided not to measure insensible water
losses when milk intakes are determined by test-weighing techniques, although this probably represents a trivial source of error); and failures to account for either the non-protein component of human milk or the possible under-utilization of some of the milk’s protein constituents because of their resistance to digestion. The following reasons are posited for these inaccurate estimates.
Discomfort with reliance on intake data collected mostly under “opportunistic” situations has led to comparing estimates based on ad libitum intakes with nitrogen balance data, and “armchair estimates” based on the factorial approach. Of the two bases for comparisons, balance data are less satisfactory. Many of the difficulties with balance data arise because often they have been obtained from undernourished infants during repletion, or from premature infants. In either case these infants’
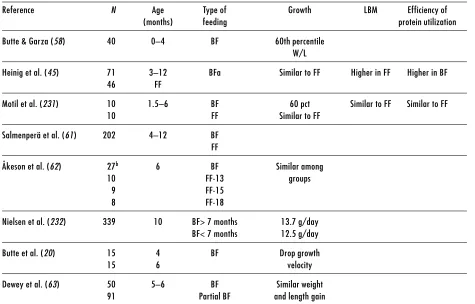
Table 6. Efficiency of protein utilization: growth and body composition of breastfed infants and infants consuming infant formula with varying protein concentrations
Reference N Age Type of Growth LBM Efficiency of
(months) feeding protein utilization
Butte & Garza (58) 40 0–4 BF 60th percentile
W/L
Heinig et al. (45) 71 3–12 BFa Similar to FF Higher in FF Higher in BF
46 FF
Motil et al. (231) 10 1.5–6 BF 60 pct Similar to FF Similar to FF
10 FF Similar to FF
Salmenperä et al. (61) 202 4–12 BF FF
Åkeson et al. (62) 27b 6 BF Similar among
10 FF-13 groups
9 FF-15
8 FF-18
Nielsen et al. (232) 339 10 BF> 7 months 13.7 g/day BF< 7 months 12.5 g/day
Butte et al. (20) 15 4 BF Drop growth
15 6 velocity
Dewey et al. (63) 50 5–6 BF Similar weight
91 Partial BF and length gain
Abbreviations:
W/L: weight-for-length percentile of the NCHS reference, 1977 LBM: lean body mass
BF: breastfed FF: formula-fed
aBreastfeeding and solids after 6 months.
physiological condition renders difficult extrapolation to healthy term infants. Moreover, the complexities imposed by relationships between energy intake and efficiencies of protein utilization, and by differences in utilization efficiencies due to the varying biological values and amounts of proteins fed in balance studies, significantly lessen the value of balance results for the purpose of directly estimating protein requirements for healthy term infants.
Thus, the factorial approach, which requires estimating maintenance needs, protein accreted during growth and efficiency of utilization, appears more attractive than balance methods. Maintenance needs are based on obligatory losses and the progressive loss of efficiency in protein utilization as levels of protein increase. Utilization efficiency is believed to be maximal below requirement levels and to become progressively less efficient as requirement levels are approached and surpassed.
The 1996 IDECG report used results from multiple studies to estimate maintenance needs (5). This estimate was calculated by extrapolating relationships between nitrogen intake and retention to a y intercept of 10 mg N/kg per day to account for integumental losses, and by adjusting relationships between intake and retention to an assumed slope of 0.73. In the report the maintenance requirement was estimated to be 90 mg N/kg per day. An alternative approach, which requires fewer assumptions and less manipulation of experimental data, is the use of basal metabolism to estimate obligatory losses (53). Although this approach was abandoned in the 1985 report because of inconsistent ratios across several ages, it appears reasonably consistent in the age range of interest, i.e. the range of values in published studies of children 4 to 15 months of age is 1.2 to 1.5 mg N per “basal” kcalth (53). For 1- and 4-month-old exclusively breastfed infants, minimal observable energy expenditure rates are approximately 45 kcalth/kg per day (54). If one uses 1.5 mg N per “basal” kcalth as a conservative estimate, obligatory losses are 68 mg N/kg per day and extrapo-lations of this value to 6 or 8 months present no
utilization for growth in the intake range of interest. Most studies that have examined the absorption of human-milk nitrogen and specific human milk-protein components have been preformed among premature infants (55, 56). In examining this issue, Donovan et al. (55) reported apparent absorption rates of 85%, which confirmed earlier data published by Schanler et al. (56). These rates of absorption are remarkably similar to those summarized by Fomon (57) for infants fed various types of cow’s milk-based formulas. These estimates all include losses of both dietary and endogenous nitrogen, thus available data likely underestimate “true” dietary absorption rates. If we nevertheless accept the value for purposes of estimating dietary N requirements, the figure adjusted for absorption is 125 mg N/kg per day.
Taking this “conservative” approach, however, is not as unbalanced as it may first appear. The absorption of human milk’s immunological components has been a major concern because of their functional role and putative resistance to digestion. Studies examining this issue also have been performed principally in preterm infants (55, 56). Analyses by Donovan et al. (55) for specific components suggested a maximum absorption rate of 75% for SIgA and 91% for lactoferrin. The apparent absorption rates for lactoferrin reported by these investigators agree with the earlier studies published by Schanler et al. (56). However, the SIgA values in the two studies are quite different. Schanler et al. (56) reported total apparent SIgA absorption rates of 91% compared to the mean of 75% by Donovan et al. (55). This disparity likely reflects the different analytical methods used for measuring SIgA.
The estimated requirement for efficiency of utilization must also be corrected. Once again, the best data have been published from studies of premature infants. If we accept the efficiency of utilization of 0.73 adopted by the IDECG group, the N needs of infants in this age range are approximately 171 mg N/kg per day.
This estimate compares well with the mean protein N intakes reported by Butte et al. (16) for breastfed infants
ledge of factors that account for this five-fold range in utilization rates and the variability of this component in human milk, the presumption of its use and significance to infant nutrition appears tenuous. The decision was thus taken not to include it further in the above calculations.
It is possible to estimate the prevalence of inadequacy from these data using the probability approach that was taken in the 1996 IDECG report. A requirement of approximately 170 mg N/kg, which is close to the report’s “Model C”, yielded a population inadequacy prevalence of approximately 8%.
3.2.5 Protein intake and growth
Butte et al. examined the adequacy of protein intake from human milk by determining protein intakes and growth of exclusively breastfed infants from middle to upper economic groups in Houston, TX (16, 58). Protein intake was 1.6±0.3 g/kg per day at 1 month and 0.9±0.2 g/kg per day at 4 months of age. The mean
Z-scores of these infants’ weights and lengths were consistently greater than zero (based on the WHO pooled breastfed data set) (Table 7) until the fourth month when the mean declined to slightly below zero. Later, Heinig et al. (45) evaluated a sample of breastfed infants from 0 to 12 months of age enrolled in the DARLING Study. Protein intakes of breastfed infants at 3 months were comparable to those reported by Butte et al. (1.1±0.22 g/kg per day), and they remained at approximately 1.1±0.3 g/kg per day through 6 months of exclusive breastfeeding. Weight-for-age Z-scores were between 0.5 and 0 for the first 6 months of life (59).
Two other studies, also conducted in developed countries, reported that after the first 2 to 3 months breastfed infants gained weight less rapidly than formula-fed infants (60, 61). In both studies infants were not exclusively breastfed and there was a significant drop (17.5 to 45%) in sample size over time. The unstable anthropometric Z-scores in both studies are thus difficult to evaluate.
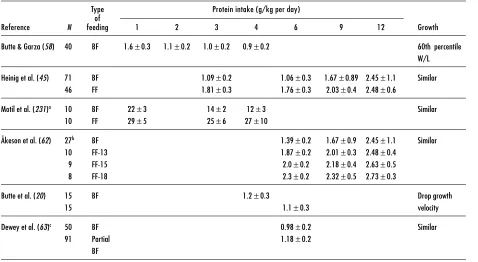
Table 7. Protein intake of breastfed and formula-fed infants
Type Protein intake (g/kg per day) of
Reference N feeding 1 2 3 4 6 9 12 Growth
Butte & Garza (58) 40 BF 1.6±0.3 1.1±0.2 1.0±0.2 0.9±0.2 60th percentile W/L Heinig et al. (45) 71 BF 1.09±0.2 1.06±0.3 1.67±0.89 2.45±1.1 Similar
46 FF 1.81±0.3 1.76±0.3 2.03±0.4 2.48±0.6
Motil et al. (231)a 10 BF 22±3 14±2 12±3 Similar
10 FF 29±5 25±6 27±10
Åkeson et al. (62) 27b BF 1.39±0.2 1.67±0.9 2.45±1.1 Similar
10 FF-13 1.87±0.2 2.01±0.3 2.48±0.4 9 FF-15 2.0±0.2 2.18±0.4 2.63±0.5 8 FF-18 2.3±0.2 2.32±0.5 2.73±0.3
Butte et al. (20) 15 BF 1.2±0.3 Drop growth
15 1.1±0.3 velocity
Dewey et al. (63)c 50 BF 0.98±0.2 Similar
91 Partial 1.18±0.2
BF
Abbreviations: BF: breastfed FF: Formula-fed
W/L: weight-for-length percentile of the NCHS reference, 1977
aProteins are in mmol/kg per day.